 Multi-family
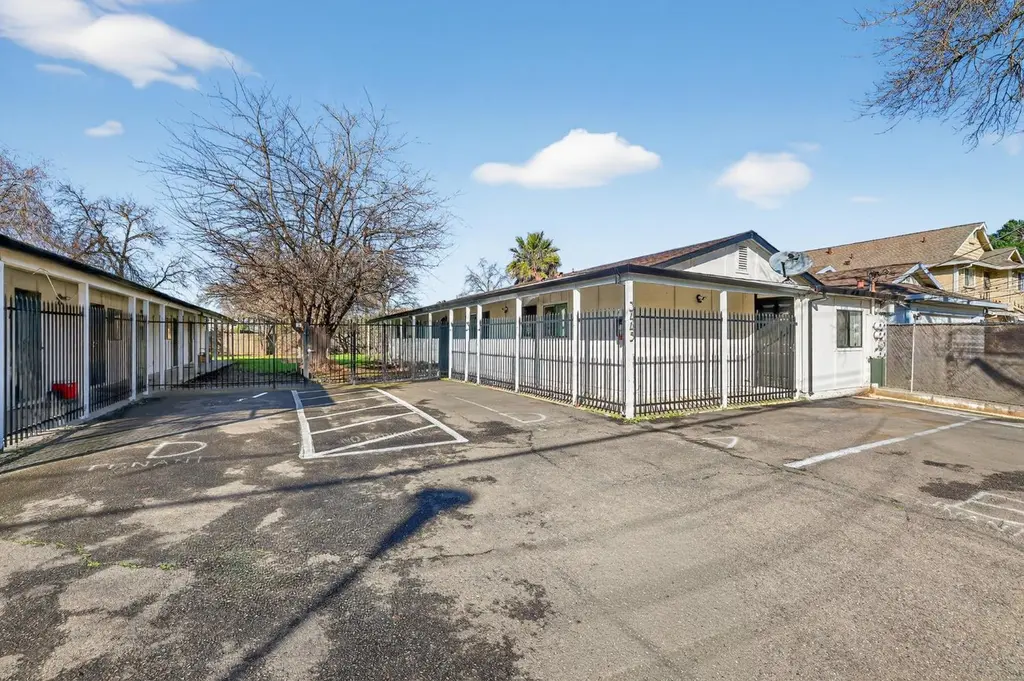
3445 Altos Ave · Sacramento, CA
Flood risk 6/10 · Moderate
- FEMA flood zone
- X
- Chance of flooding over 30 yrs
- 0.27%
- Est. flood insurance / yr
- $507 – $1,088
Fire risk 1/10 · Minimal
- Est. fire insurance / yr
- $659 – $1,223
Heat risk 7/10 · Major
- Hot days now (above 102°F)
- 7 days/yr
- Hot days in 30 yrs
- 15 days/yr
Wind risk 1/10 · Minimal
- Chance of severe wind over 30 yrs
- —
Air-quality risk 10/10 · Severe
- Unhealthy air days now
- 33 days/yr
- Unhealthy air days in 30 yrs
- 38 days/yr
Risk factors via First Street. Map © Google.
Why this score? — see what drove the C- grade
The composite is a weighted blend of 9 inputs, each scored 0–100. Each bar is that input's sub-score; the figure is the points it added to the 100-point composite (weight × sub-score).
- Cash flow +25.6/30.0
- DSCR +8.5/10.0
- 1% rule +5.7/10.0
- Livability +3.6/5.0
- Schools +3.1/10.0
- Condition / age +2.5/5.0
- Rent growth +1.8/5.0
- ARV discount +0.0/15.0
- Appreciation +0.0/10.0
$1,195,000
🖨 Deal sheet (PDF) 📄 Offer letter ✓ Due diligence
Multi-family units
County records classify this as Multi-Family (5+ Unit). Listing-text estimate: 1 unit. estimate disagrees with records
5+ unit building — per-unit beds/baths from public records are typically unavailable; the breakdown below (if shown) is an estimate from the listing text.
Listing remarks
* * * 3445 Altos Ave must be purchased with 3441 Altos Avenue & 3836 43rd Avenue, This is a portfolio sale of three separate 4plexes that must be purchased together as a package * * * Colliers is pleased to present an attractive multifamily value-add opportunity in the Sacramento region: 3441-3445 Altos Avenue and 3836 43rd Avenue. This portfolio features three well-located, income-producing 4-plex properties totaling 12 units, 3445 Altos Avenue comprises two identical 4-plex buildings constructed in 1973, each approximately 2,000 square feet on individual 0.16-acre parcels. The combined unit mix consists of eight 1-bedroom/1-bath units. Currently operating at approximately 20%
Key facts
- Multiple parks
- Local restaurants
- 0.32 acre lot
Tags
Neighborhood map
What this means for you Summary
Snapshot
- This is a 4-bed/4.0-bath multifamily listed at $1.20M.
Deal economics
- At list price, monthly cash flow is $3k ($34k/yr) — positive.
- The deal already cash-flows at list — no discount required.
- Meets the 1% rule at list price ($13k rent vs $1.20M).
- Recommended offer: $1.09M (9.0% below list) — sets the bar for market timing.
- Cap rate 9.1% vs local median 3.0% in Sacramento — top-decile yield for the area; either an underpriced asset or a hidden risk that comps aren't pricing in. Stress-test before assuming the spread holds.
Location & tenants
- Location reads 71/100 on livability (#218 in CA) — a middle-class / working-renter tenant base. Strengths: amenities A+, commute A+, housing A; Watch: schools D+, crime F, cost of living F.
- Twin Rivers Unified (suburban): math 29% / reading 37% proficiency, ranked #970 of 1,400 in CA (top 69%) — families likely to look elsewhere, expect single-tenant / working-renter base with shorter leases; 76% free/reduced lunch — lower-income household profile, screen leases tightly.
- Market conditions: Rents soft (-2.7%/yr); 164 active listings in the ZIP; 9 comparable units currently listed for rent nearby; rentals leasing fast (median 3d on market — plan ~1-2 weeks tenant-placement turnaround); 6,825 units permitted in Sacramento County in 2024 (1,752 in 5+ unit buildings).
- At $12,751/mo this rent would consume 224% of the median local household income ($68k/yr) (locally 1834% of renters already pay >50% of income on rent) — very limited rent-growth headroom before tenants either downsize or default.
Forward outlook
- Local home prices are declining (-3.0%/yr); year-one equity from $8k of loan paydown is wiped out by about $36k of value loss. Plan a longer hold.
- Sacramento County population projected at +17% by 2050 — long-run rental-demand tailwind backs the buy-and-hold thesis.
Negotiation context
- It's been on market 102 days — a 9% lower offer ($1.09M) is reasonable based on typical stale-listing flexibility.
- Current owner paid $912k; 31% above their basis — modest negotiation headroom, anchor on the comps not their cost.
Risks & watch-outs
- Climate carrying-cost: major flood risk; extreme-heat days projected 7→15/yr by 2055 (HVAC capex compounding) — expect insurance premiums to compound above CPI over the hold.
Questions for the listing agent
- It's been on market 102 days. Have you received any prior offers? Is the seller open to a 9% concession, seller financing, or rate buy-down credit?
- Built in 1973 — when were the roof, HVAC, electrical panel, plumbing, and water heater last replaced?
- Why hasn't it sold? Are there any deal-killer items the seller is aware of (foundation, flood, title, zoning, code violations)?
- Is there a deadline driving the sale (1031 exchange, divorce, estate, relocation)? That informs how much negotiation room exists.
- Schools are D-rated, which usually means shorter tenancies and higher turnover. Who's the typical renter profile here, and what's been the actual vacancy rate?
- Crime grade is F in this area — have there been break-ins, vandalism, or insurance claims at this property in the last 3 years? What carrier currently insures it and at what premium?
- What's the average days-on-market for RENTAL listings here right now (not sales)? A rising rental-DOM trend means longer vacancies and softer asking-rent achievability than the comps imply.
- What's the recent tenant-quality profile in this submarket — average credit score on applications, eviction rate, late-payment / NSF rate, and stable-employment percentage? A property-management company in the area should have these aggregated.
- How much new apartment / multifamily construction is in the pipeline within 1–3 miles? Heavy new supply (>2% of stock underway) typically softens rents 12–24 months out; light construction supports rent growth.
Investment metrics
- 1% rule
- 1.07% ✓
- Cap rate
- 9.13%
- Cash-on-cash
- 10.13%
- DSCR
- 1.45
- GRM
- 7.8
CMA / ARV
- ARV (median comp)
- $805,680
- List price
- $1,195,000
- Delta
- 48.32%
- Verdict
- OVERPRICED
- Comps
- 8 within 1.0 mi
Show comp detail 5 sales within ~0.75 mi
| Address | Dist | Beds/Ba | Sqft | Sold | Price | $/sf | Match |
|---|---|---|---|---|---|---|---|
| 680 Ford Rd | 0.15mi | 4/1.0 | 2,028 (+2%) | 12mo | $470,000 | $232 | 66 |
| 3305 - 3307 Altos Ave | 0.23mi | 4/2.0 | 1,800 (-9%) | 19mo | $375,000 | $208 | 50 |
| 3309 - 3311 Altos Ave | 0.21mi | 4/1.0 | 1,800 (-9%) | 18mo | $380,000 | $211 | 48 |
| 757 - 761 Carroll Ave | 0.23mi | 4/2.0 | 1,800 (-9%) | 24mo | $382,000 | $212 | 46 |
| 1100 Roanoke Ave | 0.48mi | 5/4.0 (+1) | 2,100 (+6%) | 23mo | $575,000 | $274 | 43 |
Match score weights: distance 35% · size 25% · config 20% · recency 20%. Top-matched comps best support the ARV.
Projected returns pro-forma
-3.0% appreciation · 0.0% rent growth · sell at horizon
- IRR
- -4.2%
- Equity multiple
- 0.85×
- Total profit
- $-51,488
- Equity at exit
- $178,178
- IRR
- 2.0%
- Equity multiple
- 1.12×
- Total profit
- $40,726
- Equity at exit
- $103,322
Cash invested: $334,600 (down + closing). Projections, not guarantees.
Landlord ↔ Tenant lean methodology
- Overall (STATE)
- 18 Strongly Tenant-Friendly
- State California
- 18 Strongly Tenant-Friendly · D+13
- County
- — inherits STATE
- City
- — inherits STATE
ZIP-level market 95838
- Rents YoY
- -2.7%
- Active inventory
- 164
- Price-to-rent
- 62.5×
Monthly cashflow live
- Estimated rent
- $12,751 high interval (Pro) →
- Mortgage (P&I)
- −$6,267
- Tax from tax record
- −$483 /mo · $5,799/yr
- Insurance
- −$498
- HOA
- −$0
- Vacancy / Maint / Mgmt
- −$2,678
- Net cashflow
- $2,825
Break-even live
Sensitivity live
| Price | -10% $3,502 | -5% $3,164 | +0% $2,825 | +5% $2,487 | +10% $2,149 |
|---|---|---|---|---|---|
| Rent | -10% $1,818 | -5% $2,322 | +0% $2,825 | +5% $3,329 | +10% $3,833 |
| Rate | -1.0pp $3,427 | -0.5pp $3,129 | base $2,825 | +0.5pp $2,516 | +1.0pp $2,201 |
8-unit breakdown (identical units grouped — click to expand)
| Units | Beds | Baths | Est. rent |
|---|---|---|---|
| 8× units | 1 | 1 | $12,752 |
| #1 | 1 | 1 | $1,594 |
| #2 | 1 | 1 | $1,594 |
| #3 | 1 | 1 | $1,594 |
| #4 | 1 | 1 | $1,594 |
| #5 | 1 | 1 | $1,594 |
| #6 | 1 | 1 | $1,594 |
| #7 | 1 | 1 | $1,594 |
| #8 | 1 | 1 | $1,594 |
| Total (8 units) | $12,751 | ||
UW: 25.0% down · 7.5% · 30yr · 1.5% tax · 5.0% vac · 8.0% maint · 8.0% mgmt
Financing live
Cash to close
- Down payment
- $298,750
- Closing costs
- $35,850
- Reserves months
- —
- Total cash needed
- —
Loan-product check · same deal, 3 products live
Conventional
25% down · 7.5% · 30yr
- Down + closing
- —
- Monthly P&I
- —
- Monthly cashflow
- —
- DSCR
- —
- Eligible?
- —
Personal DTI + credit; lowest rate.
DSCR
20% down · 8.5% · 30yr
- Down + closing
- —
- Monthly P&I
- —
- Monthly cashflow
- —
- DSCR
- —
- Eligible?
- —
No personal income docs; deal must DSCR.
Hard money
10% down · 12.0% · 12mo
- Down + closing
- —
- Monthly P&I
- —
- Monthly cashflow
- —
- DSCR
- —
- Eligible?
- —
Short-term bridge; refi at stabilization.
Rent comps 9 comps
| Address | Beds | Baths | Sqft | Rent | $/sqft | DOM | Units | Dist |
|---|---|---|---|---|---|---|---|---|
| 3231 Del Mar Way Sacramento, CA | 3.0 | 1.0 | 1380 | $2,095 | $1.52 | 17d | 1 | 0.72mi |
| 917 Blaine Ave Sacramento, CA | 4.0 | 2.0 | 1558 | $3,000 | $1.93 | 0d | 1 | 1.05mi |
| 2680 Grove Ave Unit NA Sacramento, CA | 3.0 | 1.0 | 1360 | $2,500 | $1.84 | 3d | 1 | 1.11mi |
| 2680 Grove Ave Sacramento, CA | 3.0 | 1.0 | 1360 | $2,700 | $1.99 | 3d | 1 | 1.11mi |
| 1013 Santiago Ave Sacramento, CA | 3.0 | 2.0 | 1300 | $2,148 | $1.65 | 3d | 1 | 1.26mi |
| 3226 Pilgrim Ct Sacramento, CA | 3.0 | 1.0 | 1300 | $2,700 | $2.08 | 0d | 1 | 1.26mi |
| 2472 Ben Ali Way Sacramento, CA | 3.0 | 2.5 | 1318 | $3,450 | $2.62 | 3d | 1 | 1.35mi |
| 4426 Dry Creek Rd Sacramento, CA | 3.0 | 2.5 | 1408 | $2,700 | $1.92 | 0d | 1 | 1.41mi |
| 581 Summer Garden Way Sacramento, CA | 4.0 | 2.0 | 1500 | $2,800 | $1.87 | 3d | 1 | 1.43mi |
Listing history 18 events
-
2026-06-21days on market $1,195,000 Active 102 DOM
-
2026-06-18days on market $1,195,000 Active 99 DOM
-
2026-06-17days on market $1,195,000 Active 98 DOM
-
2026-06-16days on market $1,195,000 Active 97 DOM
-
2026-06-15days on market $1,195,000 Active 96 DOM
-
2026-06-13days on market $1,195,000 Active 94 DOM
-
2026-06-13pricedays on market $1,195,000 Active 93 DOM
-
2026-06-09days on market $599,000 Active 90 DOM
-
2026-06-08days on market $599,000 Active 89 DOM
-
2026-06-07days on market $599,000 Active 88 DOM
-
2026-06-03days on market $599,000 Active 84 DOM
-
2026-06-02days on market $599,000 Active 83 DOM
-
2026-06-01days on market $599,000 Active 82 DOM
-
2026-05-31days on market $599,000 Active 81 DOM
-
2018-10-31soldstatus $912,500
-
2014-02-28soldstatus $180,000
-
2009-12-23soldstatus $140,000
-
2009-08-20soldstatus $110,000
ⓘ Source: listings_history table (triggers on properties + properties_extension) + one-shot
backfill from property_details.listing_events for pre-trigger history.
Tax reassessment forecast CA · Resets to sale price
- Current annual tax
- $5,799 · $483/mo
- Projected year-2 tax
- $9,082 · $757/mo
- Expected delta
- +$3,283/yr (+$274/mo · 56.6%)
ⓘ Screening estimate from a state-policy table — verify with the county assessor before closing.
Climate risk First Street
- Flood 6/10 Major FEMA zone X · 27% chance over 30 yrs
- Wildfire 1/10 Low
- Heat 7/10 Severe 7 d/yr ≥102°F today · 15 d/yr by 30 yrs out
- Wind 1/10 Low
- Air quality 10/10 Extreme 33 unhealthy d/yr today · 38 by 30 yrs out
Nearby sold comps map
Loading sold comps map…
Walkable amenities ~0.75 mi
Loading nearby amenities…
Taxation est. · year 1
- Rental income
- $153,012
- − Mortgage interest
- −$66,939
- − Property taxes
- −$5,799
- − Insurance
- −$5,975
- − Repairs & maintenance
- −$12,241
- − Management
- −$12,241
- − Depreciation
- −$34,764
- Taxable income
- $15,054
- Est. tax owed @ 24.0%
- −$3,613
- After-tax cash flow
- $30,292/yr
For passive investors: Depreciation is non-cash, so a rental often shows a tax loss while cash-flowing — sheltering income. Rental losses are passive: they offset passive income freely, and up to $25,000/yr can offset ordinary (W-2) income if you actively participate and your MAGI is under $100k (phasing out to $0 by $150k); unused losses carry forward. On sale, claimed depreciation is recaptured at up to 25%, and gains may owe capital-gains tax (a 1031 exchange can defer both). Figures are a year-1 estimate at your 24.0% rate — not tax advice; consult a CPA.
Schools (NCES district)
- District
- Twin Rivers Unified
- NCES district ID
- 0601332
- Math proficiency
- 29% ▲ 2.00%
- Reading proficiency
- 37% ▲ 2.00%
- Median HH income
- $42,481
- Composite
- 30.67/100
- National rank
- #11437
- State rank
- #970 of 1400 in CA
Livability — Sacramento
- Score
- 71/100
- State rank
- #218
- US rank
- #6957
Category grades
Schools grade is shown separately in the Schools card above.
Census & demographics
- Census place
- Sacramento, CA
- County
- Sacramento County · 1,539,646 people
- City population
- 761,410
- Metro
- Sacramento-Roseville-Folsom, CA
- Population (ZIP)
- 40,677
- Household income
- $68,349
- Rent vs Own
- Severe rent burden
- 1834.0
Population outlook (Sacramento County) Hauer SSP2
- Today (2025)
- 1,660,763 people
- By 2030
- 1,732,990 · +4.3%
- By 2040
- 1,855,755 · +11.7%
- By 2050
- 1,941,335 · +16.9%
- By 2075
- 2,046,162 · +23.2%
- By 2100
- 1,961,444 · +18.1%
Race, ethnicity, and origin ACS 2023
- Neighborhood character
- Highly diverse neighborhood (Simpson 0.77)
- Race & ethnicity
- Hispanic / Latino 37% White 21% Asian 18% Two or more races 15% Black 13% Pacific Islander 2%
- Hispanic origin (detail)
- Mexican 33%
- Common ancestry
- Scotch-Irish 2% Subsaharan African 1% Scottish 1%
- Foreign-born
- 25% · Canada, Vietnam, China
- Languages at home
- 55% English-only · Spanish 22% Other Asian/Pacific 10% Other Indo-European 5%
Political lean MEDSL · Sacramento
- 2024 margin
- D (+19.7) · D 58.1% · R 38.4% · Other 3.5%
- 2008→2024 swing
- +0.7pp no change · 2008: 19.0pp · 2024: 19.7pp
- All cycles
- 2024: D+19.7 2020: D+25.3 2016: D+23.7 2012: D+16.3 2008: D+19.0
Not yet ingested
- Civics
- —
Market trends
- HPI YoY
- ▼ -391.80%
- Current HPI
- 415.1804
- Rent YoY
- ▼ -2.74%
- Metro
- Sacramento-Roseville-Folsom, CA
- State GDP YoY
- ▲ 3.21%
- F500 in state
- 116
Industry mix (Fortune 500 HQ in CA)
| Industry | F500 HQs | Revenue |
|---|---|---|
| Technology | 27 | $1,492B |
|
||
| Financial Services | 3 | $174B |
|
||
| Retail | 3 | $44B |
|
||
| Insurance | 3 | $26B |
|
||
| Media / Entertainment | 2 | $115B |
|
||
| Pharmaceuticals / Biotech | 2 | $62B |
|
||
Price history
+729.5% since first listed4 events — show timeline
- 2018-10-31 Sold (Public Records) $912,500 Public Records
- 2014-02-28 Sold (Public Records) $180,000 Public Records
- 2009-12-23 Sold (Public Records) $140,000 Public Records
- 2009-08-20 Sold (Public Records) $110,000 Public Records
Property tax history
+11.8%/yrLatest (2025): $5,799 · +3.9% YoY. Source: county tax records.
Cash-flow waterfall
monthlySold comps — $/sqft
last 12 mo · ≤1 miLoading sold comps…