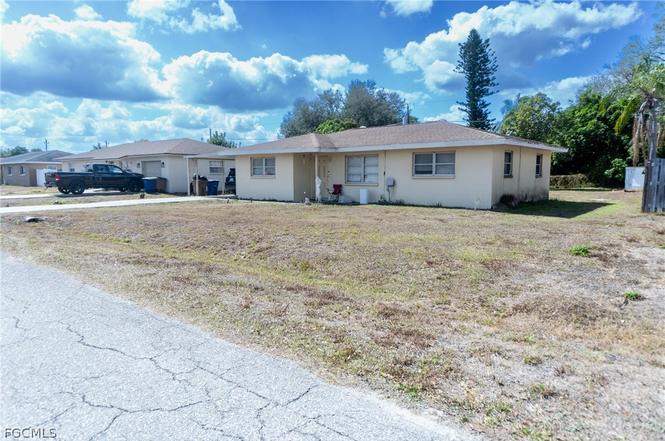
2201 Lotus Rd · Fort Myers Shores, FL
Flood risk 3/10 · Minor
- FEMA flood zone
- AE
- Chance of flooding over 30 yrs
- 0.12%
- Est. flood insurance / yr
- $1,737 – $8,500
Fire risk 3/10 · Minor
- Est. fire insurance / yr
- $947 – $1,759
Heat risk 10/10 · Severe
- Hot days now (above 107°F)
- 7 days/yr
- Hot days in 30 yrs
- 28 days/yr
Wind risk 10/10 · Severe
- Chance of severe wind over 30 yrs
- 99.0%
Air-quality risk 2/10 · Minimal
- Unhealthy air days now
- 1 days/yr
- Unhealthy air days in 30 yrs
- 1 days/yr
Risk factors via First Street. Map © Google.
Why this score? — see what drove the B- grade
The composite is a weighted blend of 9 inputs, each scored 0–100. Each bar is that input's sub-score; the figure is the points it added to the 100-point composite (weight × sub-score).
- Cash flow +25.1/30.0
- ARV discount +15.0/15.0
- DSCR +8.2/10.0
- 1% rule +5.2/10.0
- Schools +4.1/10.0
- Livability +3.5/5.0
- Condition / age +2.5/5.0
- Rent growth +1.8/5.0
- Appreciation +0.0/10.0
$185,000
🖨 Deal sheet 📄 Offer letter ✓ Due diligence
Listing remarks
Calling all investors! Don’t miss this opportunity to own a well-located property in Fort Myers with no HOA. 2201 Lotus Rd offers a functional layout with bright, flexible living spaces and a lot that provides room to relax, entertain, or customize to your needs. Located in an established neighborhood, this home is conveniently close to shopping, dining, schools, downtown Fort Myers, and Southwest Florida International Airport. Easy access to major roadways makes daily commuting simple. Ideal for homeowners or investors seeking value and potential in a desirable Fort Myers location.
Key facts
- Functional layout
- No hoa
- Close to shopping
Tags
Neighborhood map
What this means for you Summary
Snapshot
- This is a 3-bed/2.0-bath single-family listed at $185k.
Deal economics
- At list price, monthly cash flow is $-17 ($-208/yr) — negative.
- To cash-flow at today's rent, offer at most $182k (1.7% below list).
- Meets the 1% rule at list price ($2k rent vs $185k).
- Recommended offer: $179k (3.0% below list) — sets the bar for market timing.
- Cap rate 8.9% vs local median 3.1% in Fort Myers Shores — top-decile yield for the area; either an underpriced asset or a hidden risk that comps aren't pricing in. Stress-test before assuming the spread holds.
Location & tenants
- Location reads 70/100 on livability (#433 in FL) — a middle-class / working-renter tenant base. Strengths: cost of living A+, housing A+, crime B; Watch: schools F, amenities F, commute F.
- Lee (suburban): math 47% / reading 50% proficiency, ranked #42 of 73 in FL (top 58%) — families likely to look elsewhere, expect single-tenant / working-renter base with shorter leases.
- Market conditions: Rents soft (-3.0%/yr); 763 active listings in the ZIP; 18 comparable units currently listed for rent nearby; rentals at typical pace (median 24d on market — plan ~3-4 weeks tenant-placement turnaround); 15,411 units permitted in Lee County in 2024 (4,686 in 5+ unit buildings).
- This rent runs 32% of the median local income ($72k/yr) — at the standard rent-burdened threshold; future hikes will face affordability resistance.
Forward outlook
- Local home prices are declining (-3.0%/yr); year-one equity from $1k of loan paydown is wiped out by about $6k of value loss. Plan a longer hold.
- Lee County population projected at +44% by 2050 — long-run rental-demand tailwind backs the buy-and-hold thesis.
Negotiation context
- It's been on market 35 days — a 3% lower offer ($179k) is reasonable based on typical stale-listing flexibility.
- 2 sale attempts with the ask held roughly flat each time — persistent listings suggest the price (not the market) is what's stuck; bring a comps-based counter.
- Current owner paid $83k; list at $185k implies a 123% gain — meaningful room to come down on a strong offer.
Risks & watch-outs
- Watch-outs: flood insurance adds $427/mo.
- Climate carrying-cost: in FEMA flood zone AE (mandatory federal flood insurance); severe wind risk, 99% chance of damaging wind over 30y; extreme-heat days projected 7→28/yr by 2055 (HVAC capex compounding) — expect insurance premiums to compound above CPI over the hold.
Questions for the listing agent
- What do current leases actually rent for vs. the listed asking? Can we see a recent rent roll and the last 12 months of T-12 income?
- It's been on market 35 days. Have you received any prior offers? Is the seller open to a 3% concession, seller financing, or rate buy-down credit?
- Built in 1972 — when were the roof, HVAC, electrical panel, plumbing, and water heater last replaced?
- What's the actual annual flood-insurance premium (NFIP or private), and is the property in a SFHA with mandatory coverage?
- Is there a deadline driving the sale (1031 exchange, divorce, estate, relocation)? That informs how much negotiation room exists.
- Schools are F-rated, which usually means shorter tenancies and higher turnover. Who's the typical renter profile here, and what's been the actual vacancy rate?
- What's the average days-on-market for RENTAL listings here right now (not sales)? A rising rental-DOM trend means longer vacancies and softer asking-rent achievability than the comps imply.
- What's the recent tenant-quality profile in this submarket — average credit score on applications, eviction rate, late-payment / NSF rate, and stable-employment percentage? A property-management company in the area should have these aggregated.
- How much new for-sale + rental construction is in the pipeline within 1–3 miles? Heavy new supply typically softens prices + rents 12–24 months out; constrained supply supports both.
Investment metrics
- 1% rule
- 1.02% ✓
- Cap rate
- 8.95%
- Cash-on-cash
- 9.48%
- DSCR
- 1.42
- GRM
- 8.2
CMA / ARV
- ARV (on-the-fly)
- $256,632
- Comps found
- 10
Show comp detail 10 sales within ~0.75 mi
| Address | Dist | Beds/Ba | Sqft | Sold | Price | $/sf | Match |
|---|---|---|---|---|---|---|---|
| 2330 Caladium Rd | 0.21mi | 2/2.0 (-1) | 1,220 (+6%) | 7mo | $187,500 | $154 | 70 |
| 13007 3rd St | 0.35mi | 3/2.0 | 1,276 (+10%) | 9mo | $180,000 | $141 | 59 |
| 12931 Fifth St | 0.24mi | 4/2.0 (+1) | 1,304 (+13%) | 5mo | $290,000 | $222 | 58 |
| 12373 Fourth St | 0.51mi | 3/2.0 | 1,176 (+2%) | 20mo | $259,999 | $221 | 57 |
| 2026 Bahama Ave | 0.23mi | 2/2.0 (-1) | 1,296 (+12%) | 17mo | $240,000 | $185 | 50 |
| 2225 Havana Ave | 0.55mi | 2/2.0 (-1) | 1,304 (+13%) | 4mo | $355,000 | $272 | 44 |
| 12379 Fourth St | 0.50mi | 3/1.0 | 988 (-14%) | 10mo | $200,000 | $202 | 40 |
| 13505 Island Rd | 0.70mi | 3/2.0 | 1,316 (+14%) | 7mo | $460,000 | $350 | 39 |
| 12602 2nd St | 0.48mi | 3/1.0 | 1,004 (-13%) | 22mo | $225,000 | $224 | 33 |
| 2350 Poinciana Blvd | 0.66mi | 3/1.0 | 982 (-15%) | 24mo | $235,000 | $239 | 20 |
Match score weights: distance 35% · size 25% · config 20% · recency 20%. Top-matched comps best support the ARV.
Projected returns pro-forma
-3.0% appreciation · 0.0% rent growth · sell at horizon
- IRR
- -20.9%
- Equity multiple
- 0.30×
- Total profit
- $-36,449
- Equity at exit
- $27,584
- IRR
- -25.6%
- Equity multiple
- -0.04×
- Total profit
- $-53,875
- Equity at exit
- $15,995
Cash invested: $51,800 (down + closing). Projections, not guarantees.
Landlord ↔ Tenant lean methodology
- Overall (STATE)
- 87 Strongly Landlord-Friendly
- State Florida
- 87 Strongly Landlord-Friendly · R+3
- County
- — inherits STATE
- City
- — inherits STATE
ZIP-level market 33905
- Home prices YoY
- -31.4%
- Rents YoY
- -3.0%
- Active inventory
- 763
- Price-to-rent
- 8.2×
Monthly cashflow live
- Estimated rent
- $1,891 high interval (Pro) →
- Mortgage (P&I)
- −$970
- Tax from tax record
- −$37 /mo · $445/yr
- Insurance
- −$77
- Flood insurance flood zone
- −$427 /mo · $5,118/yr
- HOA
- −$0
- Vacancy / Maint / Mgmt
- −$397
- Net cashflow
- $-17
Break-even live
UW: 25.0% down · 7.5% · 30yr · 1.5% tax · 5.0% vac · 8.0% maint · 8.0% mgmt
Financing live
Cash to close
- Down payment
- $46,250
- Closing costs
- $5,550
- Reserves months
- —
- Total cash needed
- —
Loan-product check · same deal, 3 products live
Conventional
25% down · 7.5% · 30yr
- Down + closing
- —
- Monthly P&I
- —
- Monthly cashflow
- —
- DSCR
- —
- Eligible?
- —
Personal DTI + credit; lowest rate.
DSCR
20% down · 8.5% · 30yr
- Down + closing
- —
- Monthly P&I
- —
- Monthly cashflow
- —
- DSCR
- —
- Eligible?
- —
No personal income docs; deal must DSCR.
Hard money
10% down · 12.0% · 12mo
- Down + closing
- —
- Monthly P&I
- —
- Monthly cashflow
- —
- DSCR
- —
- Eligible?
- —
Short-term bridge; refi at stabilization.
Rent comps 18 comps
| Address | Beds | Baths | Sqft | Rent | $/sqft | DOM | Units | Dist |
|---|---|---|---|---|---|---|---|---|
| 2231 Lotus Rd Fort Myers, FL | 3.0 | 2.0 | 1312 | $1,885 | $1.44 | 3d | 1 | 0.07mi |
| 12937 Fourth St Fort Myers, FL | 2.0 | 1.0 | 1236 | $1,900 | $1.54 | 23d | 1 | 0.28mi |
| 13208 Fourth St Fort Myers, FL | 3.0 | 1.0 | 1103 | $1,500 | $1.36 | 3d | 1 | 0.39mi |
| 12619 Third St Fort Myers, FL | 3.0 | 1.0 | 1015 | $1,950 | $1.92 | 23d | 1 | 0.42mi |
| 12941 1st St #943 Fort Myers, FL | 2.0 | 1.0 | 875 | $1,350 | $1.54 | 23d | 1 | 0.45mi |
| 2804 River Ridge Blvd Fort Myers, FL | 2.0 | 2.0 | 1404 | $1,350 | $0.96 | 23d | 1 | 0.45mi |
| 12607 1st St Fort Myers, FL | 2.0 | 1.0 | 798 | $1,200 | $1.50 | 23d | 1 | 0.50mi |
| 13214 1st St Fort Myers, FL | 4.0 | 2.0 | 1405 | $2,000 | $1.42 | 3d | 1 | 0.50mi |
| 2143 W Tobago Cir Fort Myers, FL | 3.0 | 2.0 | 1326 | $1,800 | $1.36 | 23d | 1 | 0.53mi |
| 12274 1st St Fort Myers, FL | 3.0 | 1.0 | 1014 | $1,495 | $1.47 | 2d | 1 | 0.69mi |
| 12274 1st St Fort Myers, FL | 3.0 | 1.0 | 1014 | $1,545 | $1.52 | 15d | 1 | 0.69mi |
| 13832 1st St Fort Myers, FL | 3.0 | 2.0 | 1164 | $1,900 | $1.63 | 14d | 1 | 0.96mi |
| 13861 First St Unit 13863 Fort Myers, FL | 2.0 | 1.0 | 875 | $1,400 | $1.60 | 23d | 1 | 1.02mi |
| 13926 1st St Fort Myers, FL | 3.0 | 1.0 | 982 | $1,550 | $1.58 | 15d | 1 | 1.06mi |
| 13650 Caribbean Blvd Fort Myers, FL | 3.0 | 1.0 | 1040 | $1,700 | $1.63 | 21d | 1 | 1.07mi |
| 3071 Meandering Way #101 Fort Myers, FL | 2.0 | 2.0 | 1421 | $3,000 | $2.11 | 23d | 1 | 1.08mi |
| 3111 Meandering Way #101 Fort Myers, FL | 2.0 | 2.0 | 1421 | $2,700 | $1.90 | 23d | 1 | 1.15mi |
| 2510 Barcelona Ave Fort Myers, FL | 4.0 | 2.0 | 1257 | $1,870 | $1.49 | 3d | 1 | 1.37mi |
Listing history 10 events
-
2026-04-13status Pending
-
2026-03-16status Active
-
2026-03-06status Pending
-
2026-01-23$185,000 Active
-
2015-03-02price $78,400
-
2002-09-23soldstatus $82,900
-
2002-09-12soldstatus $82,900
-
2001-09-27soldstatus $58,000
-
1994-02-16soldstatus $45,500
-
1994-01-31soldstatus $45,500
ⓘ Source: listings_history table (triggers on properties + properties_extension) + one-shot
backfill from property_details.listing_events for pre-trigger history.
Tax reassessment forecast FL · Resets to sale price
- Current annual tax
- $445 · $37/mo
- Projected year-2 tax
- $1,536 · $128/mo
- Expected delta
- +$1,090/yr (+$91/mo · 244.8%)
ⓘ Screening estimate from a state-policy table — verify with the county assessor before closing.
Climate risk First Street
- Flood 3/10 Moderate FEMA zone AE · 12% chance over 30 yrs
- Wildfire 3/10 Moderate
- Heat 10/10 Extreme 7 d/yr ≥107°F today · 28 d/yr by 30 yrs out
- Wind 10/10 Extreme 99% chance of damaging wind over 30 yrs
- Air quality 2/10 Low 1 unhealthy d/yr today · 1 by 30 yrs out
Nearby sold comps map
Loading sold comps map…
Walkable amenities ~0.75 mi
Loading nearby amenities…
Taxation est. · year 1
- Rental income
- $22,687
- − Mortgage interest
- −$10,363
- − Property taxes
- −$445
- − Insurance
- −$6,044
- − Repairs & maintenance
- −$1,815
- − Management
- −$1,815
- − Depreciation
- −$5,382
- Taxable loss
- −$3,176
- Est. tax savings @ 24.0%
- +$762
- After-tax cash flow
- $555/yr
For passive investors: Depreciation is non-cash, so a rental often shows a tax loss while cash-flowing — sheltering income. Rental losses are passive: they offset passive income freely, and up to $25,000/yr can offset ordinary (W-2) income if you actively participate and your MAGI is under $100k (phasing out to $0 by $150k); unused losses carry forward. On sale, claimed depreciation is recaptured at up to 25%, and gains may owe capital-gains tax (a 1031 exchange can defer both). Figures are a year-1 estimate at your 24.0% rate — not tax advice; consult a CPA.
Schools (NCES district)
- District
- Lee
- NCES district ID
- 1201080
- Math proficiency
- 47% ▼ -11.00%
- Reading proficiency
- 50% ▼ -4.00%
- Median HH income
- $49,518
- Composite
- 41.49/100
- National rank
- #3458
- State rank
- #42 of 73 in FL
Livability — Fort Myers Shores
- Score
- 70/100
- State rank
- #433
- US rank
- #7747
Category grades
Schools grade is shown separately in the Schools card above.
Census & demographics
- Census place
- Fort Myers Shores, FL
- County
- Lee County · 788,662 people
- Metro
- Cape Coral-Fort Myers, FL
- Population (ZIP)
- 41,381
- Household income
- $71,987
- Rent vs Own
- Severe rent burden
- 1358.0
Population outlook (Lee County) Hauer SSP2
- Today (2025)
- 871,946 people
- By 2030
- 955,468 · +9.6%
- By 2040
- 1,113,587 · +27.7%
- By 2050
- 1,256,891 · +44.1%
- By 2075
- 1,560,270 · +78.9%
- By 2100
- 1,726,848 · +98.0%
Race, ethnicity, and origin ACS 2023
- Neighborhood character
- Diverse neighborhood (Simpson 0.59)
- Race & ethnicity
- White 53% Hispanic / Latino 34% Two or more races 17% Black 9% Native American 4% Asian 2%
- Hispanic origin (detail)
- Mexican 11% Puerto Rican 5% Cuban 2%
- Common ancestry
- Romanian 2% Slovak 2% Lithuanian 2%
- Foreign-born
- 20% · Canada, Jamaica
- Languages at home
- 68% English-only · Spanish 29% Other Indo-European 1% German/W. Germanic 1%
Political lean MEDSL · Lee
- 2024 margin
- Strong R (+28.4) · D 35.5% · R 63.9%
- 2008→2024 swing
- -18.0pp toward R · 2008: -10.4pp · 2024: -28.4pp
- All cycles
- 2024: R+28.4 2020: R+19.2 2016: R+20.4 2012: R+16.6 2008: R+10.4
Not yet ingested
- Civics
- —
Market trends
- HPI YoY
- ▼ -122.89%
- Current HPI
- 268.4598
- Rent YoY
- ▼ -2.97%
- Metro
- Cape Coral-Fort Myers, FL
- State GDP YoY
- ▲ 3.28%
- F500 in state
- 36
Industry mix (Fortune 500 HQ in FL)
| Industry | F500 HQs | Revenue |
|---|---|---|
| Industrial Technology | 2 | $29B |
|
||
| Insurance | 2 | $17B |
|
||
| Retail | 1 | $60B |
|
||
| Technology Distribution | 1 | $58B |
|
||
| Homebuilding | 1 | $35B |
|
||
| Technology Manufacturing | 1 | $35B |
|
||
Price history
+306.6% since first listed10 events — show timeline
- 2026-04-13 Pending — FORTMLS
- 2026-03-16 Relisted — FORTMLS
- 2026-03-06 Pending — FORTMLS
- 2026-01-23 Listed $185,000 FORTMLS
- 2015-03-02 Price Changed $78,400 FORTMLS
- 2002-09-23 Sold (Public Records) $82,900 Public Records
- 2002-09-12 Sold (MLS) $82,900 FORTMLS
- 2001-09-27 Sold (Public Records) $58,000 Public Records
- 1994-02-16 Sold (Public Records) $45,500 Public Records
- 1994-01-31 Sold (Public Records) $45,500 Public Records
Property tax history
+6.3%/yrLatest (2025): $445 · +12.9% YoY. Source: county tax records.
Cash-flow waterfall
monthlySold comps — $/sqft
last 12 mo · ≤1 miLoading sold comps…