51 Grande Camino Way · Lakewood Park, FL
Flood risk 3/10 · Minor
- FEMA flood zone
- X (unshaded)
- Chance of flooding over 30 yrs
- 0.2%
- Est. flood insurance / yr
- $507 – $1,088
Fire risk 4/10 · Minor
- Est. fire insurance / yr
- $947 – $1,759
Heat risk 10/10 · Severe
- Hot days now (above 107°F)
- 7 days/yr
- Hot days in 30 yrs
- 25 days/yr
Wind risk 10/10 · Severe
- Chance of severe wind over 30 yrs
- 99.0%
Air-quality risk 1/10 · Minimal
- Unhealthy air days now
- 0 days/yr
- Unhealthy air days in 30 yrs
- 0 days/yr
Risk factors via First Street. Map © Google.
Why this score? — see what drove the D+ grade
The composite is a weighted blend of 9 inputs, each scored 0–100. Each bar is that input's sub-score; the figure is the points it added to the 100-point composite (weight × sub-score).
- Cash flow +15.0/30.0
- ARV discount +7.5/15.0
- 1% rule +5.0/10.0
- DSCR +5.0/10.0
- Condition / age +3.8/5.0
- Schools +3.7/10.0
- Livability +3.2/5.0
- Rent growth +2.5/5.0
- Appreciation +0.0/10.0
$49,900
🖨 Deal sheet 📄 Offer letter ✓ Due diligence
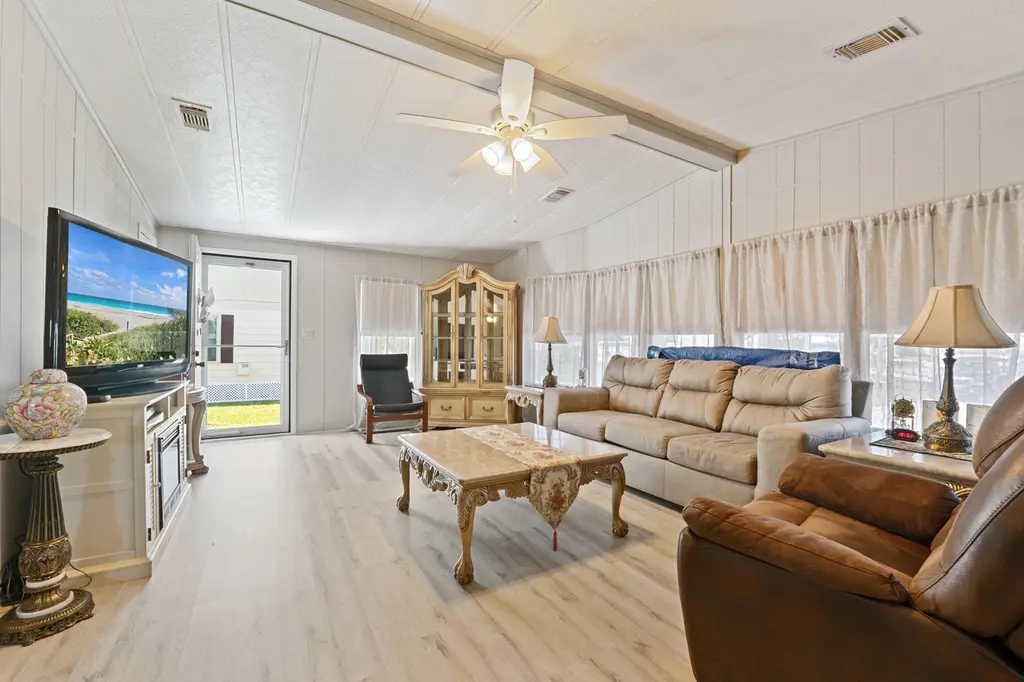
Listing remarks
Owner says bring on all offer. All will be considered. Needs to sell ASAP. This could be your opportunity. One of the Biggest homes in Neighborhood. Nice quiet street. Community with all the amenities you you could want. Elegant and large 2 bed 2 bath home. Tastefully updated to meet the needs of any buyer. Expansive living space. All the expensive things are done, New Roof, New Barrier in crawl space, New AC and more. SS appliances. See attached list for all updates. Don't miss your chance at this great home. REPAIRS PERFORMED ON HOME " NEW ROOF IN 2020 " NEW 40 GALLON WATER HEATER 2019 " NEW 4 TON AIR CONDITIONER 2019 " TWO NEW TOILET BOWLS (HIGHER THAN NORMAL) 2024 &
Key facts
- New floors
- Ss appliances
- New ac
Tags
Property features AI
Finance
- Financial info: Land lease of $844 per month (expires 2026-10-31)
- HOA & community: Association: Spanish Lakes; Monthly association fee: $844; Association amenities include clubhouse, fitness center, heated pool, pool, golf course, tennis courts, pickleball courts, bocce ball, shuffleboard, billiard room, cafe/restaurant, and other recreation facilities; Association fee covers cable TV, grounds maintenance, trash, common areas, golf, and pool service; Senior community; Pets allowed (pet restrictions possible)
Exterior
- Parking: Total 4 parking spaces; Attached carport (1 covered); 2 open driveway spaces; Concrete driveway
- Security: Smoke detector(s)
- Utilities: Public water; Public sewer; 100 amp electric service; Cable available; Electricity available; Sewer connected; Water connected
- Home design: Manufactured home (double wide, modular); Single-story; Entry level on level 1; Faces west; Resale condition
- Construction: Shingle roof; Brick/mortar foundation; Brick skirt; Mobile home remains
- Exterior features: Not waterfront
Interior
- Kitchen: Dishwasher; Microwave; Refrigerator; Electric cooktop; Freezer
- Bedrooms: 2 bedrooms on the main level
- Flooring: Tile; Wood
- Bathrooms: 2 full bathrooms (main level)
- Heating & cooling: Central heating; Central individual cooling; Ceiling fan(s)
- Interior features: Built-in features; Kitchen island; Casement windows; Smoke detector(s)
- Laundry & utility: Inside laundry
Neighborhood map
What this means for you Summary
Snapshot
- This is a 2-bed/2.0-bath single-family listed at $50k. Condition is rated good.
Deal economics
- At list price, monthly cash flow is $697 ($8k/yr) — positive.
- The deal already cash-flows at list — no discount required.
- Meets the 1% rule at list price ($2k rent vs $50k).
- Recommended offer: $49k (1.5% below list) — sets the bar for market timing.
- Cap rate 23.1% vs local median 5.7% in Lakewood Park — top-decile yield for the area; either an underpriced asset or a hidden risk that comps aren't pricing in. Stress-test before assuming the spread holds.
Location & tenants
- Location reads 63/100 on livability (#719 in FL) — a middle-class / working-renter tenant base. Strengths: cost of living A+, housing A+; Watch: schools F, amenities F, commute F.
- St. Lucie (urban): math 40% / reading 48% proficiency, ranked #51 of 73 in FL (top 70%) — families likely to look elsewhere, expect single-tenant / working-renter base with shorter leases.
- Market conditions: 292 active listings in the ZIP; 13 comparable units currently listed for rent nearby; rentals at typical pace (median 21d on market — plan ~3-4 weeks tenant-placement turnaround); 4,868 units permitted in St. Lucie County in 2024 (268 in 5+ unit buildings).
- At $2,387/mo this rent would consume 45% of the median local household income ($63k/yr) (locally 140% of renters already pay >50% of income on rent) — very limited rent-growth headroom before tenants either downsize or default.
Forward outlook
- Local home prices are declining (-3.0%/yr); year-one equity from $345 of loan paydown is wiped out by about $1k of value loss. Plan a longer hold.
- St. Lucie County population projected at +20% by 2050 — long-run rental-demand tailwind backs the buy-and-hold thesis.
- At projected returns (-3.0% appreciation + 3.0% rent growth), your $14k cash investment doubles in ~2 years — after that, you're playing with house money.
Negotiation context
- It's been on market 20 days — a 2% lower offer ($49k) is reasonable based on typical stale-listing flexibility.
- 5 sale attempts since 12y ago with the ask held roughly flat each time — persistent listings suggest the price (not the market) is what's stuck; bring a comps-based counter.
Risks & watch-outs
- Watch-outs: HOA is 35% of rent.
- Climate carrying-cost: severe wind risk, 99% chance of damaging wind over 30y; extreme-heat days projected 7→25/yr by 2055 (HVAC capex compounding) — expect insurance premiums to compound above CPI over the hold.
Questions for the listing agent
- What does the HOA fee cover, when was the last increase, and are there any pending special assessments or reserve-fund shortfalls?
- Is there a deadline driving the sale (1031 exchange, divorce, estate, relocation)? That informs how much negotiation room exists.
- Schools are F-rated, which usually means shorter tenancies and higher turnover. Who's the typical renter profile here, and what's been the actual vacancy rate?
- The area grade is low — what's the realistic commute time and amenity access for the typical tenant pool here? Any planned neighborhood developments (good or bad) we should know about?
- What's the average days-on-market for RENTAL listings here right now (not sales)? A rising rental-DOM trend means longer vacancies and softer asking-rent achievability than the comps imply.
- What's the recent tenant-quality profile in this submarket — average credit score on applications, eviction rate, late-payment / NSF rate, and stable-employment percentage? A property-management company in the area should have these aggregated.
- How much new for-sale + rental construction is in the pipeline within 1–3 miles? Heavy new supply typically softens prices + rents 12–24 months out; constrained supply supports both.
Investment metrics
- 1% rule
- 4.78% ✓
- Cap rate
- 23.05%
- Cash-on-cash
- 59.85%
- DSCR
- 3.66
- GRM
- 1.7
CMA / ARV
- ARV (on-the-fly)
- $278,478
- Comps found
- 12
Show comp detail 12 sales within ~0.75 mi
| Address | Dist | Beds/Ba | Sqft | Sold | Price | $/sf | Match |
|---|---|---|---|---|---|---|---|
| 16 Danzar | 0.31mi | 2/2.0 | 1,439 (-1%) | 4mo | $165,000 | $115 | 80 |
| 18 Montoya | 0.44mi | 2/2.0 | 1,446 (-1%) | 5mo | $289,000 | $200 | 74 |
| 21 Lavilla Way | 0.43mi | 2/2.0 | 1,446 (-1%) | 7mo | $269,000 | $186 | 73 |
| 2385 6th Ave SW | 0.45mi | 3/2.0 (+1) | 1,440 (-1%) | 4mo | $286,000 | $199 | 69 |
| 11 Villa Blanca | 0.31mi | 1/1.5 (-1) | 1,305 (-10%) | 8mo | $249,000 | $191 | 55 |
| 604 24th St SW | 0.46mi | 3/2.0 (+1) | 1,570 (+8%) | 9mo | $404,000 | $257 | 54 |
| 11 Villa Del Norte | 0.37mi | 1/1.5 (-1) | 1,305 (-10%) | 7mo | $249,000 | $191 | 52 |
| 6505 Citrus Park Blvd | 0.56mi | 3/2.0 (+1) | 1,548 (+6%) | 9mo | $345,000 | $223 | 51 |
| 3 Quito | 0.63mi | 1/1.5 (-1) | 1,305 (-10%) | 2mo | $249,000 | $191 | 44 |
| 2445 8th Ave SW | 0.63mi | 3/2.0 (+1) | 1,313 (-10%) | 6mo | $165,000 | $126 | 44 |
| 751 Highland Dr SW | 0.67mi | 3/2.0 (+1) | 1,278 (-12%) | 1mo | $222,000 | $174 | 42 |
| 5 Villa Maria | 0.75mi | 1/1.5 (-1) | 1,305 (-10%) | 8mo | $249,000 | $191 | 34 |
Match score weights: distance 35% · size 25% · config 20% · recency 20%. Top-matched comps best support the ARV.
Projected returns pro-forma
-3.0% appreciation · 3.0% rent growth · sell at horizon
- IRR
- 59.0%
- Equity multiple
- 3.64×
- Total profit
- $36,854
- Equity at exit
- $7,440
- IRR
- 63.9%
- Equity multiple
- 7.55×
- Total profit
- $91,499
- Equity at exit
- $4,314
Cash invested: $13,972 (down + closing). Projections, not guarantees.
Landlord ↔ Tenant lean methodology
- Overall (STATE)
- 87 Strongly Landlord-Friendly
- State Florida
- 87 Strongly Landlord-Friendly · R+3
- County
- — inherits STATE
- City
- — inherits STATE
ZIP-level market 34951
- Home prices YoY
- -23.6%
- Active inventory
- 292
- Price-to-rent
- 1.7×
Monthly cashflow live
- Estimated rent
- $2,387 high interval (Pro) →
- Mortgage (P&I)
- −$262
- Tax est. 1.5%
- −$62 /mo · $748/yr
- Insurance
- −$21
- HOA
- −$844
- Vacancy / Maint / Mgmt
- −$501
- Net cashflow
- $697
Break-even live
UW: 25.0% down · 7.5% · 30yr · 1.5% tax · 5.0% vac · 8.0% maint · 8.0% mgmt
Financing live
Cash to close
- Down payment
- $12,475
- Closing costs
- $1,497
- Reserves months
- —
- Total cash needed
- —
Loan-product check · same deal, 3 products live
Conventional
25% down · 7.5% · 30yr
- Down + closing
- —
- Monthly P&I
- —
- Monthly cashflow
- —
- DSCR
- —
- Eligible?
- —
Personal DTI + credit; lowest rate.
DSCR
20% down · 8.5% · 30yr
- Down + closing
- —
- Monthly P&I
- —
- Monthly cashflow
- —
- DSCR
- —
- Eligible?
- —
No personal income docs; deal must DSCR.
Hard money
10% down · 12.0% · 12mo
- Down + closing
- —
- Monthly P&I
- —
- Monthly cashflow
- —
- DSCR
- —
- Eligible?
- —
Short-term bridge; refi at stabilization.
Rent comps 13 comps
| Address | Beds | Baths | Sqft | Rent | $/sqft | DOM | Units | Dist |
|---|---|---|---|---|---|---|---|---|
| 2450 8th Ave SW Vero Beach, FL | 3.0 | 2.0 | 1388 | $2,100 | $1.51 | 21d | 1 | 0.62mi |
| 2320 Water Oaks Ln Unit 111 Vero Beach, FL | 3.0 | 2.0 | 1811 | $3,500 | $1.93 | 21d | 1 | 0.64mi |
| 5642 Sunberry Cir Fort Pierce, FL | 3.0 | 2.0 | 1377 | $1,950 | $1.42 | 23d | 1 | 0.82mi |
| 985 23rd Pl SW Vero Beach, FL | 3.0 | 2.0 | 1176 | $2,200 | $1.87 | 21d | 1 | 0.88mi |
| 6906 Ocala Ave Fort Pierce, FL | 3.0 | 2.0 | 1175 | $1,955 | $1.66 | 14d | 1 | 0.97mi |
| 3766 Harborside Ave Fort Pierce, FL | 2.0 | 2.0 | 1308 | $2,160 | $1.65 | 14d | 1 | 1.12mi |
| 7503 Paso Robles Blvd Fort Pierce, FL | 3.0 | 2.0 | 1260 | $2,000 | $1.59 | 23d | 1 | 1.13mi |
| 7500 Pensacola Rd Fort Pierce, FL | 3.0 | 2.0 | 1125 | $2,150 | $1.91 | 14d | 1 | 1.15mi |
| 254 Hawthorne Ln Vero Beach, FL | 3.0 | 2.0 | 1703 | $2,900 | $1.70 | 21d | 1 | 1.27mi |
| 335 Hawthorne Ln Vero Beach, FL | 2.0 | 2.0 | 1587 | $1,800 | $1.13 | 21d | 1 | 1.29mi |
| 7403 Winter Garden Pkwy Fort Pierce, FL | 3.0 | 2.0 | 1372 | $2,200 | $1.60 | 21d | 1 | 1.32mi |
| 2066 5th Ct SE Vero Beach, FL | 2.0 | 2.0 | 1415 | $3,850 | $2.72 | 21d | 1 | 1.35mi |
| 5510 Shannon Dr Fort Pierce, FL | 3.0 | 2.0 | 1594 | $2,350 | $1.47 | 14d | 1 | 1.39mi |
HOA detail
- Monthly dues
- $844 · $10,128/yr
- Likely covers
- water
Listing history 19 events
-
2026-06-18remarks 679-char remark
-
2026-06-18price $49,900 Active 20 DOM
-
2026-06-18days on market $52,500 Active 20 DOM
-
2026-06-17days on market $52,500 Active 19 DOM
-
2026-06-16days on market $52,500 Active 18 DOM
-
2026-06-15days on market $52,500 Active 17 DOM
-
2026-06-14days on market $52,500 Active 15 DOM
-
2026-06-13days on market $52,500 Active 14 DOM
-
2026-06-10days on market $52,500 Active 12 DOM
-
2026-06-09days on market $52,500 Active 11 DOM
-
2026-06-08days on market $52,500 Active 10 DOM
-
2026-06-07days on market $52,500 Active 9 DOM
-
2026-06-05days on market $52,500 Active 6 DOM
-
2026-06-03days on market $52,500 Active 5 DOM
-
2026-06-02days on market $52,500 Active 4 DOM
-
2026-06-01days on market $52,500 Active 3 DOM
-
2026-05-31days on market $52,500 Active 2 DOM
-
2026-05-30remarks 664-char remark
-
2026-05-30$52,500 Active 1 DOM
ⓘ Source: listings_history table (triggers on properties + properties_extension) + one-shot
backfill from property_details.listing_events for pre-trigger history.
Climate risk First Street
- Flood 3/10 Moderate FEMA zone X (unshaded) · 20% chance over 30 yrs
- Wildfire 4/10 Moderate
- Heat 10/10 Extreme 7 d/yr ≥107°F today · 25 d/yr by 30 yrs out
- Wind 10/10 Extreme 99% chance of damaging wind over 30 yrs
- Air quality 1/10 Low 0 unhealthy d/yr today · 0 by 30 yrs out
Nearby sold comps map
Loading sold comps map…
Walkable amenities ~0.75 mi
Loading nearby amenities…
Taxation est. · year 1
- Rental income
- $28,644
- − Mortgage interest
- −$2,795
- − Property taxes
- −$748
- − Insurance
- −$250
- − Repairs & maintenance
- −$2,292
- − Management
- −$2,292
- − HOA
- −$10,128
- − Depreciation
- −$1,452
- Taxable income
- $8,688
- Est. tax owed @ 24.0%
- −$2,085
- After-tax cash flow
- $6,278/yr
For passive investors: Depreciation is non-cash, so a rental often shows a tax loss while cash-flowing — sheltering income. Rental losses are passive: they offset passive income freely, and up to $25,000/yr can offset ordinary (W-2) income if you actively participate and your MAGI is under $100k (phasing out to $0 by $150k); unused losses carry forward. On sale, claimed depreciation is recaptured at up to 25%, and gains may owe capital-gains tax (a 1031 exchange can defer both). Figures are a year-1 estimate at your 24.0% rate — not tax advice; consult a CPA.
Condition & rehab AI · 12 photos
This home is in good condition with recent updates, including a new roof, kitchen appliances, and bathrooms. It is move-in ready with a good curb appeal and is located in a quiet neighborhood with community amenities.
Value-add opportunities
- Both Painting — Enhances curb appeal and interior aesthetics.
- Both Window cleaning — Improves natural light and overall appearance.
- Both Landscaping — Enhances curb appeal and adds value to the property.
Renovation cost estimate screening
Value-add ROI direction
- Both Painting — Enhances curb appeal and interior aesthetics. ↑
- Both Window cleaning — Improves natural light and overall appearance. ↑
- Both Landscaping — Enhances curb appeal and adds value to the property. ↑
ⓘ Cost ranges are severity-bucket heuristics (US national rule-of-thumb). Get contractor quotes + a written scope before underwriting a rehab budget.
Schools (NCES district)
- District
- St. Lucie
- NCES district ID
- 1201770
- Math proficiency
- 40% ▼ -11.00%
- Reading proficiency
- 48% ▼ -4.00%
- Median HH income
- $44,737
- Composite
- 37.28/100
- National rank
- #4449
- State rank
- #51 of 73 in FL
Livability — Lakewood Park
- Score
- 63/100
- State rank
- #719
- US rank
- #15407
Category grades
Schools grade is shown separately in the Schools card above.
Census & demographics
- Census place
- Lakewood Park, FL
- County
- Saint Lucie County · 337,150 people
- Metro
- Port St. Lucie, FL
- Population (ZIP)
- 17,148
- Household income
- $63,122
- Rent vs Own
- Severe rent burden
- 140.0
Population outlook (St. Lucie County) Hauer SSP2
- Today (2025)
- 338,016 people
- By 2030
- 355,687 · +5.2%
- By 2040
- 385,521 · +14.1%
- By 2050
- 406,106 · +20.1%
- By 2075
- 441,054 · +30.5%
- By 2100
- 436,885 · +29.2%
Race, ethnicity, and origin ACS 2023
- Neighborhood character
- Predominantly White (74%)
- Race & ethnicity
- White 74% Black 13% Hispanic / Latino 8% Two or more races 7% Asian 2%
- Hispanic origin (detail)
- Mexican 2% Puerto Rican 2% Cuban 2%
- Common ancestry
- Romanian 3% Italian 2% Lithuanian 2%
- Foreign-born
- 10% · Canada, Jamaica, Vietnam
- Languages at home
- 88% English-only · Spanish 7% French/Haitian/Cajun 3% Vietnamese 1%
Political lean MEDSL · St. Lucie
- 2024 margin
- Lean R (+9.1) · D 45.1% · R 54.2%
- 2008→2024 swing
- -21.2pp toward R · 2008: 12.1pp · 2024: -9.1pp
- All cycles
- 2024: R+9.1 2020: R+1.6 2016: R+2.5 2012: D+7.9 2008: D+12.1
Not yet ingested
- Civics
- —
Market trends
- HPI YoY
- ▼ -106.06%
- Current HPI
- 343.1376
- Rent YoY
- —
- Metro
- Port St. Lucie, FL
- State GDP YoY
- ▲ 3.28%
- F500 in state
- 36
Industry mix (Fortune 500 HQ in FL)
| Industry | F500 HQs | Revenue |
|---|---|---|
| Industrial Technology | 2 | $29B |
|
||
| Insurance | 2 | $17B |
|
||
| Retail | 1 | $60B |
|
||
| Technology Distribution | 1 | $58B |
|
||
| Homebuilding | 1 | $35B |
|
||
| Technology Manufacturing | 1 | $35B |
|
||
Price history
+78.6% since first listed10 events — show timeline
- 2026-05-29 Listed $52,500 Beaches MLS
- 2026-02-09 Price Changed $54,900 Beaches MLS
- 2026-01-16 Relisted — Beaches MLS
- 2026-01-14 Pending — Beaches MLS
- 2026-01-14 Listing Removed — Beaches MLS
- 2025-11-12 Listed $59,900 Beaches MLS
- 2025-10-01 Listing Removed — Beaches MLS
- 2025-06-16 Price Changed $69,990 Beaches MLS
- 2025-04-01 Listed $74,900 Beaches MLS
- 2014-03-14 Listed $29,400 RAIRCMLS
Cash-flow waterfall
monthlySold comps — $/sqft
last 12 mo · ≤1 miLoading sold comps…