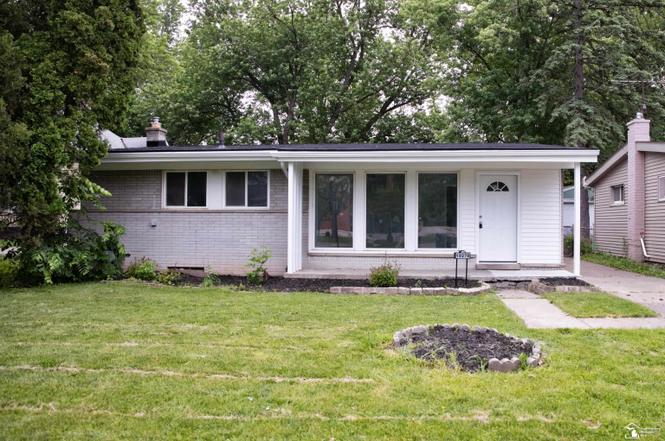
19278 Berg Rd · Detroit, MI
Flood risk 1/10 · Minimal
- FEMA flood zone
- X (unshaded)
- Chance of flooding over 30 yrs
- 0.0%
- Est. flood insurance / yr
- $473 – $860
Fire risk 1/10 · Minimal
- Est. fire insurance / yr
- $784 – $1,456
Heat risk 3/10 · Minor
- Hot days now (above 98°F)
- 7 days/yr
- Hot days in 30 yrs
- 15 days/yr
Wind risk 2/10 · Minimal
- Chance of severe wind over 30 yrs
- —
Air-quality risk 3/10 · Minor
- Unhealthy air days now
- 2 days/yr
- Unhealthy air days in 30 yrs
- 3 days/yr
Risk factors via First Street. Map © Google.
Why this score? — see what drove the D- grade
The composite is a weighted blend of 9 inputs, each scored 0–100. Each bar is that input's sub-score; the figure is the points it added to the 100-point composite (weight × sub-score).
- Cash flow +14.6/30.0
- DSCR +4.5/10.0
- Rent growth +4.5/5.0
- 1% rule +4.4/10.0
- Livability +3.7/5.0
- Condition / age +2.5/5.0
- Schools +1.3/10.0
- ARV discount +0.0/15.0
- Appreciation +0.0/10.0
$139,900
🖨 Deal sheet (PDF) 📄 Offer letter ✓ Due diligence
Listing remarks MLS
Move in ready! This 3 bedroom 2 bath home is fresh & clean. Remodeled with new roof updated kitchen and baths, new flooring throughout and fresh paint. Immediate occupancy. Solid brick ranch in desirable Detroit subdivision. Large fenced yard with covered patio and fire pit. Two car detached garage. Spacious basement features second bath and clean slate to use as you desire. Don't delay, schedule your showing today!
Key facts
- Large fenced yard
- Covered patio
- Fire pit
Tags
Property features AI
Finance
- Other: Subdivision: Cambridge Heights 2; Cross street: 7 Mile & Berg
- Financial info: No additional financial details provided
- HOA & community: Homeowners association present
Exterior
- Parking: Detached 2-car garage
- Security: No security features listed
- Utilities: Public water; Public sewer
- Home design: Single family residence; One level
- Construction: Brick construction; Above-grade finished area present; Below-grade finished area present
- Exterior features: Patio; Porch; Fenced yard; Public maintained road
Interior
- Kitchen: No kitchen appliance list beyond gas water heater provided
- Bedrooms: 7 total rooms (includes bedrooms and living spaces)
- Flooring: No flooring details provided
- Bathrooms: 1 full bathroom; 1 half bathroom
- Heating & cooling: Forced air heating; Natural gas heating; No cooling system
- Interior features: Gas water heater; Concrete basement; Basement present
- Laundry & utility: No specific laundry appliances listed
Neighborhood map
What this means for you Summary
Snapshot
- This is a 3-bed/1.0-bath single-family listed at $140k.
Deal economics
- At list price, monthly cash flow is $34 ($407/yr) — positive.
- The deal already cash-flows at list — no discount required.
- To meet the 1% rule (rent ≥ 1% of price), the offer needs to be $132k (5.7% below list).
- Recommended offer: $132k (5.7% below list) — sets the bar for 1% rule.
- Cap rate 6.6% vs local median 10.0% in Detroit — below-typical yield; the buyer is paying a premium for something (appreciation thesis, condition, location) that the cap rate doesn't capture.
Location & tenants
- Location reads 73/100 on livability (#218 in MI) — a middle-class / working-renter tenant base. Strengths: amenities A+, commute A+, cost of living A+; Watch: crime F, employment F.
- Detroit Public Schools Community District (urban): math 10% / reading 24% proficiency, ranked #499 of 540 in MI (top 92%) — low school quality limits family demand, transient renter base, plan for 1-2y turnover; 90% free/reduced lunch — lower-income household profile, screen leases tightly.
- Zoned schools: Emerson Elementarymiddle School (519 students, 90% FRL); Henry Ford High School (math 24% / reading 24%, grade F, #481 of 713 statewide, top 81%, 712 students, 86% FRL) — zoned schools at 88% FRL track the district average.
- Market conditions: Rents rising fast (+8.0%/yr); 309 active listings in the ZIP; 40 comparable units currently listed for rent nearby; rentals at typical pace (median 26d on market — plan ~3-4 weeks tenant-placement turnaround); 45% of comp listings sitting > 30 days — soft ceiling on asking rent; lower-income renter base — watch delinquency; 2,639 units permitted in Wayne County in 2024 (1,216 in 5+ unit buildings).
- This rent runs 36% of the median local income ($44k/yr) — at the standard rent-burdened threshold; future hikes will face affordability resistance.
Forward outlook
- Local home prices are declining (-3.0%/yr); year-one equity from $967 of loan paydown is wiped out by about $4k of value loss. Plan a longer hold.
- Wayne County population projected at -17% by 2050 — secular population decline; favor cash flow + early exit over multi-decade hold.
Negotiation context
- Only 4 days on market — expect competitive offers; lowballing is unlikely to land.
- 7 sale attempts since 22y ago with the ask held roughly flat each time — persistent listings suggest the price (not the market) is what's stuck; bring a comps-based counter.
Risks & watch-outs
- Watch-outs: built in 1956 — expect roof / HVAC / electrical / plumbing capex.
Questions for the listing agent
- Built in 1956 — when were the roof, HVAC, electrical panel, plumbing, and water heater last replaced?
- Is there a deadline driving the sale (1031 exchange, divorce, estate, relocation)? That informs how much negotiation room exists.
- Schools are F-rated, which usually means shorter tenancies and higher turnover. Who's the typical renter profile here, and what's been the actual vacancy rate?
- Crime grade is F in this area — have there been break-ins, vandalism, or insurance claims at this property in the last 3 years? What carrier currently insures it and at what premium?
- The area grade is low — what's the realistic commute time and amenity access for the typical tenant pool here? Any planned neighborhood developments (good or bad) we should know about?
- What's the average days-on-market for RENTAL listings here right now (not sales)? A rising rental-DOM trend means longer vacancies and softer asking-rent achievability than the comps imply.
- What's the recent tenant-quality profile in this submarket — average credit score on applications, eviction rate, late-payment / NSF rate, and stable-employment percentage? A property-management company in the area should have these aggregated.
- How much new for-sale + rental construction is in the pipeline within 1–3 miles? Heavy new supply typically softens prices + rents 12–24 months out; constrained supply supports both.
Investment metrics
- 1% rule
- 0.94% ✗
- Cap rate
- 6.58%
- Cash-on-cash
- 1.04%
- DSCR
- 1.05
- GRM
- 8.8
CMA / ARV
- ARV (on-the-fly)
- $119,770
- Comps found
- 12
Show comp detail 12 sales within ~0.75 mi
| Address | Dist | Beds/Ba | Sqft | Sold | Price | $/sf | Match |
|---|---|---|---|---|---|---|---|
| 19212 Northrop St | 0.31mi | 3/1.0 | 981 (-3%) | 2mo | $65,000 | $66 | 78 |
| 19711 Chapel St | 0.68mi | 3/1.0 | 1,014 (-0%) | 1mo | $120,000 | $118 | 67 |
| 23450 Margareta St | 0.46mi | 3/1.0 | 957 (-6%) | 4mo | $45,000 | $47 | 66 |
| 20224 Redfern St | 0.58mi | 3/1.5 | 1,020 (+0%) | 5mo | $140,000 | $137 | 66 |
| 19411 Chapel St | 0.65mi | 3/1.0 | 1,014 (-0%) | 5mo | $65,000 | $64 | 66 |
| 19344 Cooley St | 0.42mi | 3/1.0 | 1,092 (+8%) | 7mo | $62,000 | $57 | 62 |
| 18293 Codding St | 0.61mi | 3/1.0 | 962 (-5%) | 1mo | $30,000 | $31 | 62 |
| 18660 Codding St | 0.44mi | 3/1.0 | 1,100 (+8%) | 9mo | $135,000 | $123 | 58 |
| 21700 Pembroke Ave | 0.61mi | 3/1.0 | 1,089 (+7%) | 3mo | $155,000 | $142 | 57 |
| 19266 Cooley St | 0.42mi | 3/1.5 | 1,126 (+11%) | 6mo | $134,000 | $119 | 55 |
| 19309 Lenore | 0.71mi | 3/1.0 | 920 (-9%) | 2mo | $86,900 | $94 | 49 |
| 20348 Berg Rd | 0.68mi | 3/1.5 | 1,136 (+12%) | 7mo | $135,000 | $119 | 41 |
Match score weights: distance 35% · size 25% · config 20% · recency 20%. Top-matched comps best support the ARV.
Projected returns pro-forma
-3.0% appreciation · 8.0% rent growth · sell at horizon
- IRR
- -8.9%
- Equity multiple
- 0.66×
- Total profit
- $-13,494
- Equity at exit
- $20,860
- IRR
- 6.4%
- Equity multiple
- 1.59×
- Total profit
- $22,941
- Equity at exit
- $12,096
Cash invested: $39,172 (down + closing). Projections, not guarantees.
Landlord ↔ Tenant lean methodology
- Overall (STATE)
- 62 Landlord-Friendly
- State Michigan
- 62 Landlord-Friendly · EVEN
- County
- — inherits STATE
- City
- — inherits STATE
ZIP-level market 48219
- Home prices YoY
- -10.3%
- Rents YoY
- 8.0%
- Active inventory
- 309
- Price-to-rent
- 8.8×
Monthly cashflow live
- Estimated rent
- $1,319 high interval (Pro) →
- Mortgage (P&I)
- −$734
- Tax from tax record
- −$216 /mo · $2,594/yr
- Insurance
- −$58
- HOA
- −$0
- Vacancy / Maint / Mgmt
- −$277
- Net cashflow
- $34
Break-even live
Sensitivity live
| Price | -10% $113 | -5% $74 | +0% $34 | +5% $-6 | +10% $-45 |
|---|---|---|---|---|---|
| Rent | -10% $-70 | -5% $-18 | +0% $34 | +5% $86 | +10% $138 |
| Rate | -1.0pp $104 | -0.5pp $69 | base $34 | +0.5pp $-2 | +1.0pp $-39 |
UW: 25.0% down · 7.5% · 30yr · 1.5% tax · 5.0% vac · 8.0% maint · 8.0% mgmt
Financing live
Cash to close
- Down payment
- $34,975
- Closing costs
- $4,197
- Reserves months
- —
- Total cash needed
- —
Loan-product check · same deal, 3 products live
Conventional
25% down · 7.5% · 30yr
- Down + closing
- —
- Monthly P&I
- —
- Monthly cashflow
- —
- DSCR
- —
- Eligible?
- —
Personal DTI + credit; lowest rate.
DSCR
20% down · 8.5% · 30yr
- Down + closing
- —
- Monthly P&I
- —
- Monthly cashflow
- —
- DSCR
- —
- Eligible?
- —
No personal income docs; deal must DSCR.
Hard money
10% down · 12.0% · 12mo
- Down + closing
- —
- Monthly P&I
- —
- Monthly cashflow
- —
- DSCR
- —
- Eligible?
- —
Short-term bridge; refi at stabilization.
Rent comps 40 comps
| Address | Beds | Baths | Sqft | Rent | $/sqft | DOM | Units | Dist |
|---|---|---|---|---|---|---|---|---|
| 22649 Frisbee St Detroit, MI | 3.0 | 1.0 | 1100 | $1,495 | $1.36 | 45d | 1 | 0.22mi |
| 22570 Seven Mile W Detroit, MI | 2.0 | 1.0 | 890 | $875 | $0.98 | 45d | 1 | 0.22mi |
| 19800 Berg Rd Detroit, MI | 3.0 | 1.0 | 1000 | $1,550 | $1.55 | 18d | 1 | 0.24mi |
| 19301 Shiawassee Dr Detroit, MI | 1.0–2.0 | 1.0 | 740 | $1,150 | $1.55 | 45d | 2 | 0.27mi |
| 22238 Pembroke Ave Detroit, MI | 3.0 | 1.5 | 1100 | $1,500 | $1.36 | 45d | 1 | 0.44mi |
| 19248 Telegraph Rd Unit P7 Detroit, MI | 2.0 | 1.0 | 820 | $975 | $1.19 | 26d | 1 | 0.47mi |
| 19250 Telegraph Rd Unit O7 Detroit, MI | 2.0 | 1.0 | 820 | $975 | $1.19 | 26d | 1 | 0.47mi |
| 19276 Telegraph Rd Detroit, MI | 2.0 | 1.0 | 820 | $975 | $1.19 | 45d | 1 | 0.47mi |
| 19264 Telegraph Rd Unit G7 Detroit, MI | 2.0 | 1.0 | 820 | $975 | $1.19 | 45d | 1 | 0.47mi |
| 19800 Telegraph Rd Detroit, MI | 2.0 | 1.0 | 855 | $1,020 | $1.19 | 45d | 1 | 0.49mi |
| 19928 Houghton St Detroit, MI | 3.0 | 1.0 | 880 | $1,495 | $1.70 | 12d | 1 | 0.51mi |
| 23411 W Eight Mile Rd Detroit, MI | 1.0–2.0 | 1.0 | 742 | $1,000 | $1.35 | 45d | 1 | 0.76mi |
| 21422 Pembroke Ave Detroit, MI | 3.0 | 1.5 | 1000 | $1,695 | $1.70 | 18d | 1 | 0.77mi |
| 20555 Lahser Rd Detroit, MI | 1.0–2.0 | 1.0 | 737 | $975 | $1.32 | 45d | 2 | 0.81mi |
| 18302 Wormer St Detroit, MI | 3.0 | 1.0 | 1046 | $1,475 | $1.41 | 45d | 1 | 0.85mi |
| 21455 Pickford St Detroit, MI | 2.0 | 1.0 | 1000 | $1,275 | $1.27 | 45d | 1 | 0.89mi |
| 19810 Blackstone St Detroit, MI | 3.0 | 1.0 | 1216 | $1,395 | $1.15 | 45d | 1 | 0.92mi |
| 21434 Karl St Detroit, MI | 2.0 | 1.0 | 1000 | $1,350 | $1.35 | 45d | 1 | 0.92mi |
| 18732 Salem Unit 2 Detroit, MI | 2.0 | 1.0 | 925 | $1,050 | $1.14 | 14d | 1 | 0.96mi |
| 17355 McIntyre St Detroit, MI | 3.0 | 1.0 | 1500 | $1,250 | $0.83 | 45d | 1 | 1.00mi |
| 21451 Glenco St Detroit, MI | 3.0 | 1.0 | 1026 | $1,400 | $1.36 | 18d | 1 | 1.02mi |
| 17328 McIntyre St Unit 2 Detroit, MI | 3.0 | 1.0 | 1200 | $1,250 | $1.04 | 45d | 1 | 1.03mi |
| 18437 Trinity St Detroit, MI | 3.0 | 1.0 | 875 | $1,364 | $1.56 | 16d | 1 | 1.06mi |
| 18025 Bentler St Detroit, MI | 3.0 | 1.0 | 728 | $1,250 | $1.72 | 26d | 1 | 1.06mi |
| 47129 Wedgewood Southfield, MI | 1.0–2.0 | 1.0–2.0 | 1000 | $1,275 | $1.27 | 45d | 1 | 1.07mi |
| 20083 Salem St Detroit, MI | 3.0 | 1.0 | 969 | $1,050 | $1.08 | 6d | 1 | 1.07mi |
| 20083 Salem St Detroit, MI | 3.0 | 1.0 | 969 | $1,050 | $1.08 | 12d | 1 | 1.07mi |
| 17721 Westbrook St Detroit, MI | 4.0 | 1.0 | 1040 | $1,125 | $1.08 | 26d | 1 | 1.09mi |
| 21440 Bennett St Detroit, MI | 3.0 | 1.0 | 1037 | $1,394 | $1.34 | 18d | 1 | 1.10mi |
| 20410 Five Points St Redford, MI | 3.0 | 1.0 | 950 | $1,600 | $1.68 | 6d | 1 | 1.13mi |
| 19781 Fielding St Detroit, MI | 3.0 | 1.0 | 1000 | $1,294 | $1.29 | 6d | 1 | 1.22mi |
| 20079 Patton St Detroit, MI | 3.0 | 1.0 | 1150 | $1,550 | $1.35 | 6d | 1 | 1.26mi |
| 17274 Bentler St #46 Detroit, MI | 2.0 | 1.0 | 700 | $850 | $1.21 | 18d | 1 | 1.28mi |
| 17274 Bentler St Detroit, MI | 2.0 | 1.0 | 700 | $838 | $1.20 | 26d | 2 | 1.30mi |
| 17274 Bentler St Detroit, MI | 2.0 | 1.0 | 700 | $850 | $1.21 | 45d | 2 | 1.30mi |
| 17255 Westbrook St Detroit, MI | 3.0 | 2.0 | 1500 | $1,450 | $0.97 | 13d | 1 | 1.34mi |
| 17324 Salem St Detroit, MI | 2.0 | 1.0 | 989 | $1,200 | $1.21 | 26d | 1 | 1.35mi |
| 18274 Fielding St Detroit, MI | 2.0 | 1.0 | 700 | $1,200 | $1.71 | 18d | 1 | 1.36mi |
| 18556 Kentfield St Detroit, MI | 3.0 | 1.0 | 952 | $1,250 | $1.31 | 4d | 1 | 1.41mi |
| 17624 Patton St Detroit, MI | 3.0 | 1.0 | 1260 | $1,695 | $1.35 | 45d | 1 | 1.41mi |
Listing history 3 events
-
2026-06-21days on market $139,900 Active 4 DOM
-
2026-06-18remarks 421-char remark
-
2026-06-18$139,900 Active 1 DOM
ⓘ Source: listings_history table (triggers on properties + properties_extension) + one-shot
backfill from property_details.listing_events for pre-trigger history.
Tax reassessment forecast MI · Partial reset (capped growth)
- Current annual tax
- $2,594 · $216/mo
- Projected year-2 tax
- $2,594 · $216/mo
- Expected delta
- $0/yr ($0/mo · 0.0%)
ⓘ Screening estimate from a state-policy table — verify with the county assessor before closing.
Climate risk First Street
- Flood 1/10 Low FEMA zone X (unshaded) · 0% chance over 30 yrs
- Wildfire 1/10 Low
- Heat 3/10 Moderate 7 d/yr ≥98°F today · 15 d/yr by 30 yrs out
- Wind 2/10 Low
- Air quality 3/10 Moderate 2 unhealthy d/yr today · 3 by 30 yrs out
Nearby sold comps map
Loading sold comps map…
Walkable amenities ~0.75 mi
Loading nearby amenities…
Taxation est. · year 1
- Rental income
- $15,828
- − Mortgage interest
- −$7,837
- − Property taxes
- −$2,594
- − Insurance
- −$700
- − Repairs & maintenance
- −$1,266
- − Management
- −$1,266
- − Depreciation
- −$4,070
- Taxable loss
- −$1,904
- Est. tax savings @ 24.0%
- +$457
- After-tax cash flow
- $864/yr
For passive investors: Depreciation is non-cash, so a rental often shows a tax loss while cash-flowing — sheltering income. Rental losses are passive: they offset passive income freely, and up to $25,000/yr can offset ordinary (W-2) income if you actively participate and your MAGI is under $100k (phasing out to $0 by $150k); unused losses carry forward. On sale, claimed depreciation is recaptured at up to 25%, and gains may owe capital-gains tax (a 1031 exchange can defer both). Figures are a year-1 estimate at your 24.0% rate — not tax advice; consult a CPA.
Schools (NCES district)
- District
- Detroit Public Schools Community District
- NCES district ID
- 2601103
- Math proficiency
- 10% ▼ -2.00%
- Reading proficiency
- 24% ▲ 6.00%
- Median HH income
- $25,815
- Composite
- 13.06/100
- National rank
- #9564
- State rank
- #499 of 540 in MI
Livability — Detroit
- Score
- 73/100
- State rank
- #218
- US rank
- #5427
Category grades
Schools grade is shown separately in the Schools card above.
Census & demographics
- Census place
- Detroit, MI
- County
- Wayne County · 1,562,939 people
- City population
- 572,865
- Metro
- Detroit-Warren-Dearborn, MI
- Population (ZIP)
- 47,208
- Household income
- $43,655
- Rent vs Own
- Severe rent burden
- 3584.0
Population outlook (Wayne County) Hauer SSP2
- Today (2025)
- 1,675,273 people
- By 2030
- 1,620,300 · -3.3%
- By 2040
- 1,502,341 · -10.3%
- By 2050
- 1,384,039 · -17.4%
- By 2075
- 1,124,592 · -32.9%
- By 2100
- 881,193 · -47.4%
Race, ethnicity, and origin ACS 2023
- Neighborhood character
- Predominantly Black (88%)
- Race & ethnicity
- Black 88% White 5% Two or more races 4% Hispanic / Latino 1%
- Common ancestry
- Romanian 1% Lithuanian 1%
- Foreign-born
- 2% · Canada
- Languages at home
- 96% English-only · Spanish 1% French/Haitian/Cajun 1%
Political lean MEDSL · Wayne
- 2024 margin
- Strong D (+29.0) · D 62.7% · R 33.7% · Other 3.6%
- 2008→2024 swing
- -20.5pp toward R · 2008: 49.5pp · 2024: 29.0pp
- All cycles
- 2024: D+29.0 2020: D+38.1 2016: D+37.3 2012: D+46.9 2008: D+49.5
Not yet ingested
- Civics
- —
Market trends
- HPI YoY
- ▼ -65.06%
- Current HPI
- 563.3263
- Rent YoY
- ▲ 8.04%
- Metro
- Detroit-Warren-Dearborn, MI
- State GDP YoY
- ▲ 1.37%
- F500 in state
- 28
Industry mix (Fortune 500 HQ in MI)
| Industry | F500 HQs | Revenue |
|---|---|---|
| Automotive Parts | 3 | $48B |
|
||
| Automotive | 2 | $372B |
|
||
| Chemicals | 1 | $45B |
|
||
| Automotive Retail | 1 | $29B |
|
||
| Healthcare / Medical Devices | 1 | $23B |
|
||
| Automotive Technology | 1 | $20B |
|
||
Price history
+7.7% since first listed11 events — show timeline
- 2026-06-17 Listed $139,900 MiRealSource-MiMLS
- 2026-06-17 Listed $139,900 REALCOMP
- 2025-11-14 Listing Removed — MiRealSource-MiMLS
- 2025-08-28 Listed $115,000 REALCOMP
- 2025-08-28 Listed $115,000 MiRealSource-MiMLS
- 2006-02-06 Listing Removed — REALCOMP
- 2006-02-06 Listing Removed — MiRealSource-MiMLS
- 2005-09-14 Listed $115,000 REALCOMP
- 2005-09-14 Listed $115,000 MiRealSource-MiMLS
- 2004-11-01 Listing Removed — REALCOMP
- 2004-07-09 Listed $129,900 REALCOMP
Property tax history
+1.7%/yrLatest (2025): $2,594 · +0.4% YoY. Source: county tax records.
Cash-flow waterfall
monthlySold comps — $/sqft
last 12 mo · ≤1 miLoading sold comps…