 🏗️ New Construction
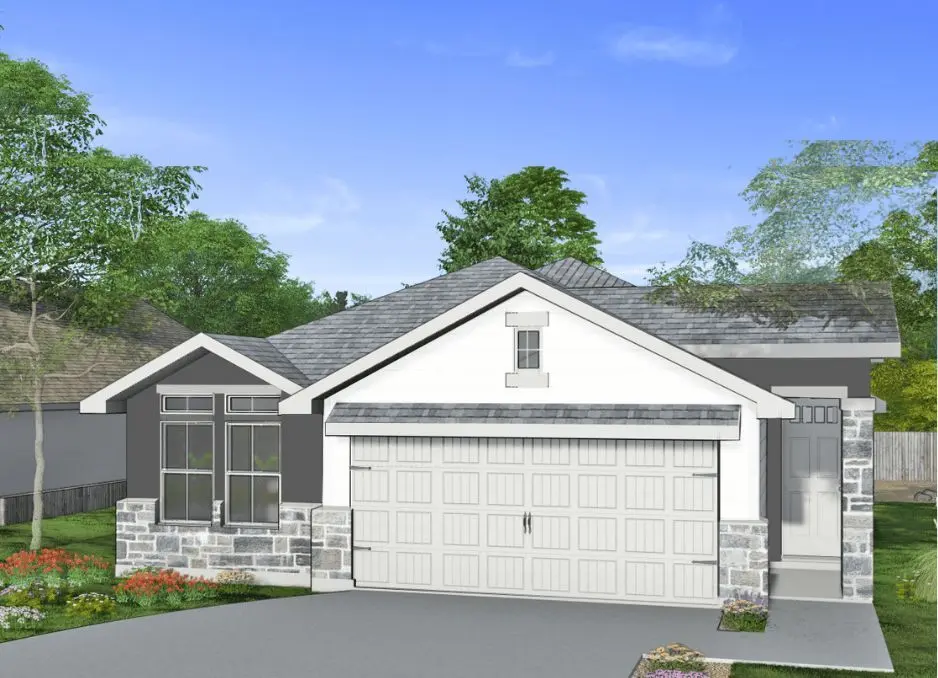
Mia 1717 S Plan · Liberty Hill, TX
Flood risk 1/10 · Minimal
- FEMA flood zone
- X (unshaded)
- Chance of flooding over 30 yrs
- 0.0%
- Est. flood insurance / yr
- $507 – $1,088
Fire risk 5/10 · Moderate
- Est. fire insurance / yr
- $1,222 – $2,270
Heat risk 8/10 · Major
- Hot days now (above 107°F)
- 7 days/yr
- Hot days in 30 yrs
- 24 days/yr
Wind risk 6/10 · Moderate
- Chance of severe wind over 30 yrs
- 70.0%
Air-quality risk 2/10 · Minimal
- Unhealthy air days now
- 1 days/yr
- Unhealthy air days in 30 yrs
- 1 days/yr
Risk factors via First Street. Map © Google.
Why this score? — see what drove the F grade
The composite is a weighted blend of 9 inputs, each scored 0–100. Each bar is that input's sub-score; the figure is the points it added to the 100-point composite (weight × sub-score).
- ARV discount +7.5/15.0
- Cash flow +5.1/30.0
- Schools +4.4/10.0
- Livability +3.4/5.0
- Condition / age +2.5/5.0
- Rent growth +2.2/5.0
- 1% rule +0.8/10.0
- DSCR +0.0/10.0
- Appreciation +0.0/10.0
$300,000
🖨 Deal sheet 📄 Offer letter ✓ Due diligence
Listing remarks MLS
3-5 bedroom homes in MorningStar, Georgetown, TX with resort-style amenities, top-rated schools, and scenic greenbelts. Priced from the mid $300s.
Key facts
- Listed 313 days
Neighborhood map
What this means for you Summary
Snapshot
- This is a 3-bed/3.0-bath single-family listed at $300k.
Deal economics
- At list price, monthly cash flow is $-905 ($-11k/yr) — negative.
- To cash-flow at today's rent, offer at most $258k (13.9% below list).
- To meet the 1% rule (rent ≥ 1% of price), the offer needs to be $226k (24.7% below list).
- Recommended offer: $226k (24.7% below list) — sets the bar for 1% rule.
- Cap rate 3.5% vs local median 2.8% in Liberty Hill — meaningfully above typical; check what's discounted (condition, days-on-market, listing class) to confirm the premium yield is real.
Location & tenants
- Location reads 68/100 on livability (#495 in TX) — a middle-class / working-renter tenant base. Strengths: cost of living A+, housing A+, crime A; Watch: schools C-, employment D+, amenities F.
- Liberty Hill ISD (rural): math 43% / reading 52% proficiency, ranked #160 of 826 in TX (top 19%) — families likely to look elsewhere, expect single-tenant / working-renter base with shorter leases.
- Market conditions: Rents soft (-1.1%/yr); 1578 active listings in the ZIP; 40 comparable units currently listed for rent nearby; rentals at typical pace (median 24d on market — plan ~3-4 weeks tenant-placement turnaround); 48% of comp listings sitting > 30 days — soft ceiling on asking rent; high-income renter base; 7,543 units permitted in Williamson County in 2024 (1,425 in 5+ unit buildings).
Forward outlook
- Local home prices are declining (-3.0%/yr); year-one equity from $3k of loan paydown is wiped out by about $12k of value loss. Plan a longer hold.
- Williamson County population projected at +69% by 2050 — long-run rental-demand tailwind backs the buy-and-hold thesis.
Negotiation context
- It's been on market 313 days — a 12% lower offer ($264k) is reasonable based on typical stale-listing flexibility.
Risks & watch-outs
- Climate carrying-cost: major wind risk, 70% chance of damaging wind over 30y; moderate wildfire risk; extreme-heat days projected 7→24/yr by 2055 (HVAC capex compounding) — expect insurance premiums to compound above CPI over the hold.
Questions for the listing agent
- What do current leases actually rent for vs. the listed asking? Can we see a recent rent roll and the last 12 months of T-12 income?
- It's been on market 313 days. Have you received any prior offers? Is the seller open to a 25% concession, seller financing, or rate buy-down credit?
- Why hasn't it sold? Are there any deal-killer items the seller is aware of (foundation, flood, title, zoning, code violations)?
- Is there a deadline driving the sale (1031 exchange, divorce, estate, relocation)? That informs how much negotiation room exists.
- The area grade is low — what's the realistic commute time and amenity access for the typical tenant pool here? Any planned neighborhood developments (good or bad) we should know about?
- What's the average days-on-market for RENTAL listings here right now (not sales)? A rising rental-DOM trend means longer vacancies and softer asking-rent achievability than the comps imply.
- What's the recent tenant-quality profile in this submarket — average credit score on applications, eviction rate, late-payment / NSF rate, and stable-employment percentage? A property-management company in the area should have these aggregated.
- How much new for-sale + rental construction is in the pipeline within 1–3 miles? Heavy new supply typically softens prices + rents 12–24 months out; constrained supply supports both.
Investment metrics
- 1% rule
- 0.58% ✗
- Cap rate
- 3.50%
- Cash-on-cash
- -9.96%
- DSCR
- 0.56
- GRM
- 14.4
CMA / ARV
- ARV (median comp)
- $389,154
- List price
- $300,000
- Delta
- -22.91%
- Verdict
- UNDERPRICED
- Comps
- 20 within 1.0 mi
Show comp detail 12 sales within ~0.75 mi
| Address | Dist | Beds/Ba | Sqft | Sold | Price | $/sf | Match |
|---|---|---|---|---|---|---|---|
| 136 Vickers St | 0.17mi | 3/2.0 | 1,848 (+8%) | 1mo | $299,000 | $162 | 75 |
| 1036 View Dr | 0.22mi | 4/2.0 (+1) | 1,772 (+3%) | 1mo | $345,000 | $195 | 75 |
| 308 Morning Ridge Ct | 0.21mi | 3/2.0 | 1,601 (-7%) | 0mo | $345,000 | $215 | 74 |
| 113 Landry Cv | 0.03mi | 3/2.0 | 1,498 (-13%) | 6mo | $333,000 | $222 | 68 |
| 100 Vickers St | 0.21mi | 4/3.0 (+1) | 1,881 (+10%) | 2mo | $365,000 | $194 | 68 |
| 152 Mason Hill Ln | 0.46mi | 3/2.5 | 1,872 (+9%) | 1mo | $309,900 | $166 | 61 |
| 324 Mountain Valley St | 0.40mi | 4/2.0 (+1) | 1,599 (-7%) | 6mo | $310,000 | $194 | 56 |
| 301 Banyon Dr | 0.50mi | 4/2.5 (+1) | 1,889 (+10%) | 1mo | $350,000 | $185 | 52 |
| 221 Banyon Dr | 0.50mi | 4/2.5 (+1) | 1,883 (+10%) | 4mo | $350,000 | $186 | 50 |
| 152 Greenway Ln | 0.63mi | 3/2.0 | 1,498 (-13%) | 7mo | $319,000 | $213 | 40 |
| 524 View Dr | 0.67mi | 3/2.0 | 1,509 (-12%) | 6mo | $335,000 | $222 | 39 |
| 341 Gaida Loop | 0.75mi | 3/2.0 | 1,513 (-12%) | 4mo | $329,500 | $218 | 38 |
Match score weights: distance 35% · size 25% · config 20% · recency 20%. Top-matched comps best support the ARV.
Projected returns pro-forma
-3.0% appreciation · 0.0% rent growth · sell at horizon
- IRR
- -37.5%
- Equity multiple
- -0.17×
- Total profit
- $-127,268
- Equity at exit
- $58,024
- IRR
- -77.5%
- Equity multiple
- -0.93×
- Total profit
- $-210,467
- Equity at exit
- $33,647
Cash invested: $108,963 (down + closing). Projections, not guarantees.
Landlord ↔ Tenant lean methodology
- Overall (STATE)
- 87 Strongly Landlord-Friendly
- State Texas
- 87 Strongly Landlord-Friendly · R+5
- County
- — inherits STATE
- City
- — inherits STATE
ZIP-level market 78628
- Rents YoY
- -1.1%
- Active inventory
- 1578
- Price-to-rent
- 11.1×
Monthly cashflow live
- Estimated rent
- $2,259 high interval (Pro) →
- Mortgage (P&I)
- −$2,041
- Tax est. 1.5%
- −$486 /mo · $5,837/yr
- Insurance
- −$162
- HOA
- −$0
- Vacancy / Maint / Mgmt
- −$474
- Net cashflow
- $-905
Break-even live
Sensitivity live
| Price | -10% $-636 | -5% $-770 | +0% $-905 | +5% $-1,039 | +10% $-1,174 |
|---|---|---|---|---|---|
| Rent | -10% $-1,083 | -5% $-994 | +0% $-905 | +5% $-815 | +10% $-726 |
| Rate | -1.0pp $-709 | -0.5pp $-806 | base $-905 | +0.5pp $-1,006 | +1.0pp $-1,108 |
UW: 25.0% down · 7.5% · 30yr · 1.5% tax · 5.0% vac · 8.0% maint · 8.0% mgmt
Financing live
Cash to close
- Down payment
- $97,288
- Closing costs
- $11,675
- Reserves months
- —
- Total cash needed
- —
Loan-product check · same deal, 3 products live
Conventional
25% down · 7.5% · 30yr
- Down + closing
- —
- Monthly P&I
- —
- Monthly cashflow
- —
- DSCR
- —
- Eligible?
- —
Personal DTI + credit; lowest rate.
DSCR
20% down · 8.5% · 30yr
- Down + closing
- —
- Monthly P&I
- —
- Monthly cashflow
- —
- DSCR
- —
- Eligible?
- —
No personal income docs; deal must DSCR.
Hard money
10% down · 12.0% · 12mo
- Down + closing
- —
- Monthly P&I
- —
- Monthly cashflow
- —
- DSCR
- —
- Eligible?
- —
Short-term bridge; refi at stabilization.
Rent comps 40 comps
| Address | Beds | Baths | Sqft | Rent | $/sqft | DOM | Units | Dist |
|---|---|---|---|---|---|---|---|---|
| 124 Stellar Wind Dr Georgetown, TX | 4.0 | 2.0 | 1720 | $2,200 | $1.28 | 18d | 1 | 0.09mi |
| 128 Kavanaugh St Georgetown, TX | 4.0 | 2.0 | 1782 | $2,250 | $1.26 | 44d | 1 | 0.14mi |
| 112 Greenway Dr Andice, TX | 3.0 | 2.0 | 1240 | $1,895 | $1.53 | 44d | 1 | 0.22mi |
| 125 Sun Grove Trl Georgetown, TX | 4.0 | 3.0 | 2043 | $2,150 | $1.05 | 44d | 1 | 0.23mi |
| 201 Morningstar Blvd Georgetown, TX | 1.0–3.0 | 1.0–2.5 | 1209 | $2,899 | $2.40 | 2d | 38 | 0.24mi |
| 213 Ethan Run Georgetown, TX | 4.0 | 3.0 | 2043 | $2,099 | $1.03 | 4d | 1 | 0.30mi |
| 105 Tucana St Georgetown, TX | 4.0 | 2.5 | 2120 | $2,100 | $0.99 | 24d | 1 | 0.31mi |
| 201 McFarland St Georgetown, TX | 3.0 | 2.0 | 1398 | $1,950 | $1.39 | 44d | 1 | 0.37mi |
| 2101 Kauffman Loop Georgetown, TX | 1.0–3.0 | 1.0–2.0 | 1075 | $2,139 | $1.99 | 4d | 55 | 0.37mi |
| 148 Los Olives Ln Liberty Hill, TX | 4.0 | 2.5 | 1873 | $2,499 | $1.33 | 44d | 1 | 0.39mi |
| 135 Mason Hill Ln Georgetown, TX | 4.0 | 2.5 | 2072 | $2,250 | $1.09 | 18d | 1 | 0.41mi |
| 252 Los Olives Ln Liberty Hill, TX | 3.0 | 2.5 | 1621 | $2,399 | $1.48 | 44d | 1 | 0.41mi |
| 300 Bright Star Ln Georgetown, TX | 3.0 | 2.0 | 2028 | $2,199 | $1.08 | 18d | 1 | 0.43mi |
| 421 Mira Mesa Dr Liberty Hill, TX | 3.0 | 2.0 | 1382 | $2,149 | $1.55 | 44d | 1 | 0.46mi |
| 424 Los Olives Ln Liberty Hill, TX | 4.0 | 3.0 | 1752 | $2,585 | $1.48 | 44d | 1 | 0.48mi |
| 408 Los Olives Ln Liberty Hill, TX | 3.0 | 2.5 | 1621 | $2,399 | $1.48 | 18d | 1 | 0.48mi |
| 440 Los Olives Ln Liberty Hill, TX | 4.0 | 2.5 | 1752 | $2,485 | $1.42 | 44d | 1 | 0.50mi |
| 320 Mira Mesa Dr Liberty Hill, TX | 3.0–4.0 | 2.0–2.5 | 1627 | $2,299 | $1.41 | 3d | 19 | 0.51mi |
| 623 Sun Grove Trl Georgetown, TX | 3.0 | 2.0 | 1419 | $1,949 | $1.37 | 44d | 1 | 0.51mi |
| 500 Los Olives Ln Liberty Hill, TX | 3.0 | 2.0 | 1382 | $2,299 | $1.66 | 44d | 1 | 0.53mi |
| 248 Falling Star Ln Georgetown, TX | 3.0 | 2.0 | 2046 | $2,295 | $1.12 | 44d | 1 | 0.59mi |
| 248 Falling Star Ln Georgetown, TX | 3.0 | 2.0 | 2046 | $2,275 | $1.11 | 4d | 1 | 0.59mi |
| 544 View Dr Georgetown, TX | 4.0 | 2.5 | 2053 | $2,250 | $1.10 | 24d | 1 | 0.62mi |
| 544 View Dr Georgetown, TX | 4.0 | 2.5 | 2053 | $2,250 | $1.10 | 44d | 1 | 0.62mi |
| 120 Oakstone Dr Georgetown, TX | 3.0 | 2.0 | 1648 | $2,050 | $1.24 | 18d | 1 | 0.70mi |
| 384 Gaida Loop Georgetown, TX | 3.0 | 2.0 | 1765 | $1,895 | $1.07 | 24d | 1 | 0.77mi |
| 384 Gaida Loop Georgetown, TX | 3.0 | 2.0 | 1765 | $1,845 | $1.05 | 22d | 1 | 0.77mi |
| 236 Oakstone Dr Georgetown, TX | 3.0 | 2.5 | 1977 | $2,100 | $1.06 | 44d | 1 | 0.79mi |
| 393 Gaida Loop Unit NA Georgetown, TX | 3.0 | 2.0 | 1950 | $2,100 | $1.08 | 44d | 1 | 0.80mi |
| 112 Bennington Dr Liberty Hill, TX | 3.0 | 2.0 | 1560 | $2,100 | $1.35 | 44d | 1 | 0.84mi |
| 140 Bennington Dr Andice, TX | 3.0 | 2.0 | 1560 | $2,000 | $1.28 | 16d | 1 | 0.89mi |
| 113 Riverhill Dr Georgetown, TX | 3.0 | 3.0 | 1950 | $2,095 | $1.07 | 44d | 1 | 0.92mi |
| 109 Ventura Dr Liberty Hill, TX | 3.0 | 3.0 | 1819 | $2,350 | $1.29 | 4d | 1 | 0.98mi |
| 121 Bent Creek Ln Georgetown, TX | 3.0 | 2.0 | 1485 | $2,250 | $1.52 | 18d | 1 | 0.99mi |
| 205 Riverhill Cv Georgetown, TX | 4.0 | 3.0 | 2095 | $2,075 | $0.99 | 24d | 1 | 1.04mi |
| 128 Free Stone Dr Georgetown, TX | 4.0 | 3.0 | 2053 | $2,195 | $1.07 | 44d | 1 | 1.18mi |
| 201 Merrick Rd Georgetown, TX | 4.0 | 2.0 | 1781 | $2,450 | $1.38 | 24d | 1 | 1.41mi |
| 108 Leon Loop Liberty Hill, TX | 3.0 | 2.0 | 2138 | $2,995 | $1.40 | 24d | 1 | 1.44mi |
| 529 Peace Dr Georgetown, TX | 4.0 | 2.5 | 1994 | $2,199 | $1.10 | 3d | 1 | 1.46mi |
| 509 Peace Dr Georgetown, TX | 3.0 | 2.5 | 1919 | $1,999 | $1.04 | 44d | 1 | 1.48mi |
Listing history 9 events
-
2026-06-09days on market $300,000 Active 313 DOM
-
2026-06-08days on market $300,000 Active 312 DOM
-
2026-06-07days on market $300,000 Active 311 DOM
-
2026-06-05days on market $300,000 Active 308 DOM
-
2026-06-03days on market $300,000 Active 307 DOM
-
2026-06-02days on market $300,000 Active 306 DOM
-
2026-06-01days on market $300,000 Active 305 DOM
-
2026-05-31days on market $300,000 Active 304 DOM
-
2025-07-31$300,000 Active 146-char remark
Show marketing remark (146 chars)
3-5 bedroom homes in MorningStar, Georgetown, TX with resort-style amenities, top-rated schools, and scenic greenbelts. Priced from the mid $300s.
ⓘ Source: listings_history table (triggers on properties + properties_extension) + one-shot
backfill from property_details.listing_events for pre-trigger history.
Climate risk First Street
- Flood 1/10 Low FEMA zone X (unshaded) · 0% chance over 30 yrs
- Wildfire 5/10 Major
- Heat 8/10 Severe 7 d/yr ≥107°F today · 24 d/yr by 30 yrs out
- Wind 6/10 Major 70% chance of damaging wind over 30 yrs
- Air quality 2/10 Low 1 unhealthy d/yr today · 1 by 30 yrs out
Nearby sold comps map
Loading sold comps map…
Walkable amenities ~0.75 mi
Loading nearby amenities…
Taxation est. · year 1
- Rental income
- $27,108
- − Mortgage interest
- −$21,799
- − Property taxes
- −$5,837
- − Insurance
- −$1,946
- − Repairs & maintenance
- −$2,169
- − Management
- −$2,169
- − Depreciation
- −$11,321
- Taxable loss
- −$18,132
- Est. tax savings @ 24.0%
- +$4,352
- After-tax cash flow
- $-6,505/yr
For passive investors: Depreciation is non-cash, so a rental often shows a tax loss while cash-flowing — sheltering income. Rental losses are passive: they offset passive income freely, and up to $25,000/yr can offset ordinary (W-2) income if you actively participate and your MAGI is under $100k (phasing out to $0 by $150k); unused losses carry forward. On sale, claimed depreciation is recaptured at up to 25%, and gains may owe capital-gains tax (a 1031 exchange can defer both). Figures are a year-1 estimate at your 24.0% rate — not tax advice; consult a CPA.
Schools (NCES district)
- District
- Liberty Hill ISD
- NCES district ID
- 4827420
- Math proficiency
- 43% ▼ -20.00%
- Reading proficiency
- 52% ▼ -11.00%
- Median HH income
- $81,084
- Composite
- 43.65/100
- National rank
- #2965
- State rank
- #160 of 826 in TX
Livability — Liberty Hill
- Score
- 68/100
- State rank
- #495
- US rank
- #9892
Category grades
Schools grade is shown separately in the Schools card above.
Census & demographics
- County
- Williamson County · 680,029 people
- City population
- 26,434
- Metro
- Austin-Round Rock-Georgetown, TX
- Population (ZIP)
- 50,822
- Household income
- $125,635
- Rent vs Own
- Severe rent burden
- 1560.0
Population outlook (Williamson County) Hauer SSP2
- Today (2025)
- 699,027 people
- By 2030
- 795,537 · +13.8%
- By 2040
- 990,683 · +41.7%
- By 2050
- 1,184,292 · +69.4%
- By 2075
- 1,623,825 · +132.3%
- By 2100
- 1,924,153 · +175.3%
Race, ethnicity, and origin ACS 2023
- Neighborhood character
- Predominantly White (74%)
- Race & ethnicity
- White 74% Hispanic / Latino 16% Two or more races 9% Asian 4% Black 4%
- Hispanic origin (detail)
- Mexican 11%
- Common ancestry
- Lithuanian 4% Slovak 2% Romanian 2%
- Foreign-born
- 8% · Canada, China
- Languages at home
- 87% English-only · Spanish 7% Other Asian/Pacific 2% Russian/Polish/Slavic 1%
Political lean MEDSL · Williamson
- 2024 margin
- Toss-up / Even · D 48.0% · R 50.4% · Other 1.6%
- 2008→2024 swing
- +10.6pp toward D · 2008: -13.0pp · 2024: -2.5pp
- All cycles
- 2024: R+2.5 2020: D+1.4 2016: R+9.9 2012: R+21.5 2008: R+13.0
Not yet ingested
- Civics
- —
Market trends
- HPI YoY
- ▼ -439.68%
- Current HPI
- 192.7561
- Rent YoY
- ▼ -1.07%
- Metro
- Austin-Round Rock-Georgetown, TX
- State GDP YoY
- ▲ 3.95%
- F500 in state
- 110
Industry mix (Fortune 500 HQ in TX)
| Industry | F500 HQs | Revenue |
|---|---|---|
| Energy | 16 | $1,198B |
|
||
| Technology | 5 | $198B |
|
||
| Engineering / Construction | 4 | $72B |
|
||
| Energy Services | 3 | $60B |
|
||
| Utilities | 3 | $41B |
|
||
| Healthcare | 2 | $330B |
|
||
Price history
1 event — show timeline
- 2025-07-31 Listed $300,000 Zillow
Cash-flow waterfall
monthlySold comps — $/sqft
last 12 mo · ≤1 miLoading sold comps…