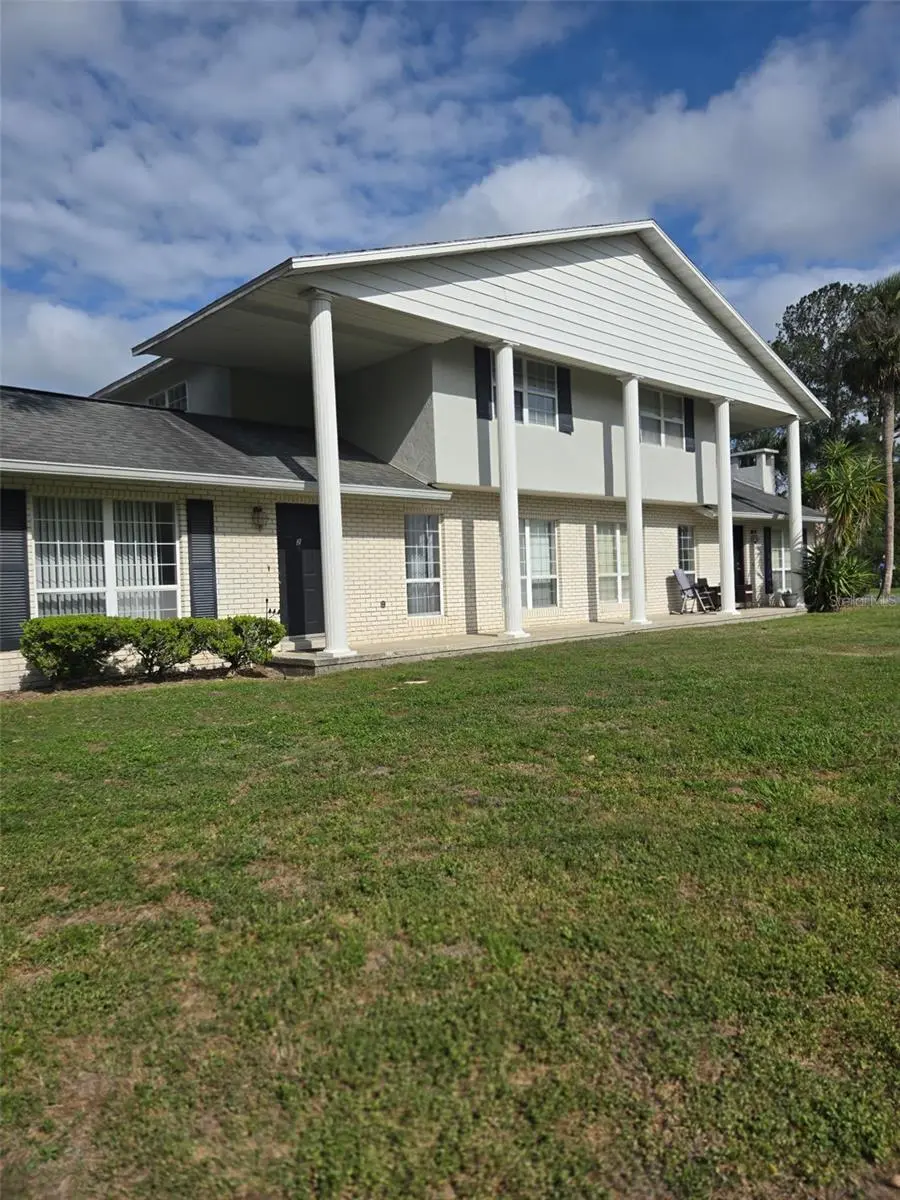
4343 NW 80th Ave #2 · Ocala, FL
Flood risk 1/10 · Minimal
- FEMA flood zone
- X (unshaded)
- Chance of flooding over 30 yrs
- 0.0%
- Est. flood insurance / yr
- $507 – $1,088
Fire risk 5/10 · Moderate
- Est. fire insurance / yr
- $947 – $1,759
Heat risk 8/10 · Major
- Hot days now (above 107°F)
- 7 days/yr
- Hot days in 30 yrs
- 22 days/yr
Wind risk 9/10 · Severe
- Chance of severe wind over 30 yrs
- 99.0%
Air-quality risk 3/10 · Minor
- Unhealthy air days now
- 3 days/yr
- Unhealthy air days in 30 yrs
- 3 days/yr
Risk factors via First Street. Map © Google.
Why this score? — see what drove the C grade
The composite is a weighted blend of 9 inputs, each scored 0–100. Each bar is that input's sub-score; the figure is the points it added to the 100-point composite (weight × sub-score).
- Cash flow +23.0/30.0
- ARV discount +7.5/15.0
- DSCR +7.4/10.0
- 1% rule +6.6/10.0
- Rent growth +5.0/5.0
- Schools +3.6/10.0
- Livability +3.5/5.0
- Condition / age +2.5/5.0
- Appreciation +0.0/10.0
$274,900
🖨 Deal sheet (PDF) 📄 Offer letter ✓ Due diligence
Listing remarks
Attention Horse Lovers!!! This townhome style, condo is perfectly located in the heart of Ocala's Horse Country and just 3 miles to the World Equestrian Center. You are also located at the entrance to Golden Hills Country Club, for easy access to their restaurant and golf course. This is a perfect location for seasonal residents attending one of Ocala's many horse related events. Or full time residents who want to live the relaxed lifestyle with no maintenance living. Easy to "lock & leave" with all exterior maintenance - including the roof, exterior paint and lawn service included in your low monthly dues of $230. Hard to find a true 3 bedroom/3 bath unit with possible 4t
Key facts
- Expansive lawn
- $230 HOA
- Built 1979
Tags
Property features AI
Finance
- Other: Lease restrictions apply
- HOA & community: Monthly condo/HOA fee $230, paid monthly; HOA covers insurance and structure maintenance; Association requires fee payment; Association contact: Brenda Hudson, President; Pets allowed: cats and dogs (with number limit)
Exterior
- Utilities: Electricity connected; Septic tank
- Home design: Residential condominium; Two-story; Northwest facing; Entry on building A
- Construction: Block construction; Shingle roof; Slab foundation; Built as part of Building A
- Exterior features: Front porch; Sliding doors; Landscaped lot; Level lot; Paved surfaces
Interior
- Kitchen: Dishwasher; Range; Refrigerator
- Bedrooms: 3 bedrooms
- Flooring: Carpet; Tile
- Bathrooms: 3 full bathrooms
- Heating & cooling: Central heating (electric); Central air conditioning
- Interior features: Vaulted ceilings; Wood-burning fireplace
- Laundry & utility: Washer; Dryer; Laundry inside
Neighborhood map
What this means for you Summary
Snapshot
- This is a 3-bed/2.5-bath condo listed at $275k.
Deal economics
- At list price, monthly cash flow is $486 ($6k/yr) — positive.
- The deal already cash-flows at list — no discount required.
- Meets the 1% rule at list price ($3k rent vs $275k).
- Recommended offer: $271k (1.5% below list) — sets the bar for market timing.
- Cap rate 8.4% vs local median 4.2% in Ocala — top-decile yield for the area; either an underpriced asset or a hidden risk that comps aren't pricing in. Stress-test before assuming the spread holds.
Location & tenants
- Location reads 69/100 on livability (#476 in FL) — a middle-class / working-renter tenant base. Strengths: cost of living A+, housing A+, health & safety A+; Watch: crime F, amenities F, commute F.
- Marion (rural): math 42% / reading 43% proficiency, ranked #61 of 73 in FL (top 84%) — families likely to look elsewhere, expect single-tenant / working-renter base with shorter leases; 61% free/reduced lunch — lower-income household profile, screen leases tightly.
- Market conditions: Rents rising fast (+11.1%/yr); 663 active listings in the ZIP; 7 comparable units currently listed for rent nearby; rentals at typical pace (median 14d on market — plan ~3-4 weeks tenant-placement turnaround); 7,071 units permitted in Marion County in 2024 (534 in 5+ unit buildings).
- At $3,186/mo this rent would consume 58% of the median local household income ($66k/yr) (locally 282% of renters already pay >50% of income on rent) — very limited rent-growth headroom before tenants either downsize or default.
Forward outlook
- Local home prices are declining (-3.0%/yr); year-one equity from $2k of loan paydown is wiped out by about $8k of value loss. Plan a longer hold.
- Marion County population projected at +13% by 2050 — modest demand growth; plan on rents tracking national, not racing it.
- At projected returns (-3.0% appreciation + 8.0% rent growth), your $77k cash investment doubles in ~8 years — after that, you're playing with house money.
Negotiation context
- It's been on market 15 days — a 2% lower offer ($271k) is reasonable based on typical stale-listing flexibility.
- 2 sale attempts since 10y ago with the ask held roughly flat each time — persistent listings suggest the price (not the market) is what's stuck; bring a comps-based counter.
- Current owner paid $55k; list at $275k implies a 400% gain — meaningful room to come down on a strong offer.
Risks & watch-outs
- Climate carrying-cost: severe wind risk, 99% chance of damaging wind over 30y; moderate wildfire risk; extreme-heat days projected 7→22/yr by 2055 (HVAC capex compounding) — expect insurance premiums to compound above CPI over the hold.
Questions for the listing agent
- Built in 1979 — when were the roof, HVAC, electrical panel, plumbing, and water heater last replaced?
- What does the HOA fee cover, when was the last increase, and are there any pending special assessments or reserve-fund shortfalls?
- Any open or pending special assessments — roof, HVAC, plumbing, elevator, façade? What's the per-unit balance and payoff schedule, and is the seller paying it off at close or rolling it to the buyer?
- Is there a deadline driving the sale (1031 exchange, divorce, estate, relocation)? That informs how much negotiation room exists.
- Crime grade is F in this area — have there been break-ins, vandalism, or insurance claims at this property in the last 3 years? What carrier currently insures it and at what premium?
- What's the average days-on-market for RENTAL listings here right now (not sales)? A rising rental-DOM trend means longer vacancies and softer asking-rent achievability than the comps imply.
- What's the recent tenant-quality profile in this submarket — average credit score on applications, eviction rate, late-payment / NSF rate, and stable-employment percentage? A property-management company in the area should have these aggregated.
- How much new apartment / multifamily construction is in the pipeline within 1–3 miles? Heavy new supply (>2% of stock underway) typically softens rents 12–24 months out; light construction supports rent growth.
Investment metrics
- 1% rule
- 1.16% ✓
- Cap rate
- 8.42%
- Cash-on-cash
- 7.58%
- DSCR
- 1.34
- GRM
- 7.2
CMA / ARV
No comps found within radius.
Projected returns pro-forma
-3.0% appreciation · 8.0% rent growth · sell at horizon
- IRR
- 1.1%
- Equity multiple
- 1.04×
- Total profit
- $3,399
- Equity at exit
- $40,988
- IRR
- 15.4%
- Equity multiple
- 2.56×
- Total profit
- $119,998
- Equity at exit
- $23,768
Cash invested: $76,972 (down + closing). Projections, not guarantees.
Landlord ↔ Tenant lean methodology
- Overall (STATE)
- 87 Strongly Landlord-Friendly
- State Florida
- 87 Strongly Landlord-Friendly · R+3
- County
- — inherits STATE
- City
- — inherits STATE
ZIP-level market 34482
- Rents YoY
- 11.1%
- Active inventory
- 663
- Price-to-rent
- 7.2×
Monthly cashflow live
- Estimated rent
- $3,186 high interval (Pro) →
- Mortgage (P&I)
- −$1,442
- Tax from tax record
- −$244 /mo · $2,928/yr
- Insurance
- −$115
- HOA
- −$230
- Vacancy / Maint / Mgmt
- −$669
- Net cashflow
- $486
Break-even live
Sensitivity live
| Price | -10% $642 | -5% $564 | +0% $486 | +5% $409 | +10% $331 |
|---|---|---|---|---|---|
| Rent | -10% $235 | -5% $361 | +0% $486 | +5% $612 | +10% $738 |
| Rate | -1.0pp $625 | -0.5pp $556 | base $486 | +0.5pp $415 | +1.0pp $343 |
UW: 25.0% down · 7.5% · 30yr · 1.5% tax · 5.0% vac · 8.0% maint · 8.0% mgmt
Financing live
Cash to close
- Down payment
- $68,725
- Closing costs
- $8,247
- Reserves months
- —
- Total cash needed
- —
Loan-product check · same deal, 3 products live
Conventional
25% down · 7.5% · 30yr
- Down + closing
- —
- Monthly P&I
- —
- Monthly cashflow
- —
- DSCR
- —
- Eligible?
- —
Personal DTI + credit; lowest rate.
DSCR
20% down · 8.5% · 30yr
- Down + closing
- —
- Monthly P&I
- —
- Monthly cashflow
- —
- DSCR
- —
- Eligible?
- —
No personal income docs; deal must DSCR.
Hard money
10% down · 12.0% · 12mo
- Down + closing
- —
- Monthly P&I
- —
- Monthly cashflow
- —
- DSCR
- —
- Eligible?
- —
Short-term bridge; refi at stabilization.
Rent comps 7 comps
| Address | Beds | Baths | Sqft | Rent | $/sqft | DOM | Units | Dist |
|---|---|---|---|---|---|---|---|---|
| 4455 NW 80th Ter Ocala, FL | 4.0 | 2.0 | 2100 | $4,000 | $1.90 | 21d | 1 | 0.14mi |
| 8101 NW 46th St Ocala, FL | 3.0 | 2.5 | 1994 | $3,750 | $1.88 | 14d | 1 | 0.26mi |
| 8120 NW 48th Ln Ocala, FL | 3.0 | 2.0 | 2160 | $3,500 | $1.62 | 14d | 1 | 0.42mi |
| 8185 NW 48th Ln Ocala, FL | 3.0 | 2.0 | 1671 | $3,750 | $2.24 | 14d | 1 | 0.47mi |
| 4400 NW 74th Ter Ocala, FL | 3.0 | 2.0 | 1274 | $2,300 | $1.81 | 21d | 1 | 0.47mi |
| 7462 NW 44th Ln Ocala, FL | 3.0 | 2.0 | 1350 | $1,975 | $1.46 | 21d | 1 | 0.50mi |
| 4415 NW 74th Ter Ocala, FL | 3.0 | 2.0 | 1350 | $1,975 | $1.46 | 14d | 1 | 0.51mi |
HOA detail condo
- Monthly dues
- $230 · $2,760/yr
- Likely covers
- exterior maint.
- Assessments
- None detected in remarks — confirm with the listing agent.
Listing history 11 events
-
2026-06-18days on market $274,900 Active 15 DOM
-
2026-06-17days on market $274,900 Active 14 DOM
-
2026-06-16days on market $274,900 Active 13 DOM
-
2026-06-15days on market $274,900 Active 12 DOM
-
2026-06-14days on market $274,900 Active 10 DOM
-
2026-06-13days on market $274,900 Active 9 DOM
-
2026-06-10days on market $274,900 Active 7 DOM
-
2026-06-09days on market $274,900 Active 6 DOM
-
2026-06-08days on market $274,900 Active 5 DOM
-
2026-06-07remarks 685-char remark
-
2026-06-07$274,900 Active 4 DOM
ⓘ Source: listings_history table (triggers on properties + properties_extension) + one-shot
backfill from property_details.listing_events for pre-trigger history.
Tax reassessment forecast FL · Resets to sale price
- Current annual tax
- $2,928 · $244/mo
- Projected year-2 tax
- $2,928 · $244/mo
- Expected delta
- $0/yr ($0/mo · 0.0%)
ⓘ Screening estimate from a state-policy table — verify with the county assessor before closing.
Climate risk First Street
- Flood 1/10 Low FEMA zone X (unshaded) · 0% chance over 30 yrs
- Wildfire 5/10 Major
- Heat 8/10 Severe 7 d/yr ≥107°F today · 22 d/yr by 30 yrs out
- Wind 9/10 Extreme 99% chance of damaging wind over 30 yrs
- Air quality 3/10 Moderate 3 unhealthy d/yr today · 3 by 30 yrs out
Nearby sold comps map
Loading sold comps map…
Walkable amenities ~0.75 mi
Loading nearby amenities…
Taxation est. · year 1
- Rental income
- $38,227
- − Mortgage interest
- −$15,399
- − Property taxes
- −$2,928
- − Insurance
- −$1,374
- − Repairs & maintenance
- −$3,058
- − Management
- −$3,058
- − HOA
- −$2,760
- − Depreciation
- −$7,997
- Taxable income
- $1,652
- Est. tax owed @ 24.0%
- −$397
- After-tax cash flow
- $5,441/yr
For passive investors: Depreciation is non-cash, so a rental often shows a tax loss while cash-flowing — sheltering income. Rental losses are passive: they offset passive income freely, and up to $25,000/yr can offset ordinary (W-2) income if you actively participate and your MAGI is under $100k (phasing out to $0 by $150k); unused losses carry forward. On sale, claimed depreciation is recaptured at up to 25%, and gains may owe capital-gains tax (a 1031 exchange can defer both). Figures are a year-1 estimate at your 24.0% rate — not tax advice; consult a CPA.
Schools (NCES district)
- District
- Marion
- NCES district ID
- 1201260
- Math proficiency
- 42% ▼ -7.00%
- Reading proficiency
- 43% ▼ -4.00%
- Median HH income
- $40,015
- Composite
- 35.61/100
- National rank
- #4890
- State rank
- #61 of 73 in FL
Livability — Ocala
- Score
- 69/100
- State rank
- #476
- US rank
- #8461
Category grades
Schools grade is shown separately in the Schools card above.
Census & demographics
- County
- Marion County · 315,796 people
- City population
- 263,375
- Metro
- Ocala, FL
- Population (ZIP)
- 22,807
- Household income
- $65,901
- Rent vs Own
- Severe rent burden
- 282.0
Population outlook (Marion County) Hauer SSP2
- Today (2025)
- 365,905 people
- By 2030
- 376,768 · +3.0%
- By 2040
- 396,555 · +8.4%
- By 2050
- 412,723 · +12.8%
- By 2075
- 446,090 · +21.9%
- By 2100
- 436,193 · +19.2%
Race, ethnicity, and origin ACS 2023
- Neighborhood character
- Majority White (63%)
- Race & ethnicity
- White 63% Hispanic / Latino 19% Black 14% Two or more races 12%
- Hispanic origin (detail)
- Mexican 6% Puerto Rican 9% Cuban 2%
- Common ancestry
- Lithuanian 2% Romanian 2% Slovak 2%
- Foreign-born
- 10% · Canada
- Languages at home
- 81% English-only · Spanish 16% Other Indo-European 1%
Political lean MEDSL · Marion
- 2024 margin
- Solid R (+31.6) · D 33.8% · R 65.5%
- 2008→2024 swing
- -20.0pp toward R · 2008: -11.6pp · 2024: -31.6pp
- All cycles
- 2024: R+31.6 2020: R+25.9 2016: R+26.2 2012: R+16.2 2008: R+11.6
Not yet ingested
- Civics
- —
Market trends
- HPI YoY
- ▼ -133.62%
- Current HPI
- 194.3857
- Rent YoY
- ▲ 11.12%
- Metro
- Ocala, FL
- State GDP YoY
- ▲ 3.28%
- F500 in state
- 36
Industry mix (Fortune 500 HQ in FL)
| Industry | F500 HQs | Revenue |
|---|---|---|
| Industrial Technology | 2 | $29B |
|
||
| Insurance | 2 | $17B |
|
||
| Retail | 1 | $60B |
|
||
| Technology Distribution | 1 | $58B |
|
||
| Homebuilding | 1 | $35B |
|
||
| Technology Manufacturing | 1 | $35B |
|
||
Price history
+399.8% since first listed4 events — show timeline
- 2026-06-03 Listed $274,900 Stellar MLS as Distributed by MLS Grid
- 2016-04-20 Listing Removed — Stellar MLS as Distributed by MLS Grid
- 2016-02-03 Listed $127,500 Stellar MLS as Distributed by MLS Grid
- 1996-05-29 Sold (Public Records) $55,000 Public Records
Property tax history
+8.3%/yrLatest (2025): $2,928 · +11.9% YoY. Source: county tax records.
Cash-flow waterfall
monthlySold comps — $/sqft
last 12 mo · ≤1 miLoading sold comps…