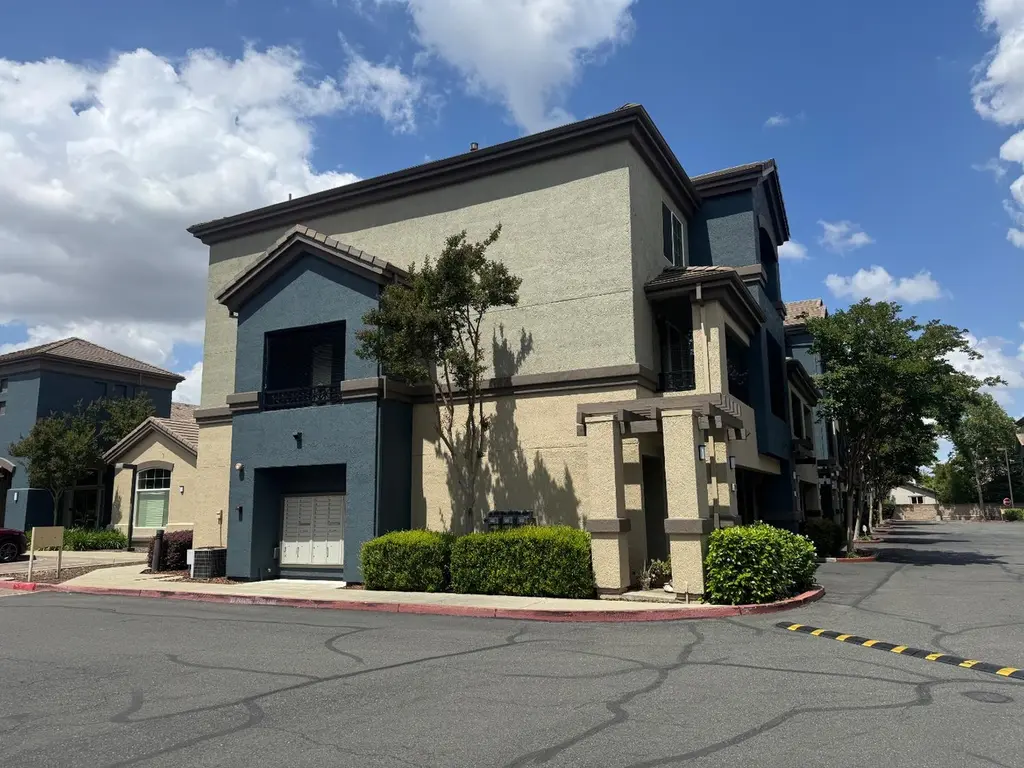
2001 Club Center Dr #3101 · Sacramento, CA
Flood risk No data
- FEMA flood zone
- —
- Chance of flooding over 30 yrs
- —
- Est. flood insurance / yr
- —
Fire risk No data
- Est. fire insurance / yr
- —
Heat risk No data
- Hot days now (above threshold)
- —
- Hot days in 30 yrs
- —
Wind risk No data
- Chance of severe wind over 30 yrs
- —
Air-quality risk No data
- Unhealthy air days now
- —
- Unhealthy air days in 30 yrs
- —
Risk factors via First Street. Map © Google.
Why this score? — see what drove the D- grade
The composite is a weighted blend of 9 inputs, each scored 0–100. Each bar is that input's sub-score; the figure is the points it added to the 100-point composite (weight × sub-score).
- ARV discount +9.8/15.0
- Appreciation +9.6/10.0
- Cash flow +4.4/30.0
- Schools +4.1/10.0
- Livability +3.6/5.0
- Rent growth +2.9/5.0
- Condition / age +2.5/5.0
- 1% rule +2.1/10.0
- DSCR +0.0/10.0
$329,900
🖨 Deal sheet 📄 Offer letter ✓ Due diligence
Listing remarks
Discover sophisticated urban living at 2001 Club Center Dr #3101 in Natomas. This beautiful home, spanning 1114 square feet, sits on a premium corner lot with only one adjoining neighbor and two balconies! To add, this home presents an attractive and well-maintained environment, ready to enhance your daily life. The kitchen, featuring elegant counters and a functional peninsula, seamlessly integrates into an open-plan design with the living room, fostering an inviting atmosphere for both everyday living and entertaining. Throughout the living room and bedrooms, warm replicate hardwood flooring adds a touch of classic refinement. Each bedroom in this home offers the convenience of its own pr
Key facts
- Two balconies
- Premium corner lot
- Open-plan design
Tags
Property features AI
Finance
- HOA & community: Mandatory association; Monthly association fee; Association amenities: barbeque, pool, clubhouse, recreation facilities, exercise room/gym; Association fee covers exterior and grounds maintenance and pool
Exterior
- Parking: Attached 2-car garage; Street entrance to garage
- Utilities: Natural gas available; 220-volt electric service; Public water; Public sewer; Irrigation: other source
- Home design: Attached condominium; 3 stories; Street-level entrance on lower level; Living and dining areas on main level; Bedrooms on upper level; Built in 2006
- Construction: Tile roof; Built in 2006
- Exterior features: Corner location; Close to clubhouse; Tile roof; No private pool or spa
Interior
- Kitchen: Pantry closet; Synthetic countertops
- Bedrooms: 2 bedrooms; Master bedroom on upper level
- Flooring: Simulated wood; Tile; Wood
- Bathrooms: 2 full bathrooms; 1 half bathroom; Tub with shower over
- Heating & cooling: Central heating; Central air; Ceiling fan(s)
- Interior features: Great room; Pantry closet; Synthetic countertops; Dining bar
- Laundry & utility: Electric hookup in garage
Neighborhood map
What this means for you Summary
Snapshot
- This is a 2-bed/2.5-bath condo listed at $330k.
Deal economics
- At list price, monthly cash flow is $-859 ($-10k/yr) — negative.
- To cash-flow at today's rent, offer at most $178k (46.0% below list).
- To meet the 1% rule (rent ≥ 1% of price), the offer needs to be $236k (28.6% below list).
- Recommended offer: $178k (46.0% below list) — sets the bar for cash-flow.
Location & tenants
- Location reads 71/100 on livability (#218 in CA) — a middle-class / working-renter tenant base. Strengths: amenities A+, commute A+, housing A; Watch: schools D+, crime F, cost of living F.
- Natomas Unified (urban): math 33% / reading 60% proficiency, ranked #155 of 517 in CA (top 30%) — families likely to look elsewhere, expect single-tenant / working-renter base with shorter leases.
- Market conditions: Rents rising (+1.4%/yr); 402 active listings in the ZIP; 12 comparable units currently listed for rent nearby; rentals leasing fast (median 2d on market — plan ~1-2 weeks tenant-placement turnaround); high-income renter base; 6,825 units permitted in Sacramento County in 2024 (1,752 in 5+ unit buildings).
Forward outlook
- In year one you build about $33k of equity ($2k loan paydown + $30k appreciation (9.2% local appreciation)).
- Sacramento County population projected at +17% by 2050 — long-run rental-demand tailwind backs the buy-and-hold thesis.
- By year 2, paydown + projected appreciation supports a ~$52k cash-out refi (75% LTV) — recoverable capital for the next deal without selling this one.
Negotiation context
- It's been on market 50 days — a 3% lower offer ($320k) is reasonable based on typical stale-listing flexibility.
Questions for the listing agent
- What do current leases actually rent for vs. the listed asking? Can we see a recent rent roll and the last 12 months of T-12 income?
- It's been on market 50 days. Have you received any prior offers? Is the seller open to a 46% concession, seller financing, or rate buy-down credit?
- What does the HOA fee cover, when was the last increase, and are there any pending special assessments or reserve-fund shortfalls?
- Any open or pending special assessments — roof, HVAC, plumbing, elevator, façade? What's the per-unit balance and payoff schedule, and is the seller paying it off at close or rolling it to the buyer?
- Is there a deadline driving the sale (1031 exchange, divorce, estate, relocation)? That informs how much negotiation room exists.
- Schools are D-rated, which usually means shorter tenancies and higher turnover. Who's the typical renter profile here, and what's been the actual vacancy rate?
- Crime grade is F in this area — have there been break-ins, vandalism, or insurance claims at this property in the last 3 years? What carrier currently insures it and at what premium?
- The area grade is low — what's the realistic commute time and amenity access for the typical tenant pool here? Any planned neighborhood developments (good or bad) we should know about?
- What's the average days-on-market for RENTAL listings here right now (not sales)? A rising rental-DOM trend means longer vacancies and softer asking-rent achievability than the comps imply.
- What's the recent tenant-quality profile in this submarket — average credit score on applications, eviction rate, late-payment / NSF rate, and stable-employment percentage? A property-management company in the area should have these aggregated.
- How much new apartment / multifamily construction is in the pipeline within 1–3 miles? Heavy new supply (>2% of stock underway) typically softens rents 12–24 months out; light construction supports rent growth.
Investment metrics
- 1% rule
- 0.71% ✗
- Cap rate
- 3.17%
- Cash-on-cash
- -11.16%
- DSCR
- 0.50
- GRM
- 11.7
CMA / ARV
- ARV (median comp)
- $347,363
- List price
- $329,900
- Delta
- -5.03%
- Verdict
- FAIR
- Comps
- 20 within 1.0 mi
Projected returns pro-forma
9.18% appreciation · 1.43% rent growth · sell at horizon
- IRR
- 14.1%
- Equity multiple
- 2.12×
- Total profit
- $103,355
- Equity at exit
- $277,781
- IRR
- 13.8%
- Equity multiple
- 4.65×
- Total profit
- $337,057
- Equity at exit
- $579,518
Cash invested: $92,372 (down + closing). Projections, not guarantees.
Landlord ↔ Tenant lean methodology
- Overall (STATE)
- 18 Strongly Tenant-Friendly
- State California
- 18 Strongly Tenant-Friendly · D+13
- County
- — inherits STATE
- City
- — inherits STATE
ZIP-level market 95835
- Home prices YoY
- 3.5%
- Rents YoY
- 1.4%
- Active inventory
- 402
- Price-to-rent
- 11.7×
Monthly cashflow live
- Estimated rent
- $2,355 high interval (Pro) →
- Mortgage (P&I)
- −$1,730
- Tax from tax record
- −$425 /mo · $5,101/yr
- Insurance
- −$137
- HOA
- −$427
- Vacancy / Maint / Mgmt
- −$495
- Net cashflow
- $-859
Break-even live
UW: 25.0% down · 7.5% · 30yr · 1.5% tax · 5.0% vac · 8.0% maint · 8.0% mgmt
Financing live
Cash to close
- Down payment
- $82,475
- Closing costs
- $9,897
- Reserves months
- —
- Total cash needed
- —
Loan-product check · same deal, 3 products live
Conventional
25% down · 7.5% · 30yr
- Down + closing
- —
- Monthly P&I
- —
- Monthly cashflow
- —
- DSCR
- —
- Eligible?
- —
Personal DTI + credit; lowest rate.
DSCR
20% down · 8.5% · 30yr
- Down + closing
- —
- Monthly P&I
- —
- Monthly cashflow
- —
- DSCR
- —
- Eligible?
- —
No personal income docs; deal must DSCR.
Hard money
10% down · 12.0% · 12mo
- Down + closing
- —
- Monthly P&I
- —
- Monthly cashflow
- —
- DSCR
- —
- Eligible?
- —
Short-term bridge; refi at stabilization.
Rent comps 12 comps
| Address | Beds | Baths | Sqft | Rent | $/sqft | DOM | Units | Dist |
|---|---|---|---|---|---|---|---|---|
| 2001 Club Center Dr #3110 Sacramento, CA | 2.0 | 2.5 | 1154 | $2,195 | $1.90 | 4d | 1 | 0.02mi |
| 50 Regency Park Cir #9106 Sacramento, CA | 3.0 | 3.0 | 1384 | $2,495 | $1.80 | 44d | 1 | 0.17mi |
| 1850 Club Center Dr Sacramento, CA | 1.0–3.0 | 1.0–2.0 | 985 | $2,124 | $2.16 | 2d | 9 | 0.23mi |
| 1900 Danbrook Dr Sacramento, CA | 1.0 | 1.0 | 873 | $1,772 | $2.03 | 44d | 2 | 0.25mi |
| 1900 Danbrook Dr Sacramento, CA | 1.0 | 1.0 | 1015 | $2,048 | $2.02 | 4d | 2 | 0.25mi |
| 4850 Natomas Blvd Sacramento, CA | 1.0–2.0 | 1.0–2.0 | 837 | $2,540 | $3.03 | 2d | 17 | 0.75mi |
| 1947 Acari Ave Sacramento, CA | 3.0 | 2.0 | 1492 | $2,695 | $1.81 | 2d | 1 | 0.80mi |
| 1536 Alicia Way Sacramento, CA | 3.0 | 2.0 | 1397 | $2,700 | $1.93 | 44d | 1 | 1.01mi |
| 4601 Blackrock Dr Sacramento, CA | 1.0–2.0 | 1.0–2.0 | 940 | $2,528 | $2.69 | 2d | 7 | 1.14mi |
| 4500 Truxel Rd Sacramento, CA | 1.0–3.0 | 1.0–2.0 | 1000 | $3,246 | $3.25 | 2d | 22 | 1.25mi |
| 4800 Kokomo Dr Sacramento, CA | 1.0–3.0 | 1.0–3.5 | 1229 | $2,906 | $2.36 | 2d | 26 | 1.27mi |
| 3044 Enchanted Walk Sacramento, CA | 3.0 | 2.5 | 1351 | $2,300 | $1.70 | 2d | 1 | 1.32mi |
HOA detail condo
- Monthly dues
- $427 · $5,124/yr
- Assessments
- None detected in remarks — confirm with the listing agent.
Listing history 15 events
-
2026-06-18days on market $329,900 Active 50 DOM
-
2026-06-17days on market $329,900 Active 49 DOM
-
2026-06-16days on market $329,900 Active 48 DOM
-
2026-06-15days on market $329,900 Active 47 DOM
-
2026-06-13days on market $329,900 Active 45 DOM
-
2026-06-13days on market $329,900 Active 44 DOM
-
2026-06-09days on market $329,900 Active 41 DOM
-
2026-06-08days on market $329,900 Active 40 DOM
-
2026-06-07days on market $329,900 Active 39 DOM
-
2026-06-05days on market $329,900 Active 36 DOM
-
2026-06-03days on market $329,900 Active 35 DOM
-
2026-06-02days on market $329,900 Active 34 DOM
-
2026-06-01days on market $329,900 Active 33 DOM
-
2026-05-31days on market $329,900 Active 32 DOM
-
2021-07-02soldstatus $356,000
ⓘ Source: listings_history table (triggers on properties + properties_extension) + one-shot
backfill from property_details.listing_events for pre-trigger history.
Tax reassessment forecast CA · Resets to sale price
- Current annual tax
- $5,101 · $425/mo
- Projected year-2 tax
- $5,101 · $425/mo
- Expected delta
- $0/yr ($0/mo · 0.0%)
ⓘ Screening estimate from a state-policy table — verify with the county assessor before closing.
Nearby sold comps map
Loading sold comps map…
Walkable amenities ~0.75 mi
Loading nearby amenities…
Taxation est. · year 1
- Rental income
- $28,263
- − Mortgage interest
- −$18,480
- − Property taxes
- −$5,101
- − Insurance
- −$1,650
- − Repairs & maintenance
- −$2,261
- − Management
- −$2,261
- − HOA
- −$5,124
- − Depreciation
- −$9,597
- Taxable loss
- −$16,210
- Est. tax savings @ 24.0%
- +$3,890
- After-tax cash flow
- $-6,417/yr
For passive investors: Depreciation is non-cash, so a rental often shows a tax loss while cash-flowing — sheltering income. Rental losses are passive: they offset passive income freely, and up to $25,000/yr can offset ordinary (W-2) income if you actively participate and your MAGI is under $100k (phasing out to $0 by $150k); unused losses carry forward. On sale, claimed depreciation is recaptured at up to 25%, and gains may owe capital-gains tax (a 1031 exchange can defer both). Figures are a year-1 estimate at your 24.0% rate — not tax advice; consult a CPA.
Schools (NCES district)
- District
- Natomas Unified
- NCES district ID
- 0600036
- Math proficiency
- 33% ▼ -1.00%
- Reading proficiency
- 60% ▲ 13.00%
- Median HH income
- $67,969
- Composite
- 41.49/100
- National rank
- #3457
- State rank
- #155 of 517 in CA
Livability — Sacramento
- Score
- 71/100
- State rank
- #218
- US rank
- #6957
Category grades
Schools grade is shown separately in the Schools card above.
Census & demographics
- Census place
- Sacramento, CA
- County
- Sacramento County · 1,539,646 people
- City population
- 761,410
- Metro
- Sacramento-Roseville-Folsom, CA
- Population (ZIP)
- 42,004
- Household income
- $114,468
- Rent vs Own
- Severe rent burden
- 1234.0
Population outlook (Sacramento County) Hauer SSP2
- Today (2025)
- 1,660,763 people
- By 2030
- 1,732,990 · +4.3%
- By 2040
- 1,855,755 · +11.7%
- By 2050
- 1,941,335 · +16.9%
- By 2075
- 2,046,162 · +23.2%
- By 2100
- 1,961,444 · +18.1%
Race, ethnicity, and origin ACS 2023
- Neighborhood character
- Highly diverse neighborhood (Simpson 0.78)
- Race & ethnicity
- Asian 30% White 29% Hispanic / Latino 19% Two or more races 15% Black 13%
- Hispanic origin (detail)
- Mexican 15%
- Common ancestry
- Scotch-Irish 2% Italian 1% Romanian 1%
- Foreign-born
- 25% · China, Canada, Vietnam
- Languages at home
- 66% English-only · Other Indo-European 10% Spanish 8% Other Asian/Pacific 4%
Political lean MEDSL · Sacramento
- 2024 margin
- D (+19.7) · D 58.1% · R 38.4% · Other 3.5%
- 2008→2024 swing
- +0.7pp no change · 2008: 19.0pp · 2024: 19.7pp
- All cycles
- 2024: D+19.7 2020: D+25.3 2016: D+23.7 2012: D+16.3 2008: D+19.0
Not yet ingested
- Civics
- —
Market trends
- HPI YoY
- ▲ 9.18%
- Current HPI
- 271.4823
- Rent YoY
- ▲ 1.43%
- Metro
- Sacramento-Roseville-Folsom, CA
- State GDP YoY
- ▲ 3.21%
- F500 in state
- 116
Industry mix (Fortune 500 HQ in CA)
| Industry | F500 HQs | Revenue |
|---|---|---|
| Technology | 27 | $1,492B |
|
||
| Financial Services | 3 | $174B |
|
||
| Retail | 3 | $44B |
|
||
| Insurance | 3 | $26B |
|
||
| Media / Entertainment | 2 | $115B |
|
||
| Pharmaceuticals / Biotech | 2 | $62B |
|
||
Price history
1 event — show timeline
- 2021-07-02 Sold (Public Records) $356,000 Public Records
Property tax history
+2.8%/yrLatest (2025): $5,101 · -3.7% YoY. Source: county tax records.
Cash-flow waterfall
monthlySold comps — $/sqft
last 12 mo · ≤1 miLoading sold comps…