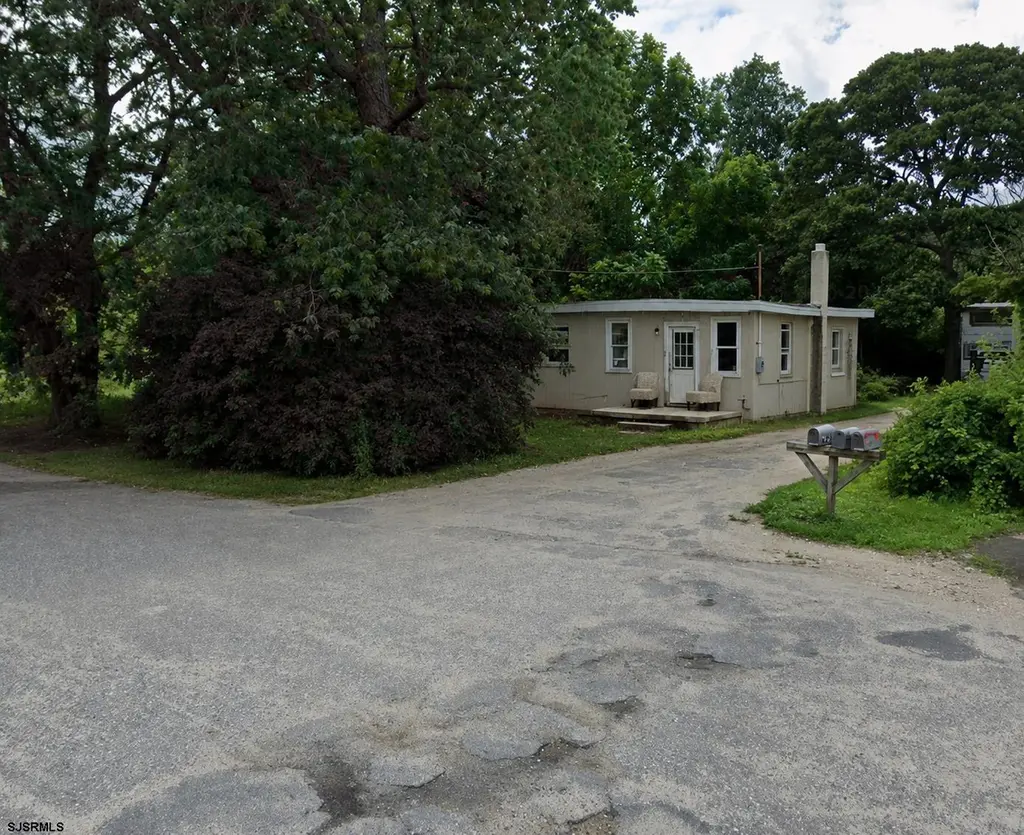
1509 Garfield Ave · Pleasantville, NJ
Flood risk 1/10 · Minimal
- FEMA flood zone
- —
- Chance of flooding over 30 yrs
- 0.0%
- Est. flood insurance / yr
- —
Fire risk 4/10 · Minor
- Est. fire insurance / yr
- $526 – $976
Heat risk 8/10 · Major
- Hot days now (above 97°F)
- 7 days/yr
- Hot days in 30 yrs
- 16 days/yr
Wind risk 8/10 · Major
- Chance of severe wind over 30 yrs
- 80.0%
Air-quality risk 2/10 · Minimal
- Unhealthy air days now
- 2 days/yr
- Unhealthy air days in 30 yrs
- 2 days/yr
Risk factors via First Street. Map © Google.
Why this score? — see what drove the B grade
The composite is a weighted blend of 9 inputs, each scored 0–100. Each bar is that input's sub-score; the figure is the points it added to the 100-point composite (weight × sub-score).
- Cash flow +29.2/30.0
- ARV discount +13.4/15.0
- DSCR +10.0/10.0
- 1% rule +9.8/10.0
- Livability +3.7/5.0
- Rent growth +2.5/5.0
- Condition / age +2.5/5.0
- Schools +1.4/10.0
- Appreciation +0.0/10.0
$169,000
🖨 Deal sheet (PDF) 📄 Offer letter ✓ Due diligence
Listing remarks MLS
Cottage with 2 bedroom, 1 bath, electric heat, Pergo vinyl flooring, vinyl replacement windows. Adjacent lot available with the house. Previously rented for $550/month. Easy to show.
Key facts
- 3 parking spots
- Built 1955
- Listed 40 days
Property features AI
Exterior
- Parking: Exterior parking for three or more cars; No garage
- Utilities: Public water; Public sewer
- Home design: Property offered for sale; Age: 25+ years
- Construction: Stucco siding
- Exterior features: Stucco exterior; Lot dimensions approximately 60 x 80; Zoned R-75; Not waterfront
Interior
- Kitchen: Dishwasher; Electric stove; Refrigerator
- Flooring: Tile; Laminate
- Bathrooms: 1 full bathroom
- Heating & cooling: Natural gas heating
- Interior features: Dishwasher; Electric stove; Refrigerator; Tile and laminate flooring; Crawl space basement
Neighborhood map
What this means for you Summary
Snapshot
- This is a 3-bed/1.0-bath single-family listed at $169k.
Deal economics
- At list price, monthly cash flow is $587 ($7k/yr) — positive.
- The deal already cash-flows at list — no discount required.
- Meets the 1% rule at list price ($2k rent vs $169k).
- Recommended offer: $164k (3.0% below list) — sets the bar for market timing.
- Cap rate 10.5% vs local median 4.5% in Pleasantville — top-decile yield for the area; either an underpriced asset or a hidden risk that comps aren't pricing in. Stress-test before assuming the spread holds.
Location & tenants
- Location reads 73/100 on livability (#194 in NJ) — a middle-class / working-renter tenant base. Strengths: commute A+, health & safety A+; Watch: crime C-, amenities F, employment D-.
- Pleasantville Public School District (suburban): math 6% / reading 28% proficiency, ranked #451 of 472 in NJ (top 96%) — low school quality limits family demand, transient renter base, plan for 1-2y turnover; 81% free/reduced lunch — lower-income household profile, screen leases tightly.
- Zoned schools: Pleasantville Middle School (math 6% / reading 33%, grade F, #398 of 431 statewide, top 93%, 883 students, 85% FRL); Pleasantville High School (math 10% / reading 28%, grade F, #361 of 399 statewide, top 91%, 924 students, 79% FRL) — zoned schools at 82% FRL track the district average.
- Market conditions: 83 active listings in the ZIP; 1 comparable units currently listed for rent nearby; 672 units permitted in Atlantic County in 2024 (258 in 5+ unit buildings).
Forward outlook
- Local home prices are declining (-3.0%/yr); year-one equity from $1k of loan paydown is wiped out by about $5k of value loss. Plan a longer hold.
- Atlantic County population projected at -12% by 2050 — secular population decline; favor cash flow + early exit over multi-decade hold.
- At projected returns (-3.0% appreciation + 3.0% rent growth), your $47k cash investment doubles in ~8 years — after that, you're playing with house money.
Negotiation context
- It's been on market 40 days — a 3% lower offer ($164k) is reasonable based on typical stale-listing flexibility.
- 2 sale attempts since 10y ago with the ask held roughly flat each time — persistent listings suggest the price (not the market) is what's stuck; bring a comps-based counter.
- Current owner paid $90k; list at $169k implies a 88% gain — meaningful room to come down on a strong offer.
Risks & watch-outs
- Watch-outs: property tax is 3.1% of price; built in 1955 — expect roof / HVAC / electrical / plumbing capex.
- Climate carrying-cost: severe wind risk, 80% chance of damaging wind over 30y; extreme-heat days projected 7→16/yr by 2055 (HVAC capex compounding) — expect insurance premiums to compound above CPI over the hold.
Questions for the listing agent
- It's been on market 40 days. Have you received any prior offers? Is the seller open to a 3% concession, seller financing, or rate buy-down credit?
- Built in 1955 — when were the roof, HVAC, electrical panel, plumbing, and water heater last replaced?
- Property tax is high relative to price — has the assessment been appealed recently, and will the sale trigger a re-assessment?
- Is there a deadline driving the sale (1031 exchange, divorce, estate, relocation)? That informs how much negotiation room exists.
- Schools are F-rated, which usually means shorter tenancies and higher turnover. Who's the typical renter profile here, and what's been the actual vacancy rate?
- What's the average days-on-market for RENTAL listings here right now (not sales)? A rising rental-DOM trend means longer vacancies and softer asking-rent achievability than the comps imply.
- What's the recent tenant-quality profile in this submarket — average credit score on applications, eviction rate, late-payment / NSF rate, and stable-employment percentage? A property-management company in the area should have these aggregated.
- How much new for-sale + rental construction is in the pipeline within 1–3 miles? Heavy new supply typically softens prices + rents 12–24 months out; constrained supply supports both.
Investment metrics
- 1% rule
- 1.48% ✓
- Cap rate
- 10.46%
- Cash-on-cash
- 14.90%
- DSCR
- 1.66
- GRM
- 5.6
CMA / ARV
- ARV (median comp)
- $194,443
- List price
- $169,000
- Delta
- -13.08%
- Verdict
- UNDERPRICED
- Comps
- 8 within 1.0 mi
Show comp detail 1 sale within ~0.75 mi
| Address | Dist | Beds/Ba | Sqft | Sold | Price | $/sf | Match |
|---|---|---|---|---|---|---|---|
| 808 W Ashland Ave | 0.21mi | 2/1.0 (-1) | 714 (+0%) | 17mo | $205,000 | $287 | 71 |
Match score weights: distance 35% · size 25% · config 20% · recency 20%. Top-matched comps best support the ARV.
Projected returns pro-forma
-3.0% appreciation · 3.0% rent growth · sell at horizon
- IRR
- 5.5%
- Equity multiple
- 1.22×
- Total profit
- $10,197
- Equity at exit
- $25,198
- IRR
- 15.0%
- Equity multiple
- 2.22×
- Total profit
- $57,751
- Equity at exit
- $14,612
Cash invested: $47,320 (down + closing). Projections, not guarantees.
Landlord ↔ Tenant lean methodology
- Overall (STATE)
- 21 Tenant-Leaning
- State New Jersey
- 21 Tenant-Leaning · D+6
- County
- — inherits STATE
- City
- — inherits STATE
ZIP-level market 08232
- Home prices YoY
- -17.3%
- Active inventory
- 83
- Price-to-rent
- 5.6×
Monthly cashflow live
- Estimated rent
- $2,500 medium interval (Pro) →
- Mortgage (P&I)
- −$886
- Tax from tax record
- −$431 /mo · $5,172/yr
- Insurance
- −$70
- HOA
- −$0
- Vacancy / Maint / Mgmt
- −$525
- Net cashflow
- $587
Break-even live
Sensitivity live
| Price | -10% $683 | -5% $635 | +0% $587 | +5% $540 | +10% $492 |
|---|---|---|---|---|---|
| Rent | -10% $390 | -5% $489 | +0% $587 | +5% $686 | +10% $785 |
| Rate | -1.0pp $672 | -0.5pp $630 | base $587 | +0.5pp $544 | +1.0pp $499 |
UW: 25.0% down · 7.5% · 30yr · 1.5% tax · 5.0% vac · 8.0% maint · 8.0% mgmt
Financing live
Cash to close
- Down payment
- $42,250
- Closing costs
- $5,070
- Reserves months
- —
- Total cash needed
- —
Loan-product check · same deal, 3 products live
Conventional
25% down · 7.5% · 30yr
- Down + closing
- —
- Monthly P&I
- —
- Monthly cashflow
- —
- DSCR
- —
- Eligible?
- —
Personal DTI + credit; lowest rate.
DSCR
20% down · 8.5% · 30yr
- Down + closing
- —
- Monthly P&I
- —
- Monthly cashflow
- —
- DSCR
- —
- Eligible?
- —
No personal income docs; deal must DSCR.
Hard money
10% down · 12.0% · 12mo
- Down + closing
- —
- Monthly P&I
- —
- Monthly cashflow
- —
- DSCR
- —
- Eligible?
- —
Short-term bridge; refi at stabilization.
Rent comps 1 comps
| Address | Beds | Baths | Sqft | Rent | $/sqft | DOM | Units | Dist |
|---|---|---|---|---|---|---|---|---|
| 134 W Ridgewood Ave Pleasantville, NJ | 1.0–3.0 | 1.0–1.5 | 905 | $2,500 | $2.76 | 22d | 1 | 0.76mi |
Listing history 30 events
-
2026-06-22days on market $169,000 Active 40 DOM
-
2026-06-19days on market $169,000 Active 38 DOM
-
2026-06-18days on market $169,000 Active 37 DOM
-
2026-06-17days on market $169,000 Active 36 DOM
-
2026-06-16days on market $169,000 Active 35 DOM
-
2026-06-15days on market $169,000 Active 34 DOM
-
2026-06-14days on market $169,000 Active 32 DOM
-
2026-06-13days on market $169,000 Active 31 DOM
-
2026-06-10days on market $169,000 Active 29 DOM
-
2026-06-09days on market $169,000 Active 28 DOM
-
2026-06-08days on market $169,000 Active 27 DOM
-
2026-06-07days on market $169,000 Active 26 DOM
-
2026-06-02days on market $169,000 Active 21 DOM
-
2026-06-01days on market $169,000 Active 20 DOM
-
2026-05-31days on market $169,000 Active 19 DOM
-
2026-05-30days on market $169,000 Active 18 DOM
-
2026-05-12$169,000 Active 227-char remark
-
2017-01-01historical 182-char remark
Show marketing remark (182 chars)
Cottage with 2 bedroom, 1 bath, electric heat, Pergo vinyl flooring, vinyl replacement windows. Adjacent lot available with the house. Previously rented for $550/month. Easy to show.
-
2016-07-11$54,900 Active 182-char remark
Show marketing remark (182 chars)
Cottage with 2 bedroom, 1 bath, electric heat, Pergo vinyl flooring, vinyl replacement windows. Adjacent lot available with the house. Previously rented for $550/month. Easy to show.
-
2007-02-06soldstatus $90,000
-
2005-03-17soldstatus $90,000
-
2005-03-17soldstatus $90,000
-
2005-03-17soldstatus $90,000
-
2005-03-17soldstatus $90,000
-
2005-03-17soldstatus $90,000
-
2005-03-17soldstatus $1
-
2005-03-17soldstatus $1
-
2005-03-17soldstatus $1
-
2005-03-17soldstatus $1
-
2005-03-17soldstatus $1
ⓘ Source: listings_history table (triggers on properties + properties_extension) + one-shot
backfill from property_details.listing_events for pre-trigger history.
Tax reassessment forecast NJ · Partial reset (capped growth)
- Current annual tax
- $5,172 · $431/mo
- Projected year-2 tax
- $5,172 · $431/mo
- Expected delta
- $0/yr ($0/mo · 0.0%)
ⓘ Screening estimate from a state-policy table — verify with the county assessor before closing.
Climate risk First Street
- Flood 1/10 Low 0% chance over 30 yrs
- Wildfire 4/10 Moderate
- Heat 8/10 Severe 7 d/yr ≥97°F today · 16 d/yr by 30 yrs out
- Wind 8/10 Severe 80% chance of damaging wind over 30 yrs
- Air quality 2/10 Low 2 unhealthy d/yr today · 2 by 30 yrs out
Nearby sold comps map
Loading sold comps map…
Walkable amenities ~0.75 mi
Loading nearby amenities…
Taxation est. · year 1
- Rental income
- $30,000
- − Mortgage interest
- −$9,467
- − Property taxes
- −$5,172
- − Insurance
- −$845
- − Repairs & maintenance
- −$2,400
- − Management
- −$2,400
- − Depreciation
- −$4,916
- Taxable income
- $4,800
- Est. tax owed @ 24.0%
- −$1,152
- After-tax cash flow
- $5,896/yr
For passive investors: Depreciation is non-cash, so a rental often shows a tax loss while cash-flowing — sheltering income. Rental losses are passive: they offset passive income freely, and up to $25,000/yr can offset ordinary (W-2) income if you actively participate and your MAGI is under $100k (phasing out to $0 by $150k); unused losses carry forward. On sale, claimed depreciation is recaptured at up to 25%, and gains may owe capital-gains tax (a 1031 exchange can defer both). Figures are a year-1 estimate at your 24.0% rate — not tax advice; consult a CPA.
Schools (NCES district)
- District
- Pleasantville Public School District
- NCES district ID
- 3413200
- Math proficiency
- 6% ▼ -11.00%
- Reading proficiency
- 28% ▲ 1.00%
- Median HH income
- $39,569
- Composite
- 14.34/100
- National rank
- #9440
- State rank
- #451 of 472 in NJ
Livability — Pleasantville
- Score
- 73/100
- State rank
- #194
- US rank
- #5487
Category grades
Schools grade is shown separately in the Schools card above.
Census & demographics
- Census place
- Pleasantville, NJ
- Population (ZIP)
- 20,200
Population outlook (Atlantic County) Hauer SSP2
- Today (2025)
- 268,948 people
- By 2030
- 264,497 · -1.7%
- By 2040
- 252,261 · -6.2%
- By 2050
- 237,846 · -11.6%
- By 2075
- 210,650 · -21.7%
- By 2100
- 180,234 · -33.0%
Race, ethnicity, and origin ACS 2023
- Neighborhood character
- Diverse neighborhood (Simpson 0.61)
- Race & ethnicity
- Hispanic / Latino 52% Black 33% Two or more races 22% White 6% Asian 3%
- Hispanic origin (detail)
- Mexican 15% Puerto Rican 12% Dominican 14%
- Common ancestry
- Hispanic 1%
- Foreign-born
- 30% · Canada, Jamaica, Vietnam
- Languages at home
- 44% English-only · Spanish 48% French/Haitian/Cajun 5% Other Indo-European 1%
Political lean MEDSL · Atlantic
- 2024 margin
- Toss-up / Even · D 47.7% · R 50.7% · Other 1.6%
- 2008→2024 swing
- -18.1pp toward R · 2008: 15.1pp · 2024: -3.0pp
- All cycles
- 2024: R+3.0 2020: D+6.7 2016: D+6.2 2012: D+17.2 2008: D+15.1
Not yet ingested
- Civics
- —
Market trends
- HPI YoY
- ▼ -72.51%
- Current HPI
- 346.2085
- Rent YoY
- —
- Metro
- —
- State GDP YoY
- ▲ 2.05%
- F500 in state
- 34
Industry mix (Fortune 500 HQ in NJ)
| Industry | F500 HQs | Revenue |
|---|---|---|
| Consumer Goods | 3 | $31B |
|
||
| Pharmaceuticals | 2 | $153B |
|
||
| Technology | 2 | $21B |
|
||
| Insurance | 2 | $20B |
|
||
| Healthcare | 2 | $19B |
|
||
| Financial Services | 1 | $70B |
|
||
Price history
+87.8% since first listed14 events — show timeline
- 2026-05-12 Listed $169,000 SJSRMLS
- 2017-01-01 Listing Removed — SJSRMLS
- 2016-07-11 Listed $54,900 SJSRMLS
- 2007-02-06 Sold (Public Records) $90,000 Public Records
- 2005-03-17 Sold (Public Records) $1 Public Records
- 2005-03-17 Sold (Public Records) $1 Public Records
- 2005-03-17 Sold (Public Records) $1 Public Records
- 2005-03-17 Sold (Public Records) $1 Public Records
- 2005-03-17 Sold (Public Records) $1 Public Records
- 2005-03-17 Sold (Public Records) $90,000 Public Records
- 2005-03-17 Sold (Public Records) $90,000 Public Records
- 2005-03-17 Sold (Public Records) $90,000 Public Records
- 2005-03-17 Sold (Public Records) $90,000 Public Records
- 2005-03-17 Sold (Public Records) $90,000 Public Records
Property tax history
+1.8%/yrLatest (2025): $5,172 · +3.1% YoY. Source: county tax records.
Cash-flow waterfall
monthlySold comps — $/sqft
last 12 mo · ≤1 miLoading sold comps…