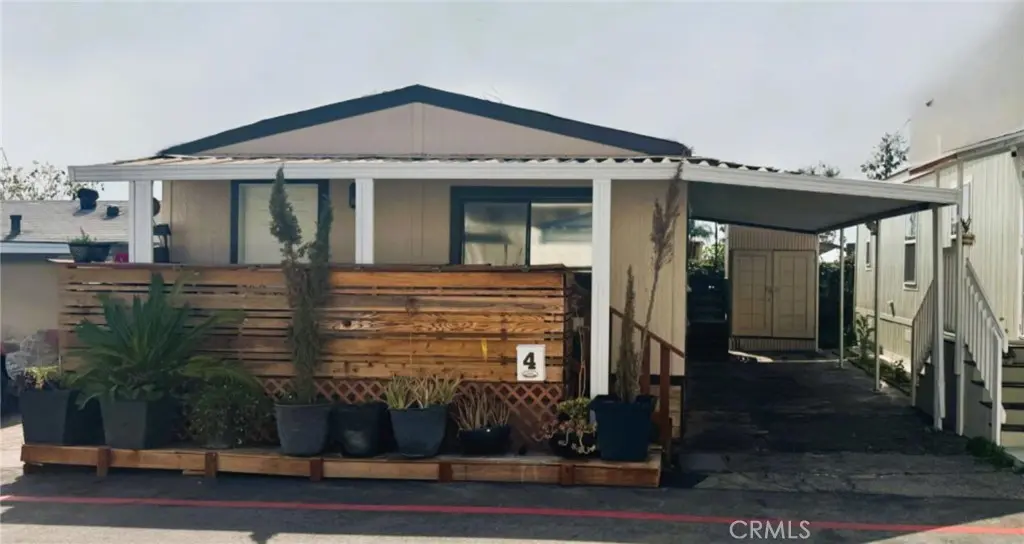
732 E Route 66 #4 · Glendora, CA
Flood risk 4/10 · Minor
- FEMA flood zone
- X (unshaded)
- Chance of flooding over 30 yrs
- 0.22%
- Est. flood insurance / yr
- $507 – $1,088
Fire risk 7/10 · Major
- Est. fire insurance / yr
- $659 – $1,223
Heat risk 7/10 · Major
- Hot days now (above 98°F)
- 7 days/yr
- Hot days in 30 yrs
- 20 days/yr
Wind risk 1/10 · Minimal
- Chance of severe wind over 30 yrs
- —
Air-quality risk 7/10 · Major
- Unhealthy air days now
- 15 days/yr
- Unhealthy air days in 30 yrs
- 17 days/yr
Risk factors via First Street. Map © Google.
Why this score? — see what drove the B- grade
The composite is a weighted blend of 9 inputs, each scored 0–100. Each bar is that input's sub-score; the figure is the points it added to the 100-point composite (weight × sub-score).
- Cash flow +30.0/30.0
- 1% rule +10.0/10.0
- DSCR +10.0/10.0
- Schools +6.6/10.0
- Livability +3.2/5.0
- Rent growth +3.1/5.0
- Condition / age +2.5/5.0
- ARV discount +1.9/15.0
- Appreciation +0.0/10.0
$135,000
🖨 Deal sheet 📄 Offer letter ✓ Due diligence
Listing remarks MLS
Beautifully renovated mobile home located in a desirable community. Bathrooms and Kitchen have been updated. Hardwood and engineered wood flooring throughout. This home is ready for and your family to enjoy! Western Skies Home Park in conveniently located, close to award winning schools, shopping centers, public transportation, freeways and so much more. Gold Line Metro connects from Pomona to Downtown LA. This home offers style, comfort and ease.
Key facts
- New flooring
- Updated bathrooms
- Updated kitchen
Tags
Neighborhood map
What this means for you Summary
Snapshot
- This is a 2-bed/2.0-bath manufactured listed at $135k.
Deal economics
- At list price, monthly cash flow is $898 ($11k/yr) — positive.
- The deal already cash-flows at list — no discount required.
- Meets the 1% rule at list price ($2k rent vs $135k).
- Recommended offer: $119k (12.0% below list) — sets the bar for market timing.
- Cap rate 14.3% vs local median 2.4% in Glendora — top-decile yield for the area; either an underpriced asset or a hidden risk that comps aren't pricing in. Stress-test before assuming the spread holds.
Location & tenants
- Location reads 65/100 on livability (#373 in CA) — a middle-class / working-renter tenant base. Strengths: commute A+, employment A+, schools B; Watch: amenities F, cost of living F, health & safety F.
- Glendora Unified (suburban): math 75% / reading 75% proficiency, ranked #36 of 517 in CA (top 7%) — strong family-tenant draw, lease renewals of 3-5y typical; only 19% free/reduced lunch — higher-income household profile.
- Market conditions: Rents rising (+2.6%/yr); 52 active listings in the ZIP; 12 comparable units currently listed for rent nearby; rentals lingering (median 44d on market — plan ~5-8 weeks vacancy on turnover, expect pricing pressure); 50% of comp listings sitting > 30 days — soft ceiling on asking rent; solid renter incomes; 19,697 units permitted in Los Angeles County in 2024 (9,426 in 5+ unit buildings).
Forward outlook
- Local home prices are declining (-3.0%/yr); year-one equity from $933 of loan paydown is wiped out by about $4k of value loss. Plan a longer hold.
- Los Angeles County population projected at +9% by 2050 — modest demand growth; plan on rents tracking national, not racing it.
- At projected returns (-3.0% appreciation + 2.6% rent growth), your $38k cash investment doubles in ~5 years — after that, you're playing with house money.
Negotiation context
- It's been on market 185 days — a 12% lower offer ($119k) is reasonable based on typical stale-listing flexibility.
- 4 sale attempts since 17y ago; this cycle's ask has dropped $40k (23%) from the opening price — seller is motivated, your offer sets the floor, not the list.
Risks & watch-outs
- Climate carrying-cost: major wildfire risk; extreme-heat days projected 7→20/yr by 2055 (HVAC capex compounding) — expect insurance premiums to compound above CPI over the hold.
Questions for the listing agent
- It's been on market 185 days. Have you received any prior offers? Is the seller open to a 12% concession, seller financing, or rate buy-down credit?
- Why hasn't it sold? Are there any deal-killer items the seller is aware of (foundation, flood, title, zoning, code violations)?
- Is there a deadline driving the sale (1031 exchange, divorce, estate, relocation)? That informs how much negotiation room exists.
- Schools are B-rated — typically a magnet for longer-tenancy family renters. What's the average tenant stay here, and is there a school-zone premium baked into asking?
- What's the average days-on-market for RENTAL listings here right now (not sales)? A rising rental-DOM trend means longer vacancies and softer asking-rent achievability than the comps imply.
- What's the recent tenant-quality profile in this submarket — average credit score on applications, eviction rate, late-payment / NSF rate, and stable-employment percentage? A property-management company in the area should have these aggregated.
- How much new for-sale + rental construction is in the pipeline within 1–3 miles? Heavy new supply typically softens prices + rents 12–24 months out; constrained supply supports both.
Investment metrics
- 1% rule
- 1.58% ✓
- Cap rate
- 14.27%
- Cash-on-cash
- 28.50%
- DSCR
- 2.27
- GRM
- 5.3
CMA / ARV
- ARV (median comp)
- $120,000
- List price
- $135,000
- Delta
- 12.50%
- Verdict
- OVERPRICED
- Comps
- 3 within 1.0 mi
Show comp detail 3 sales within ~0.75 mi
| Address | Dist | Beds/Ba | Sqft | Sold | Price | $/sf | Match |
|---|---|---|---|---|---|---|---|
| 826 E Route 66 | 0.14mi | 2/1.0 | 672 (-7%) | 2mo | $92,000 | $137 | 77 |
| 826 E Route 66 #16 | 0.14mi | 2/1.0 | 728 (+1%) | 13mo | $100,000 | $137 | 77 |
| 732 E Route 66 #13 | 0.00mi | 2/1.0 | 784 (+9%) | 17mo | $129,000 | $165 | 67 |
Match score weights: distance 35% · size 25% · config 20% · recency 20%. Top-matched comps best support the ARV.
Projected returns pro-forma
-3.0% appreciation · 2.59% rent growth · sell at horizon
- IRR
- 22.3%
- Equity multiple
- 1.91×
- Total profit
- $34,365
- Equity at exit
- $20,129
- IRR
- 30.1%
- Equity multiple
- 3.64×
- Total profit
- $99,747
- Equity at exit
- $11,672
Cash invested: $37,800 (down + closing). Projections, not guarantees.
Landlord ↔ Tenant lean methodology
- Overall (STATE)
- 18 Strongly Tenant-Friendly
- State California
- 18 Strongly Tenant-Friendly · D+13
- County
- — inherits STATE
- City
- — inherits STATE
ZIP-level market 91740
- Rents YoY
- 2.6%
- Active inventory
- 52
- Price-to-rent
- 5.3×
Monthly cashflow live
- Estimated rent
- $2,135 high interval (Pro) →
- Mortgage (P&I)
- −$708
- Tax from tax record
- −$25 /mo · $295/yr
- Insurance
- −$56
- HOA
- −$0
- Vacancy / Maint / Mgmt
- −$448
- Net cashflow
- $898
Break-even live
UW: 25.0% down · 7.5% · 30yr · 1.5% tax · 5.0% vac · 8.0% maint · 8.0% mgmt
Financing live
Cash to close
- Down payment
- $33,750
- Closing costs
- $4,050
- Reserves months
- —
- Total cash needed
- —
Loan-product check · same deal, 3 products live
Conventional
25% down · 7.5% · 30yr
- Down + closing
- —
- Monthly P&I
- —
- Monthly cashflow
- —
- DSCR
- —
- Eligible?
- —
Personal DTI + credit; lowest rate.
DSCR
20% down · 8.5% · 30yr
- Down + closing
- —
- Monthly P&I
- —
- Monthly cashflow
- —
- DSCR
- —
- Eligible?
- —
No personal income docs; deal must DSCR.
Hard money
10% down · 12.0% · 12mo
- Down + closing
- —
- Monthly P&I
- —
- Monthly cashflow
- —
- DSCR
- —
- Eligible?
- —
Short-term bridge; refi at stabilization.
Rent comps 12 comps
| Address | Beds | Baths | Sqft | Rent | $/sqft | DOM | Units | Dist |
|---|---|---|---|---|---|---|---|---|
| 642 Lemar Park Dr Unit 4 Glendora, CA | 1.0 | 1.0 | 680 | $2,000 | $2.94 | 43d | 1 | 0.14mi |
| 921 East Route 66 Unit 935 Glendora, CA | 1.0 | 1.0 | 650 | $1,895 | $2.92 | 43d | 1 | 0.27mi |
| 935 East Route 66 Glendora, CA | 1.0 | 1.0 | 650 | $1,895 | $2.92 | 43d | 1 | 0.27mi |
| 1000 S Glendora Ave Glendora, CA | 1.0 | 1.0 | 551 | $1,820 | $3.30 | 1d | 1 | 0.61mi |
| 306 E Meda Ave Unit 306-H Glendora, CA | 1.0 | 1.0 | 650 | $1,950 | $3.00 | 43d | 1 | 0.85mi |
| 506 Parker Dr Unit 506 05 Glendora, CA | 1.0 | 1.0 | 552 | $1,795 | $3.25 | 10d | 1 | 0.97mi |
| 121 East Route 66 Glendora, CA | 3.0 | 1.0–2.0 | 1030 | $3,015 | $2.93 | 1d | 1 | 1.06mi |
| 640 Invergarry St Glendora, CA | 1.0 | 1.0 | 500 | $1,750 | $3.50 | 21d | 1 | 1.22mi |
| 618 W Rte 66 Glendora, CA | 1.0 | 1.0 | 497 | $1,950 | $3.92 | 18d | 2 | 1.22mi |
| 633 W Rte 66 Glendora, CA | 1.0 | 1.0 | 716 | $2,295 | $3.21 | 43d | 1 | 1.24mi |
| 711 Claraday St Unit A Glendora, CA | 2.0 | 1.0 | 750 | $2,250 | $3.00 | 43d | 1 | 1.38mi |
| 440 W Gladstone St Glendora, CA | 1.0–2.0 | 1.0–2.0 | 875 | $2,390 | $2.73 | 1d | 9 | 1.43mi |
Listing history 26 events
-
2026-06-18days on market $135,000 Active 185 DOM
-
2026-06-17days on market $135,000 Active 184 DOM
-
2026-06-16days on market $135,000 Active 183 DOM
-
2026-06-15days on market $135,000 Active 182 DOM
-
2026-06-13days on market $135,000 Active 180 DOM
-
2026-06-09days on market $135,000 Active 176 DOM
-
2026-06-08days on market $135,000 Active 175 DOM
-
2026-06-07days on market $135,000 Active 174 DOM
-
2026-06-04days on market $135,000 Active 172 DOM
-
2026-06-03days on market $135,000 Active 171 DOM
-
2026-06-02days on market $135,000 Active 170 DOM
-
2026-06-01days on market $135,000 Active 169 DOM
-
2026-05-31days on market $135,000 Active 168 DOM
-
2026-05-11price $125,000 451-char remark
Show marketing remark (451 chars)
Beautifully renovated mobile home located in a desirable community. Bathrooms and Kitchen have been updated. Hardwood and engineered wood flooring throughout. This home is ready for and your family to enjoy! Western Skies Home Park in conveniently located, close to award winning schools, shopping centers, public transportation, freeways and so much more. Gold Line Metro connects from Pomona to Downtown LA. This home offers style, comfort and ease.
-
2026-04-23price $145,000 451-char remark
Show marketing remark (451 chars)
Beautifully renovated mobile home located in a desirable community. Bathrooms and Kitchen have been updated. Hardwood and engineered wood flooring throughout. This home is ready for and your family to enjoy! Western Skies Home Park in conveniently located, close to award winning schools, shopping centers, public transportation, freeways and so much more. Gold Line Metro connects from Pomona to Downtown LA. This home offers style, comfort and ease.
-
2026-03-11price $155,000 451-char remark
Show marketing remark (451 chars)
Beautifully renovated mobile home located in a desirable community. Bathrooms and Kitchen have been updated. Hardwood and engineered wood flooring throughout. This home is ready for and your family to enjoy! Western Skies Home Park in conveniently located, close to award winning schools, shopping centers, public transportation, freeways and so much more. Gold Line Metro connects from Pomona to Downtown LA. This home offers style, comfort and ease.
-
2026-02-20price $160,000 451-char remark
Show marketing remark (451 chars)
Beautifully renovated mobile home located in a desirable community. Bathrooms and Kitchen have been updated. Hardwood and engineered wood flooring throughout. This home is ready for and your family to enjoy! Western Skies Home Park in conveniently located, close to award winning schools, shopping centers, public transportation, freeways and so much more. Gold Line Metro connects from Pomona to Downtown LA. This home offers style, comfort and ease.
-
2026-02-17price $168,000 451-char remark
Show marketing remark (451 chars)
Beautifully renovated mobile home located in a desirable community. Bathrooms and Kitchen have been updated. Hardwood and engineered wood flooring throughout. This home is ready for and your family to enjoy! Western Skies Home Park in conveniently located, close to award winning schools, shopping centers, public transportation, freeways and so much more. Gold Line Metro connects from Pomona to Downtown LA. This home offers style, comfort and ease.
-
2025-12-12$175,000 Active 451-char remark
Show marketing remark (451 chars)
Beautifully renovated mobile home located in a desirable community. Bathrooms and Kitchen have been updated. Hardwood and engineered wood flooring throughout. This home is ready for and your family to enjoy! Western Skies Home Park in conveniently located, close to award winning schools, shopping centers, public transportation, freeways and so much more. Gold Line Metro connects from Pomona to Downtown LA. This home offers style, comfort and ease.
-
2025-11-28historical
-
2025-07-23price $175,000
-
2025-05-05$185,000 Active
-
2013-05-15historical
-
2012-07-19$39,950 Active
-
2009-06-18historical
-
2009-04-01$39,000
ⓘ Source: listings_history table (triggers on properties + properties_extension) + one-shot
backfill from property_details.listing_events for pre-trigger history.
Tax reassessment forecast CA · Resets to sale price
- Current annual tax
- $295 · $25/mo
- Projected year-2 tax
- $1,026 · $86/mo
- Expected delta
- +$731/yr (+$61/mo · 248.1%)
ⓘ Screening estimate from a state-policy table — verify with the county assessor before closing.
Climate risk First Street
- Flood 4/10 Moderate FEMA zone X (unshaded) · 22% chance over 30 yrs
- Wildfire 7/10 Severe
- Heat 7/10 Severe 7 d/yr ≥98°F today · 20 d/yr by 30 yrs out
- Wind 1/10 Low
- Air quality 7/10 Severe 15 unhealthy d/yr today · 17 by 30 yrs out
Nearby sold comps map
Loading sold comps map…
Walkable amenities ~0.75 mi
Loading nearby amenities…
Taxation est. · year 1
- Rental income
- $25,617
- − Mortgage interest
- −$7,562
- − Property taxes
- −$295
- − Insurance
- −$675
- − Repairs & maintenance
- −$2,049
- − Management
- −$2,049
- − Depreciation
- −$3,927
- Taxable income
- $9,059
- Est. tax owed @ 24.0%
- −$2,174
- After-tax cash flow
- $8,598/yr
For passive investors: Depreciation is non-cash, so a rental often shows a tax loss while cash-flowing — sheltering income. Rental losses are passive: they offset passive income freely, and up to $25,000/yr can offset ordinary (W-2) income if you actively participate and your MAGI is under $100k (phasing out to $0 by $150k); unused losses carry forward. On sale, claimed depreciation is recaptured at up to 25%, and gains may owe capital-gains tax (a 1031 exchange can defer both). Figures are a year-1 estimate at your 24.0% rate — not tax advice; consult a CPA.
Schools (NCES district)
- District
- Glendora Unified
- NCES district ID
- 0615270
- Math proficiency
- 75% ▲ 16.00%
- Reading proficiency
- 75% ▲ 8.00%
- Median HH income
- $80,253
- Composite
- 66.41/100
- National rank
- #421
- State rank
- #36 of 517 in CA
Livability — Glendora
- Score
- 65/100
- State rank
- #373
- US rank
- #12710
Category grades
Schools grade is shown separately in the Schools card above.
Census & demographics
- Census place
- Glendora, CA
- County
- Los Angeles County · 9,444,647 people
- City population
- 52,239
- Metro
- Los Angeles-Long Beach-Anaheim, CA
- Population (ZIP)
- 26,168
- Household income
- $99,083
- Rent vs Own
- Severe rent burden
- 1034.0
Population outlook (Los Angeles County) Hauer SSP2
- Today (2025)
- 10,940,515 people
- By 2030
- 11,256,481 · +2.9%
- By 2040
- 11,729,929 · +7.2%
- By 2050
- 11,948,407 · +9.2%
- By 2075
- 11,818,114 · +8.0%
- By 2100
- 10,842,928 · -0.9%
Race, ethnicity, and origin ACS 2023
- Neighborhood character
- Diverse neighborhood (Simpson 0.64)
- Race & ethnicity
- Hispanic / Latino 49% White 33% Two or more races 21% Asian 10% Black 3% Native American 1%
- Hispanic origin (detail)
- Mexican 37% Cuban 1%
- Common ancestry
- Lithuanian 1% Portuguese 1% Romanian 1%
- Foreign-born
- 22% · Canada, China, Vietnam
- Languages at home
- 63% English-only · Spanish 24% Chinese 4% Arabic 3%
Political lean MEDSL · Los Angeles
- 2024 margin
- Solid D (+32.9) · D 64.8% · R 31.9% · Other 3.3%
- 2008→2024 swing
- -7.4pp toward R · 2008: 40.4pp · 2024: 32.9pp
- All cycles
- 2024: D+32.9 2020: D+44.2 2016: D+48.0 2012: D+40.0 2008: D+40.4
Not yet ingested
- Civics
- —
Market trends
- HPI YoY
- ▼ -847.76%
- Current HPI
- 378.3547
- Rent YoY
- ▲ 2.59%
- Metro
- Los Angeles-Long Beach-Anaheim, CA
- State GDP YoY
- ▲ 3.21%
- F500 in state
- 116
Industry mix (Fortune 500 HQ in CA)
| Industry | F500 HQs | Revenue |
|---|---|---|
| Technology | 27 | $1,492B |
|
||
| Financial Services | 3 | $174B |
|
||
| Retail | 3 | $44B |
|
||
| Insurance | 3 | $26B |
|
||
| Media / Entertainment | 2 | $115B |
|
||
| Pharmaceuticals / Biotech | 2 | $62B |
|
||
Price history
+220.5% since first listed13 events — show timeline
- 2026-05-11 Price Changed $125,000 CRMLS
- 2026-04-23 Price Changed $145,000 CRMLS
- 2026-03-11 Price Changed $155,000 CRMLS
- 2026-02-20 Price Changed $160,000 CRMLS
- 2026-02-17 Price Changed $168,000 CRMLS
- 2025-12-12 Listed $175,000 CRMLS
- 2025-11-28 Listing Removed — CRMLS
- 2025-07-23 Price Changed $175,000 CRMLS
- 2025-05-05 Listed $185,000 CRMLS
- 2013-05-15 Listing Removed — CRMLS
- 2012-07-19 Listed $39,950 CRMLS
- 2009-06-18 Listing Removed — CRMLS
- 2009-04-01 Listed $39,000 CRMLS
Property tax history
+6.2%/yrLatest (2025): $295 · +6.2% YoY. Source: county tax records.
Cash-flow waterfall
monthlySold comps — $/sqft
last 12 mo · ≤1 miLoading sold comps…