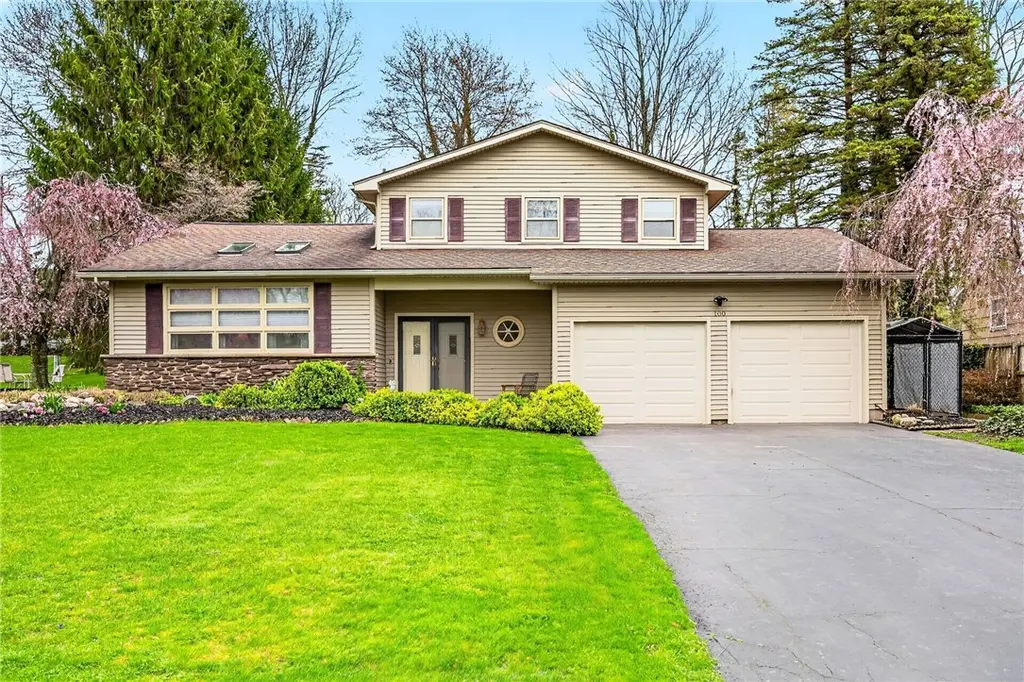
100 Gordon Dr · Greece, NY
Flood risk 1/10 · Minimal
- FEMA flood zone
- X (unshaded)
- Chance of flooding over 30 yrs
- 0.0%
- Est. flood insurance / yr
- $473 – $860
Fire risk 1/10 · Minimal
- Est. fire insurance / yr
- $691 – $1,283
Heat risk 2/10 · Minimal
- Hot days now (above 95°F)
- 7 days/yr
- Hot days in 30 yrs
- 15 days/yr
Wind risk 1/10 · Minimal
- Chance of severe wind over 30 yrs
- —
Air-quality risk 2/10 · Minimal
- Unhealthy air days now
- 1 days/yr
- Unhealthy air days in 30 yrs
- 2 days/yr
Risk factors via First Street. Map © Google.
Why this score? — see what drove the D+ grade
The composite is a weighted blend of 9 inputs, each scored 0–100. Each bar is that input's sub-score; the figure is the points it added to the 100-point composite (weight × sub-score).
- ARV discount +15.0/15.0
- Cash flow +12.8/30.0
- 1% rule +5.5/10.0
- Livability +4.0/5.0
- DSCR +3.8/10.0
- Schools +3.2/10.0
- Rent growth +3.1/5.0
- Condition / age +2.5/5.0
- Appreciation +0.0/10.0
$220,000
🖨 Deal sheet (PDF) 📄 Offer letter ✓ Due diligence
Listing remarks
Welcome to this beautifully maintained split-level home in the Greece School District! Nestled on a gorgeously landscaped lot, this home is filled with natural light, large windows in every room, and charming architectural details that make it truly stand out. Step inside to a bright and cheerful interior featuring hardwood floors, rustic wood beams, skylights, and a stunning vaulted ceiling in the living room/bonus space—creating an airy, open feel that’s perfect for both relaxing and entertaining. The cozy family room with a stacked stone wood-burning fireplace offers the perfect place to unwind, with french doors leading directly to your private backyard oasis. Outside, enjoy
Key facts
- Large windows
- Rustic wood beams
- Landscaped lot
Tags
Property features AI
Exterior
- Parking: Attached garage; 2-car garage
- Utilities: Electricity connected; Public water connected; Sewer connected
- Home design: Single-story home; Vinyl siding; Existing/resale property
- Construction: Block foundation
- Exterior features: Deck; Patio; Porch; Fully fenced yard; Blacktop driveway; Rectangular residential lot; City street frontage
Interior
- Kitchen: Dishwasher; Gas oven; Gas range; Refrigerator; Eat-in kitchen
- Bedrooms: Total of 9 rooms (includes laundry, bonus room, entry foyer)
- Flooring: Carpet; Ceramic tile; Hardwood; Varied flooring
- Bathrooms: 1 full bathroom; 1 half bathroom; 1 main-level bathroom
- Heating & cooling: Gas heating; Hot water heat; Zoned heating and cooling
- Interior features: Entrance foyer; Eat-in kitchen; Partial, partially finished basement; One fireplace
- Laundry & utility: Washer; Dryer; Main-level laundry
Neighborhood map
What this means for you Summary
Snapshot
- This is a 3-bed/1.5-bath single-family listed at $220k.
Deal economics
- At list price, monthly cash flow is $-20 ($-241/yr) — negative.
- To cash-flow at today's rent, offer at most $216k (1.6% below list).
- Meets the 1% rule at list price ($2k rent vs $220k).
- Recommended offer: $216k (1.6% below list) — sets the bar for cash-flow.
- Cap rate 6.2% vs local median 3.7% in Greece — top-decile yield for the area; either an underpriced asset or a hidden risk that comps aren't pricing in. Stress-test before assuming the spread holds.
Location & tenants
- Location reads 79/100 on livability (#145 in NY, #2,223 nationally) — a middle-class / working-renter tenant base. Strengths: commute A+, housing A+, health & safety A+; Watch: schools D-, crime D-.
- Greece Central School District (suburban): math 35% / reading 39% proficiency, ranked #544 of 590 in NY (top 92%) — families likely to look elsewhere, expect single-tenant / working-renter base with shorter leases.
- Market conditions: Rents rising (+2.5%/yr); 129 active listings in the ZIP; 2 comparable units currently listed for rent nearby; solid renter incomes; 1,169 units permitted in Monroe County in 2024 (591 in 5+ unit buildings).
- This rent runs 35% of the median local income ($78k/yr) — at the standard rent-burdened threshold; future hikes will face affordability resistance.
Forward outlook
- Local home prices are declining (-3.0%/yr); year-one equity from $2k of loan paydown is wiped out by about $7k of value loss. Plan a longer hold.
- Monroe County population projected to shrink 6% by 2050 — rents likely to lag national; underwrite the cash flow, not the appreciation.
Negotiation context
- Only 8 days on market — expect competitive offers; lowballing is unlikely to land.
- Current owner paid $138k; list at $220k implies a 59% gain — meaningful room to come down on a strong offer.
Risks & watch-outs
- Watch-outs: property tax is 3.3% of price.
Questions for the listing agent
- What do current leases actually rent for vs. the listed asking? Can we see a recent rent roll and the last 12 months of T-12 income?
- Built in 1961 — when were the roof, HVAC, electrical panel, plumbing, and water heater last replaced?
- Property tax is high relative to price — has the assessment been appealed recently, and will the sale trigger a re-assessment?
- Is there a deadline driving the sale (1031 exchange, divorce, estate, relocation)? That informs how much negotiation room exists.
- Schools are D-rated, which usually means shorter tenancies and higher turnover. Who's the typical renter profile here, and what's been the actual vacancy rate?
- Crime grade is D in this area — have there been break-ins, vandalism, or insurance claims at this property in the last 3 years? What carrier currently insures it and at what premium?
- The area grade is low — what's the realistic commute time and amenity access for the typical tenant pool here? Any planned neighborhood developments (good or bad) we should know about?
- What's the average days-on-market for RENTAL listings here right now (not sales)? A rising rental-DOM trend means longer vacancies and softer asking-rent achievability than the comps imply.
- What's the recent tenant-quality profile in this submarket — average credit score on applications, eviction rate, late-payment / NSF rate, and stable-employment percentage? A property-management company in the area should have these aggregated.
- How much new for-sale + rental construction is in the pipeline within 1–3 miles? Heavy new supply typically softens prices + rents 12–24 months out; constrained supply supports both.
Investment metrics
- 1% rule
- 1.05% ✓
- Cap rate
- 6.18%
- Cash-on-cash
- -0.39%
- DSCR
- 0.98
- GRM
- 8.0
CMA / ARV
- ARV (on-the-fly)
- $286,440
- Comps found
- 12
Show comp detail 12 sales within ~0.75 mi
| Address | Dist | Beds/Ba | Sqft | Sold | Price | $/sf | Match |
|---|---|---|---|---|---|---|---|
| 100 Gordon Dr | 0.00mi | 3/1.5 | 1,736 (0%) | 0mo | $295,000 | $170 | 100 |
| 146 Fiesta Rd | 0.16mi | 4/1.5 (+1) | 1,825 (+5%) | 7mo | $237,500 | $130 | 73 |
| 162 Straub Rd | 0.45mi | 3/2.5 | 1,744 (+0%) | 2mo | $375,000 | $215 | 72 |
| 215 Straub Rd | 0.39mi | 4/1.5 (+1) | 1,738 (+0%) | 7mo | $295,000 | $170 | 71 |
| 239 Southridge Dr | 0.28mi | 4/2.5 (+1) | 1,828 (+5%) | 0mo | $302,500 | $165 | 69 |
| 59 Winston Dr | 0.56mi | 3/1.5 | 1,680 (-3%) | 7mo | $221,525 | $132 | 63 |
| 64 Stone Fence Cir | 0.56mi | 3/2.5 | 1,766 (+2%) | 9mo | $336,000 | $190 | 60 |
| 250 Ridgewood Rd | 0.45mi | 4/1.5 (+1) | 1,628 (-6%) | 8mo | $240,000 | $147 | 57 |
| 22 Ridgewood Rd | 0.67mi | 3/1.5 | 1,584 (-9%) | 2mo | $247,500 | $156 | 52 |
| 25 Cherry Creek Ln | 0.64mi | 4/2.5 (+1) | 1,800 (+4%) | 5mo | $255,000 | $142 | 50 |
| 3463 W Ridge Rd | 0.63mi | 2/1.0 (-1) | 1,604 (-8%) | 3mo | $310,000 | $193 | 48 |
| 218 Ridgewood Rd | 0.47mi | 4/1.5 (+1) | 1,517 (-13%) | 9mo | $215,000 | $142 | 44 |
Match score weights: distance 35% · size 25% · config 20% · recency 20%. Top-matched comps best support the ARV.
Projected returns pro-forma
-3.0% appreciation · 2.5% rent growth · sell at horizon
- IRR
- -17.5%
- Equity multiple
- 0.39×
- Total profit
- $-37,849
- Equity at exit
- $32,803
- IRR
- -10.5%
- Equity multiple
- 0.38×
- Total profit
- $-38,350
- Equity at exit
- $19,022
Cash invested: $61,600 (down + closing). Projections, not guarantees.
Landlord ↔ Tenant lean methodology
- Overall (STATE)
- 15 Strongly Tenant-Friendly
- State New York
- 15 Strongly Tenant-Friendly · D+10
- County
- — inherits STATE
- City
- — inherits STATE
ZIP-level market 14626
- Home prices YoY
- -31.4%
- Rents YoY
- 2.5%
- Active inventory
- 129
- Price-to-rent
- 8.0×
Monthly cashflow live
- Estimated rent
- $2,305 medium interval (Pro) →
- Mortgage (P&I)
- −$1,154
- Tax from tax record
- −$596 /mo · $7,152/yr
- Insurance
- −$92
- HOA
- −$0
- Vacancy / Maint / Mgmt
- −$484
- Net cashflow
- $-20
Break-even live
Sensitivity live
| Price | -10% $104 | -5% $42 | +0% $-20 | +5% $-82 | +10% $-145 |
|---|---|---|---|---|---|
| Rent | -10% $-202 | -5% $-111 | +0% $-20 | +5% $71 | +10% $162 |
| Rate | -1.0pp $91 | -0.5pp $36 | base $-20 | +0.5pp $-77 | +1.0pp $-135 |
UW: 25.0% down · 7.5% · 30yr · 1.5% tax · 5.0% vac · 8.0% maint · 8.0% mgmt
Financing live
Cash to close
- Down payment
- $55,000
- Closing costs
- $6,600
- Reserves months
- —
- Total cash needed
- —
Loan-product check · same deal, 3 products live
Conventional
25% down · 7.5% · 30yr
- Down + closing
- —
- Monthly P&I
- —
- Monthly cashflow
- —
- DSCR
- —
- Eligible?
- —
Personal DTI + credit; lowest rate.
DSCR
20% down · 8.5% · 30yr
- Down + closing
- —
- Monthly P&I
- —
- Monthly cashflow
- —
- DSCR
- —
- Eligible?
- —
No personal income docs; deal must DSCR.
Hard money
10% down · 12.0% · 12mo
- Down + closing
- —
- Monthly P&I
- —
- Monthly cashflow
- —
- DSCR
- —
- Eligible?
- —
Short-term bridge; refi at stabilization.
Rent comps 2 comps
| Address | Beds | Baths | Sqft | Rent | $/sqft | DOM | Units | Dist |
|---|---|---|---|---|---|---|---|---|
| 598 Bram Hall Dr Rochester, NY | 3.0 | 2.5 | 1740 | $2,750 | $1.58 | 4d | 1 | 1.40mi |
| 49 Lianne Dr Rochester, NY | 3.0 | 2.0 | 1281 | $2,650 | $2.07 | 4d | 1 | 1.42mi |
Listing history 3 events
-
2026-04-29status Pending
-
2026-04-21$220,000 Active
-
2005-07-19soldstatus $138,300
ⓘ Source: listings_history table (triggers on properties + properties_extension) + one-shot
backfill from property_details.listing_events for pre-trigger history.
Tax reassessment forecast NY · Partial reset (capped growth)
- Current annual tax
- $7,152 · $596/mo
- Projected year-2 tax
- $7,152 · $596/mo
- Expected delta
- $0/yr ($0/mo · 0.0%)
ⓘ Screening estimate from a state-policy table — verify with the county assessor before closing.
Climate risk First Street
- Flood 1/10 Low FEMA zone X (unshaded) · 0% chance over 30 yrs
- Wildfire 1/10 Low
- Heat 2/10 Low 7 d/yr ≥95°F today · 15 d/yr by 30 yrs out
- Wind 1/10 Low
- Air quality 2/10 Low 1 unhealthy d/yr today · 2 by 30 yrs out
Nearby sold comps map
Loading sold comps map…
Walkable amenities ~0.75 mi
Loading nearby amenities…
Taxation est. · year 1
- Rental income
- $27,666
- − Mortgage interest
- −$12,323
- − Property taxes
- −$7,152
- − Insurance
- −$1,100
- − Repairs & maintenance
- −$2,213
- − Management
- −$2,213
- − Depreciation
- −$6,400
- Taxable loss
- −$3,736
- Est. tax savings @ 24.0%
- +$897
- After-tax cash flow
- $656/yr
For passive investors: Depreciation is non-cash, so a rental often shows a tax loss while cash-flowing — sheltering income. Rental losses are passive: they offset passive income freely, and up to $25,000/yr can offset ordinary (W-2) income if you actively participate and your MAGI is under $100k (phasing out to $0 by $150k); unused losses carry forward. On sale, claimed depreciation is recaptured at up to 25%, and gains may owe capital-gains tax (a 1031 exchange can defer both). Figures are a year-1 estimate at your 24.0% rate — not tax advice; consult a CPA.
Schools (NCES district)
- District
- Greece Central School District
- NCES district ID
- 3612630
- Math proficiency
- 35% ▼ -14.00%
- Reading proficiency
- 39% ▼ -3.00%
- Median HH income
- $52,718
- Composite
- 32.26/100
- National rank
- #5761
- State rank
- #544 of 590 in NY
Livability — Greece
- Score
- 79/100
- State rank
- #145
- US rank
- #2223
Category grades
Schools grade is shown separately in the Schools card above.
Census & demographics
- Census place
- Greece, NY
- County
- Monroe County · 674,131 people
- City population
- 29,210
- Metro
- Rochester, NY
- Population (ZIP)
- 29,273
- Household income
- $78,204
- Rent vs Own
- Severe rent burden
- 810.0
Population outlook (Monroe County) Hauer SSP2
- Today (2025)
- 759,460 people
- By 2030
- 757,154 · -0.3%
- By 2040
- 740,644 · -2.5%
- By 2050
- 714,443 · -5.9%
- By 2075
- 645,883 · -15.0%
- By 2100
- 547,084 · -28.0%
Race, ethnicity, and origin ACS 2023
- Neighborhood character
- Predominantly White (77%)
- Race & ethnicity
- White 77% Black 9% Hispanic / Latino 8% Two or more races 6% Asian 3%
- Hispanic origin (detail)
- Mexican 1% Puerto Rican 5%
- Common ancestry
- Romanian 5% Lithuanian 2% Subsaharan African 2%
- Foreign-born
- 9% · Canada, Vietnam, South Korea
- Languages at home
- 89% English-only · Other Indo-European 3% Spanish 3% Russian/Polish/Slavic 1%
Political lean MEDSL · Monroe
- 2024 margin
- D (+19.1) · D 59.5% · R 40.5%
- 2008→2024 swing
- +1.4pp toward D · 2008: 17.7pp · 2024: 19.1pp
- All cycles
- 2024: D+19.1 2020: D+21.0 2016: D+14.1 2012: D+17.4 2008: D+17.7
Not yet ingested
- Civics
- —
Market trends
- HPI YoY
- ▼ -113.91%
- Current HPI
- 248.9836
- Rent YoY
- ▲ 2.50%
- Metro
- Rochester, NY
- State GDP YoY
- ▲ 2.60%
- F500 in state
- 92
Industry mix (Fortune 500 HQ in NY)
| Industry | F500 HQs | Revenue |
|---|---|---|
| Financial Services | 10 | $950B |
|
||
| Consumer Goods | 9 | $162B |
|
||
| Insurance | 4 | $225B |
|
||
| Telecommunications | 2 | $144B |
|
||
| Pharmaceuticals | 2 | $112B |
|
||
| Media / Entertainment | 2 | $69B |
|
||
Price history
+59.1% since first listed3 events — show timeline
- 2026-04-29 Pending — UNYREIS
- 2026-04-21 Listed $220,000 UNYREIS
- 2005-07-19 Sold (Public Records) $138,300 Public Records
Property tax history
+3.1%/yrLatest (2025): $7,152 · +0.5% YoY. Source: county tax records.
Cash-flow waterfall
monthlySold comps — $/sqft
last 12 mo · ≤1 miLoading sold comps…