220 De La Taix · Gumlog, GA
Flood risk 1/10 · Minimal
- FEMA flood zone
- X (unshaded)
- Chance of flooding over 30 yrs
- 0.0%
- Est. flood insurance / yr
- $473 – $860
Fire risk 3/10 · Minor
- Est. fire insurance / yr
- $963 – $1,789
Heat risk 5/10 · Moderate
- Hot days now (above 106°F)
- 7 days/yr
- Hot days in 30 yrs
- 17 days/yr
Wind risk 2/10 · Minimal
- Chance of severe wind over 30 yrs
- 4.0%
Air-quality risk 4/10 · Minor
- Unhealthy air days now
- 4 days/yr
- Unhealthy air days in 30 yrs
- 5 days/yr
Risk factors via First Street. Map © Google.
Why this score? — see what drove the C- grade
The composite is a weighted blend of 9 inputs, each scored 0–100. Each bar is that input's sub-score; the figure is the points it added to the 100-point composite (weight × sub-score).
- Cash flow +15.7/30.0
- ARV discount +15.0/15.0
- DSCR +4.8/10.0
- 1% rule +3.6/10.0
- Livability +3.3/5.0
- Schools +3.0/10.0
- Rent growth +2.5/5.0
- Condition / age +2.5/5.0
- Appreciation +0.0/10.0
$210,000
🖨 Deal sheet (PDF) 📄 Offer letter ✓ Due diligence
Listing remarks MLS
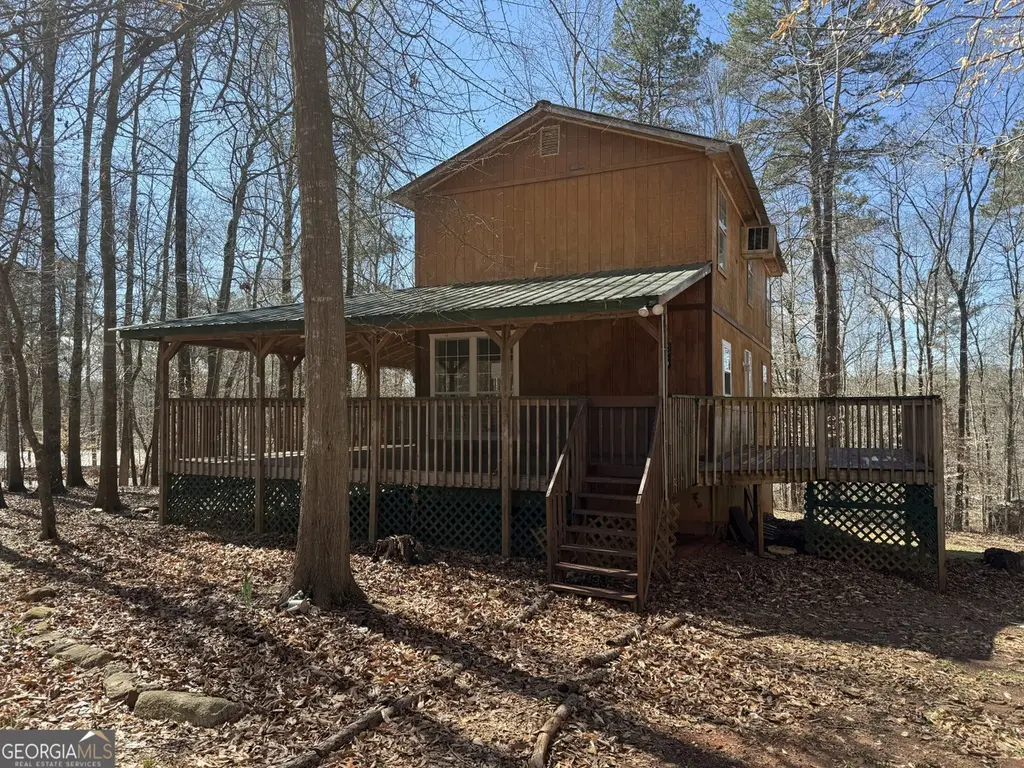
Great opportunity for a Lake Cabin with Seasonal Views of Lake Hartwell! This 2-bedroom, 2-bath cabin offers 1,296 sq ft of living space and is just minutes from Tugaloo State Park and public boat ramps. Upstairs, all three rooms offer seasonal lake views, and the primary suite includes a spacious bath with a jacuzzi tub/shower combo-perfect for unwinding after a day on the water. The unfinished basement provides options for storage or future expansion. Home is being sold as-is.
Key facts
- Lake cabin
- Primary suite
- Unfinished basement
Tags
Neighborhood map
What this means for you Summary
Snapshot
- This is a 3-bed/2.0-bath single-family listed at $210k.
Deal economics
- At list price, monthly cash flow is $91 ($1k/yr) — positive.
- The deal already cash-flows at list — no discount required.
- To meet the 1% rule (rent ≥ 1% of price), the offer needs to be $180k (14.3% below list).
- Recommended offer: $180k (14.3% below list) — sets the bar for 1% rule.
- Cap rate 6.8% vs local median 2.7% in Gumlog — top-decile yield for the area; either an underpriced asset or a hidden risk that comps aren't pricing in. Stress-test before assuming the spread holds.
Location & tenants
- Location reads 66/100 on livability (#185 in GA) — a middle-class / working-renter tenant base. Strengths: crime A+, cost of living A+, housing A+; Watch: schools F, amenities F, commute F.
- Franklin County (rural): math 38% / reading 35% proficiency, ranked #61 of 174 in GA (top 35%) — families likely to look elsewhere, expect single-tenant / working-renter base with shorter leases.
- Market conditions: 147 active listings in the ZIP; 1 comparable units currently listed for rent nearby; 163 units permitted in Franklin County in 2024 (0 in 5+ unit buildings).
Forward outlook
- Local home prices are declining (-3.0%/yr); year-one equity from $1k of loan paydown is wiped out by about $6k of value loss. Plan a longer hold.
Negotiation context
- It's been on market 97 days — a 9% lower offer ($191k) is reasonable based on typical stale-listing flexibility.
- 5 sale attempts since 7y ago; this cycle's ask has dropped $65k (24%) from the opening price — seller is motivated, your offer sets the floor, not the list.
Risks & watch-outs
- Climate carrying-cost: extreme-heat days projected 7→17/yr by 2055 (HVAC capex compounding) — expect insurance premiums to compound above CPI over the hold.
Questions for the listing agent
- It's been on market 97 days. Have you received any prior offers? Is the seller open to a 14% concession, seller financing, or rate buy-down credit?
- Why hasn't it sold? Are there any deal-killer items the seller is aware of (foundation, flood, title, zoning, code violations)?
- Is there a deadline driving the sale (1031 exchange, divorce, estate, relocation)? That informs how much negotiation room exists.
- Schools are F-rated, which usually means shorter tenancies and higher turnover. Who's the typical renter profile here, and what's been the actual vacancy rate?
- What's the average days-on-market for RENTAL listings here right now (not sales)? A rising rental-DOM trend means longer vacancies and softer asking-rent achievability than the comps imply.
- What's the recent tenant-quality profile in this submarket — average credit score on applications, eviction rate, late-payment / NSF rate, and stable-employment percentage? A property-management company in the area should have these aggregated.
- How much new for-sale + rental construction is in the pipeline within 1–3 miles? Heavy new supply typically softens prices + rents 12–24 months out; constrained supply supports both.
Investment metrics
- 1% rule
- 0.86% ✗
- Cap rate
- 6.81%
- Cash-on-cash
- 1.86%
- DSCR
- 1.08
- GRM
- 9.7
CMA / ARV
- ARV (median comp)
- $335,596
- List price
- $210,000
- Delta
- -37.42%
- Verdict
- UNDERPRICED
- Comps
- 20 within 1.0 mi
Show comp detail 12 sales within ~0.75 mi
| Address | Dist | Beds/Ba | Sqft | Sold | Price | $/sf | Match |
|---|---|---|---|---|---|---|---|
| 999 Rue Fleur De Lis | 0.18mi | 2/2.0 (-1) | 1,332 (+3%) | 2mo | $549,000 | $412 | 80 |
| 359 Rue Chalet | 0.39mi | 2/2.0 (-1) | 1,344 (+4%) | 10mo | $545,000 | $406 | 63 |
| 329 Chateau Dr | 0.09mi | 3/3.0 | 1,420 (+10%) | 18mo | $602,500 | $424 | 61 |
| 85 Stillwater Rd | 0.55mi | 3/2.0 | 1,332 (+3%) | 11mo | $307,500 | $231 | 61 |
| 356 Brittany Hbr S | 0.70mi | 3/1.0 | 1,300 (+0%) | 6mo | $45,000 | $35 | 58 |
| 805 Knottywood Dr | 0.66mi | 3/2.0 | 1,254 (-3%) | 13mo | $256,000 | $204 | 53 |
| 78 View Point Pl | 0.68mi | 2/2.0 (-1) | 1,232 (-5%) | 8mo | $275,000 | $223 | 48 |
| 349 Rue Fleur De Lis | 0.25mi | 2/2.0 (-1) | 1,450 (+12%) | 20mo | $285,000 | $197 | 47 |
| 576 Normandy Trl | 0.49mi | 3/2.0 | 1,396 (+8%) | 22mo | $495,000 | $355 | 46 |
| 508 Chandler Place Dr | 0.66mi | 3/2.0 | 1,352 (+4%) | 21mo | $324,000 | $240 | 45 |
| 223 Stone Bridge Cove Way | 0.58mi | 3/2.0 | 1,152 (-11%) | 15mo | $224,000 | $194 | 42 |
| 11 Fishermans Ext Cv | 0.51mi | 2/1.0 (-1) | 1,488 (+15%) | 9mo | $496,000 | $333 | 35 |
Match score weights: distance 35% · size 25% · config 20% · recency 20%. Top-matched comps best support the ARV.
Projected returns pro-forma
-3.0% appreciation · 3.0% rent growth · sell at horizon
- IRR
- -13.4%
- Equity multiple
- 0.52×
- Total profit
- $-28,281
- Equity at exit
- $31,312
- IRR
- -4.5%
- Equity multiple
- 0.70×
- Total profit
- $-17,355
- Equity at exit
- $18,157
Cash invested: $58,800 (down + closing). Projections, not guarantees.
Landlord ↔ Tenant lean methodology
- Overall (STATE)
- 90 Strongly Landlord-Friendly
- State Georgia
- 90 Strongly Landlord-Friendly · R+3
- County
- — inherits STATE
- City
- — inherits STATE
ZIP-level market 30553
- Home prices YoY
- -7.0%
- Active inventory
- 147
- Price-to-rent
- 9.7×
Monthly cashflow live
- Estimated rent
- $1,800 medium interval (Pro) →
- Mortgage (P&I)
- −$1,101
- Tax from tax record
- −$142 /mo · $1,707/yr
- Insurance
- −$88
- HOA
- −$0
- Vacancy / Maint / Mgmt
- −$378
- Net cashflow
- $91
Break-even live
Sensitivity live
| Price | -10% $210 | -5% $150 | +0% $91 | +5% $32 | +10% $-28 |
|---|---|---|---|---|---|
| Rent | -10% $-51 | -5% $20 | +0% $91 | +5% $162 | +10% $233 |
| Rate | -1.0pp $197 | -0.5pp $144 | base $91 | +0.5pp $37 | +1.0pp $-19 |
UW: 25.0% down · 7.5% · 30yr · 1.5% tax · 5.0% vac · 8.0% maint · 8.0% mgmt
Financing live
Cash to close
- Down payment
- $52,500
- Closing costs
- $6,300
- Reserves months
- —
- Total cash needed
- —
Loan-product check · same deal, 3 products live
Conventional
25% down · 7.5% · 30yr
- Down + closing
- —
- Monthly P&I
- —
- Monthly cashflow
- —
- DSCR
- —
- Eligible?
- —
Personal DTI + credit; lowest rate.
DSCR
20% down · 8.5% · 30yr
- Down + closing
- —
- Monthly P&I
- —
- Monthly cashflow
- —
- DSCR
- —
- Eligible?
- —
No personal income docs; deal must DSCR.
Hard money
10% down · 12.0% · 12mo
- Down + closing
- —
- Monthly P&I
- —
- Monthly cashflow
- —
- DSCR
- —
- Eligible?
- —
Short-term bridge; refi at stabilization.
Rent comps 1 comps
| Address | Beds | Baths | Sqft | Rent | $/sqft | DOM | Units | Dist |
|---|---|---|---|---|---|---|---|---|
| 790 Normandy Trl Lavonia, GA | 2.0 | 1.5 | 1008 | $1,800 | $1.79 | 45d | 1 | 0.49mi |
Listing history 31 events
-
2026-06-21days on market $210,000 Active 97 DOM
-
2026-06-19days on market $210,000 Active 95 DOM
-
2026-06-18days on market $210,000 Active 94 DOM
-
2026-06-17days on market $210,000 Active 93 DOM
-
2026-06-16days on market $210,000 Active 92 DOM
-
2026-06-15days on market $210,000 Active 91 DOM
-
2026-06-14days on market $210,000 Active 89 DOM
-
2026-06-12days on market $210,000 Active 88 DOM
-
2026-06-09days on market $210,000 Active 85 DOM
-
2026-06-08days on market $210,000 Active 84 DOM
-
2026-06-07days on market $210,000 Active 83 DOM
-
2026-06-07remarks 511-char remark
-
2026-06-07pricedays on market $210,000 Active 82 DOM
-
2026-06-03days on market $262,000 Active 79 DOM
-
2026-06-02days on market $262,000 Active 78 DOM
-
2026-06-01days on market $262,000 Active 77 DOM
-
2026-05-31days on market $262,000 Active 76 DOM
-
2026-05-31days on market $262,000 Active 75 DOM
-
2026-04-21price $262,000 485-char remark
Show marketing remark (485 chars)
Great opportunity for a Lake Cabin with Seasonal Views of Lake Hartwell! This 2-bedroom, 2-bath cabin offers 1,296 sq ft of living space and is just minutes from Tugaloo State Park and public boat ramps. Upstairs, all three rooms offer seasonal lake views, and the primary suite includes a spacious bath with a jacuzzi tub/shower combo-perfect for unwinding after a day on the water. The unfinished basement provides options for storage or future expansion. Home is being sold as-is.
-
2026-03-16$275,000 New 485-char remark
Show marketing remark (485 chars)
Great opportunity for a Lake Cabin with Seasonal Views of Lake Hartwell! This 2-bedroom, 2-bath cabin offers 1,296 sq ft of living space and is just minutes from Tugaloo State Park and public boat ramps. Upstairs, all three rooms offer seasonal lake views, and the primary suite includes a spacious bath with a jacuzzi tub/shower combo-perfect for unwinding after a day on the water. The unfinished basement provides options for storage or future expansion. Home is being sold as-is.
-
2025-11-20historical
-
2023-08-15soldstatus $210,800
-
2023-07-31soldstatus $208,000 Sold
-
2023-07-03price $208,000
-
2023-06-30status Back On Market
-
2023-05-19status Under Contract
-
2023-05-04$249,900 New
-
2023-05-04$215,000 New
-
2020-08-07soldstatus $120,000
-
2020-08-06soldstatus $120,000
-
2019-09-18$124,900
ⓘ Source: listings_history table (triggers on properties + properties_extension) + one-shot
backfill from property_details.listing_events for pre-trigger history.
Tax reassessment forecast GA · Resets to sale price
- Current annual tax
- $1,707 · $142/mo
- Projected year-2 tax
- $1,932 · $161/mo
- Expected delta
- +$225/yr (+$19/mo · 13.2%)
ⓘ Screening estimate from a state-policy table — verify with the county assessor before closing.
Climate risk First Street
- Flood 1/10 Low FEMA zone X (unshaded) · 0% chance over 30 yrs
- Wildfire 3/10 Moderate
- Heat 5/10 Major 7 d/yr ≥106°F today · 17 d/yr by 30 yrs out
- Wind 2/10 Low 4% chance of damaging wind over 30 yrs
- Air quality 4/10 Moderate 4 unhealthy d/yr today · 5 by 30 yrs out
Nearby sold comps map
Loading sold comps map…
Walkable amenities ~0.75 mi
Loading nearby amenities…
Taxation est. · year 1
- Rental income
- $21,600
- − Mortgage interest
- −$11,763
- − Property taxes
- −$1,707
- − Insurance
- −$1,050
- − Repairs & maintenance
- −$1,728
- − Management
- −$1,728
- − Depreciation
- −$6,109
- Taxable loss
- −$2,485
- Est. tax savings @ 24.0%
- +$597
- After-tax cash flow
- $1,688/yr
For passive investors: Depreciation is non-cash, so a rental often shows a tax loss while cash-flowing — sheltering income. Rental losses are passive: they offset passive income freely, and up to $25,000/yr can offset ordinary (W-2) income if you actively participate and your MAGI is under $100k (phasing out to $0 by $150k); unused losses carry forward. On sale, claimed depreciation is recaptured at up to 25%, and gains may owe capital-gains tax (a 1031 exchange can defer both). Figures are a year-1 estimate at your 24.0% rate — not tax advice; consult a CPA.
Schools (NCES district)
- District
- Franklin County
- NCES district ID
- 1302250
- Math proficiency
- 38% ▼ -1.00%
- Reading proficiency
- 35% ▼ -3.00%
- Median HH income
- $35,985
- Composite
- 30.28/100
- National rank
- #6281
- State rank
- #61 of 174 in GA
Livability — Gumlog
- Score
- 66/100
- State rank
- #185
- US rank
- #11633
Category grades
Schools grade is shown separately in the Schools card above.
Census & demographics
- Census place
- Gumlog, GA
- Population (ZIP)
- 8,454
Population outlook (Franklin County) Hauer SSP2
- Today (2025)
- 22,625 people
- By 2030
- 22,725 · +0.4%
- By 2040
- 22,806 · +0.8%
- By 2050
- 22,713 · +0.4%
- By 2075
- 22,514 · -0.5%
- By 2100
- 20,768 · -8.2%
Race, ethnicity, and origin ACS 2023
- Neighborhood character
- Predominantly White (75%)
- Race & ethnicity
- White 75% Black 11% Hispanic / Latino 9% Two or more races 9%
- Hispanic origin (detail)
- Mexican 8%
- Common ancestry
- Serbian 2% Slovak 2% Lithuanian 1%
- Foreign-born
- 4% · Canada
- Languages at home
- 89% English-only · Spanish 8% Other Asian/Pacific 1%
Political lean MEDSL · Franklin
- 2024 margin
- Solid R (+72.6) · D 13.6% · R 86.2%
- 2008→2024 swing
- -21.1pp toward R · 2008: -51.5pp · 2024: -72.6pp
- All cycles
- 2024: R+72.6 2020: R+69.5 2016: R+68.6 2012: R+59.5 2008: R+51.5
Not yet ingested
- Civics
- —
Market trends
- HPI YoY
- ▼ -28.92%
- Current HPI
- 385.1997
- Rent YoY
- —
- Metro
- —
- State GDP YoY
- ▲ 2.66%
- F500 in state
- 28
Industry mix (Fortune 500 HQ in GA)
| Industry | F500 HQs | Revenue |
|---|---|---|
| Paper / Packaging | 2 | $29B |
|
||
| Retail | 1 | $160B |
|
||
| Transportation / Logistics | 1 | $91B |
|
||
| Airlines | 1 | $62B |
|
||
| Consumer Goods | 1 | $47B |
|
||
| Utilities | 1 | $25B |
|
||
Price history
+109.8% since first listed13 events — show timeline
- 2026-04-21 Price Changed $262,000 GAMLS
- 2026-03-16 Listed $275,000 GAMLS
- 2025-11-20 Listing Removed — GAMLS
- 2023-08-15 Sold (Public Records) $210,800 Public Records
- 2023-07-31 Sold (MLS) $208,000 GAMLS
- 2023-07-03 Price Changed $208,000 GAMLS
- 2023-06-30 Relisted — GAMLS
- 2023-05-19 Pending — GAMLS
- 2023-05-04 Listed $215,000 GAMLS
- 2023-05-04 Listed $249,900 GAMLS
- 2020-08-07 Sold (MLS) $120,000 GAMLS
- 2020-08-06 Sold (Public Records) $120,000 Public Records
- 2019-09-18 Listed $124,900 GAMLS
Property tax history
+7.3%/yrLatest (2025): $1,707 · -2.1% YoY. Source: county tax records.
Cash-flow waterfall
monthlySold comps — $/sqft
last 12 mo · ≤1 miLoading sold comps…