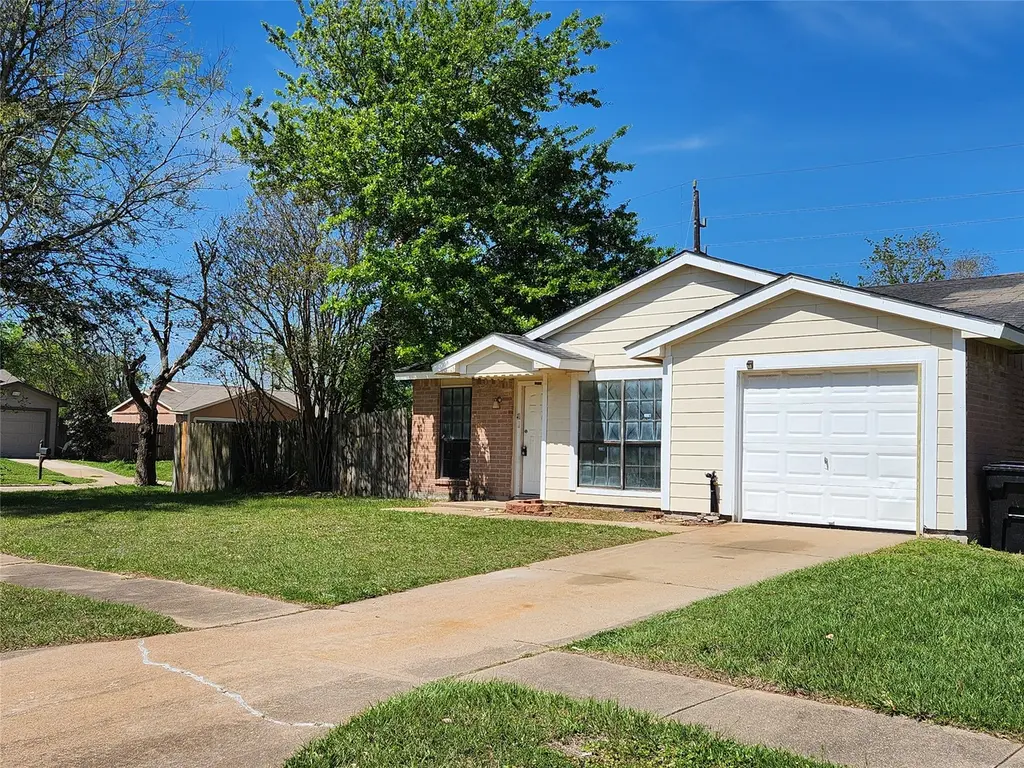
24134 Kennedy Ranch Ln · Houston, TX
Flood risk 1/10 · Minimal
- FEMA flood zone
- X (unshaded)
- Chance of flooding over 30 yrs
- 0.0%
- Est. flood insurance / yr
- $507 – $1,088
Fire risk 5/10 · Moderate
- Est. fire insurance / yr
- $1,222 – $2,270
Heat risk 9/10 · Severe
- Hot days now (above 110°F)
- 7 days/yr
- Hot days in 30 yrs
- 23 days/yr
Wind risk 8/10 · Major
- Chance of severe wind over 30 yrs
- 99.0%
Air-quality risk 2/10 · Minimal
- Unhealthy air days now
- 1 days/yr
- Unhealthy air days in 30 yrs
- 1 days/yr
Risk factors via First Street. Map © Google.
Why this score? — see what drove the B grade
The composite is a weighted blend of 9 inputs, each scored 0–100. Each bar is that input's sub-score; the figure is the points it added to the 100-point composite (weight × sub-score).
- Cash flow +26.5/30.0
- ARV discount +14.9/15.0
- DSCR +9.0/10.0
- 1% rule +8.4/10.0
- Livability +3.7/5.0
- Schools +2.9/10.0
- Condition / age +2.5/5.0
- Rent growth +2.1/5.0
- Appreciation +0.0/10.0
$149,000
🖨 Deal sheet 📄 Offer letter ✓ Due diligence
Listing remarks MLS
Charming single-story home offering great curb appeal and everyday comfort. This inviting property features a modern exterior with a combination of light siding and brick accents, complemented by a spacious front yard and mature trees that provide both shade and character. This corner lot 3-bedroom home includes a convenient one-car garage and an extended driveway for additional parking. A covered front entry creates a welcoming first impression, while large front windows allow for plenty of natural light inside. The fenced backyard offers privacy and space for outdoor entertaining, pets, or gardening. Home is priced to move quickly and would function as a great starter home or a lower priced home option with easy access to 290.
Key facts
- 6,825 sq ft lot
- Garage
- Built 1982
Neighborhood map
What this means for you Summary
Snapshot
- This is a 3-bed/1.0-bath single-family listed at $149k.
Deal economics
- At list price, monthly cash flow is $394 ($5k/yr) — positive.
- The deal already cash-flows at list — no discount required.
- Meets the 1% rule at list price ($2k rent vs $149k).
- Recommended offer: $140k (6.0% below list) — sets the bar for market timing.
- Cap rate 9.5% vs local median 3.2% in Houston — top-decile yield for the area; either an underpriced asset or a hidden risk that comps aren't pricing in. Stress-test before assuming the spread holds.
Location & tenants
- Location reads 74/100 on livability (#184 in TX, #4,771 nationally) — a middle-class / working-renter tenant base. Strengths: amenities A+, cost of living A+, housing A+; Watch: schools D, crime F.
- Waller ISD (rural): math 30% / reading 35% proficiency, ranked #532 of 826 in TX (top 64%) — families likely to look elsewhere, expect single-tenant / working-renter base with shorter leases.
- Market conditions: Rents soft (-1.6%/yr); 1782 active listings in the ZIP; 3 comparable units currently listed for rent nearby; rentals leasing fast (median 3d on market — plan ~1-2 weeks tenant-placement turnaround); high-income renter base; 29,883 units permitted in Harris County in 2024 (8,621 in 5+ unit buildings).
Forward outlook
- Local home prices are declining (-3.0%/yr); year-one equity from $1k of loan paydown is wiped out by about $4k of value loss. Plan a longer hold.
- Harris County population projected at +47% by 2050 — long-run rental-demand tailwind backs the buy-and-hold thesis.
Negotiation context
- It's been on market 65 days — a 6% lower offer ($140k) is reasonable based on typical stale-listing flexibility.
- 2 sale attempts since 11y ago; this cycle's ask has dropped $20k (12%) from the opening price — seller is motivated, your offer sets the floor, not the list.
- Current owner paid $31k; list at $149k implies a 382% gain — meaningful room to come down on a strong offer.
Risks & watch-outs
- Watch-outs: property tax is 2.5% of price.
- Climate carrying-cost: severe wind risk, 99% chance of damaging wind over 30y; moderate wildfire risk; extreme-heat days projected 7→23/yr by 2055 (HVAC capex compounding) — expect insurance premiums to compound above CPI over the hold.
Questions for the listing agent
- It's been on market 65 days. Have you received any prior offers? Is the seller open to a 6% concession, seller financing, or rate buy-down credit?
- Property tax is high relative to price — has the assessment been appealed recently, and will the sale trigger a re-assessment?
- What does the HOA fee cover, when was the last increase, and are there any pending special assessments or reserve-fund shortfalls?
- Why hasn't it sold? Are there any deal-killer items the seller is aware of (foundation, flood, title, zoning, code violations)?
- Is there a deadline driving the sale (1031 exchange, divorce, estate, relocation)? That informs how much negotiation room exists.
- Schools are D-rated, which usually means shorter tenancies and higher turnover. Who's the typical renter profile here, and what's been the actual vacancy rate?
- Crime grade is F in this area — have there been break-ins, vandalism, or insurance claims at this property in the last 3 years? What carrier currently insures it and at what premium?
- What's the average days-on-market for RENTAL listings here right now (not sales)? A rising rental-DOM trend means longer vacancies and softer asking-rent achievability than the comps imply.
- What's the recent tenant-quality profile in this submarket — average credit score on applications, eviction rate, late-payment / NSF rate, and stable-employment percentage? A property-management company in the area should have these aggregated.
- How much new for-sale + rental construction is in the pipeline within 1–3 miles? Heavy new supply typically softens prices + rents 12–24 months out; constrained supply supports both.
Investment metrics
- 1% rule
- 1.34% ✓
- Cap rate
- 9.46%
- Cash-on-cash
- 11.33%
- DSCR
- 1.50
- GRM
- 6.2
CMA / ARV
- ARV (median comp)
- $178,414
- List price
- $149,000
- Delta
- -16.49%
- Verdict
- UNDERPRICED
- Comps
- 20 within 1.0 mi
Show comp detail 12 sales within ~0.75 mi
| Address | Dist | Beds/Ba | Sqft | Sold | Price | $/sf | Match |
|---|---|---|---|---|---|---|---|
| 24134 Kennedy Ranch Ln | 0.00mi | 3/1.0 | 998 (0%) | 0mo | $149,000 | $149 | 100 |
| 24022 Four Sixes Ln | 0.11mi | 3/1.0 | 998 (0%) | 0mo | $184,000 | $184 | 95 |
| 17510 Bullis Gap Dr | 0.14mi | 3/1.0 | 998 (0%) | 4mo | $195,000 | $195 | 90 |
| 24123 Kennedy Ranch Ln | 0.04mi | 3/1.0 | 998 (0%) | 12mo | $189,500 | $190 | 88 |
| 17206 Bullis Gap Dr | 0.12mi | 3/1.0 | 998 (0%) | 16mo | $194,900 | $195 | 82 |
| 24211 Four Sixes Ln | 0.12mi | 3/2.0 | 1,035 (+4%) | 6mo | $189,000 | $183 | 79 |
| 24127 Jumping Jay Ln | 0.13mi | 3/2.0 | 998 (0%) | 20mo | $180,000 | $180 | 74 |
| 17307 Ranch Country Rd | 0.07mi | 2/1.0 (-1) | 901 (-10%) | 10mo | $186,500 | $207 | 67 |
| 24227 Kennedy Ranch Ln | 0.17mi | 2/1.0 (-1) | 901 (-10%) | 8mo | $160,000 | $178 | 64 |
| 24039 Rockin Seven Dr | 0.23mi | 2/1.0 (-1) | 1,107 (+11%) | 6mo | $179,000 | $162 | 61 |
| 17314 Box Canyon Dr | 0.15mi | 3/2.0 | 1,111 (+11%) | 16mo | $180,000 | $162 | 57 |
| 17311 Wagganner Dr | 0.34mi | 3/2.0 | 1,100 (+10%) | 12mo | $209,750 | $191 | 53 |
Match score weights: distance 35% · size 25% · config 20% · recency 20%. Top-matched comps best support the ARV.
Projected returns pro-forma
-3.0% appreciation · 0.0% rent growth · sell at horizon
- IRR
- -3.2%
- Equity multiple
- 0.89×
- Total profit
- $-4,775
- Equity at exit
- $22,216
- IRR
- 2.4%
- Equity multiple
- 1.15×
- Total profit
- $6,081
- Equity at exit
- $12,883
Cash invested: $41,720 (down + closing). Projections, not guarantees.
Landlord ↔ Tenant lean methodology
- Overall (STATE)
- 87 Strongly Landlord-Friendly
- State Texas
- 87 Strongly Landlord-Friendly · R+5
- County
- — inherits STATE
- City
- — inherits STATE
ZIP-level market 77447
- Home prices YoY
- -31.1%
- Rents YoY
- -1.6%
- Active inventory
- 1782
- Price-to-rent
- 6.2×
Monthly cashflow live
- Estimated rent
- $1,992 medium interval (Pro) →
- Mortgage (P&I)
- −$781
- Tax from tax record
- −$315 /mo · $3,783/yr
- Insurance
- −$62
- HOA
- −$21
- Vacancy / Maint / Mgmt
- −$418
- Net cashflow
- $394
Break-even live
UW: 25.0% down · 7.5% · 30yr · 1.5% tax · 5.0% vac · 8.0% maint · 8.0% mgmt
Financing live
Cash to close
- Down payment
- $37,250
- Closing costs
- $4,470
- Reserves months
- —
- Total cash needed
- —
Loan-product check · same deal, 3 products live
Conventional
25% down · 7.5% · 30yr
- Down + closing
- —
- Monthly P&I
- —
- Monthly cashflow
- —
- DSCR
- —
- Eligible?
- —
Personal DTI + credit; lowest rate.
DSCR
20% down · 8.5% · 30yr
- Down + closing
- —
- Monthly P&I
- —
- Monthly cashflow
- —
- DSCR
- —
- Eligible?
- —
No personal income docs; deal must DSCR.
Hard money
10% down · 12.0% · 12mo
- Down + closing
- —
- Monthly P&I
- —
- Monthly cashflow
- —
- DSCR
- —
- Eligible?
- —
Short-term bridge; refi at stabilization.
Rent comps 3 comps
| Address | Beds | Baths | Sqft | Rent | $/sqft | DOM | Units | Dist |
|---|---|---|---|---|---|---|---|---|
| 24318 Running Iron Dr Hockley, TX | 2.0 | 1.0 | 958 | $1,400 | $1.46 | 43d | 1 | 0.20mi |
| 23823 Cumberland Ridge Dr Hockley, TX | 1.0–4.0 | 1.0–3.0 | 1034 | $1,954 | $1.89 | 3d | 22 | 0.30mi |
| 17013 Becker Rd Hockley, TX | 1.0–3.0 | 1.0–2.0 | 1071 | $2,315 | $2.16 | 1d | 122 | 0.49mi |
HOA detail
- Monthly dues
- $21 · $252/yr
Listing history 10 events
-
2026-05-15status Pending 744-char remark
Show marketing remark (744 chars)
Charming single-story home offering great curb appeal and everyday comfort. This inviting property features a modern exterior with a combination of light siding and brick accents, complemented by a spacious front yard and mature trees that provide both shade and character. This corner lot 3-bedroom home includes a convenient one-car garage and an extended driveway for additional parking. A covered front entry creates a welcoming first impression, while large front windows allow for plenty of natural light inside. The fenced backyard offers privacy and space for outdoor entertaining, pets, or gardening. Home is priced to move quickly and would function as a great starter home or a lower priced home option with easy access to 290.
-
2026-05-09price $149,000 744-char remark
Show marketing remark (744 chars)
Charming single-story home offering great curb appeal and everyday comfort. This inviting property features a modern exterior with a combination of light siding and brick accents, complemented by a spacious front yard and mature trees that provide both shade and character. This corner lot 3-bedroom home includes a convenient one-car garage and an extended driveway for additional parking. A covered front entry creates a welcoming first impression, while large front windows allow for plenty of natural light inside. The fenced backyard offers privacy and space for outdoor entertaining, pets, or gardening. Home is priced to move quickly and would function as a great starter home or a lower priced home option with easy access to 290.
-
2026-04-21price $160,000 744-char remark
Show marketing remark (744 chars)
Charming single-story home offering great curb appeal and everyday comfort. This inviting property features a modern exterior with a combination of light siding and brick accents, complemented by a spacious front yard and mature trees that provide both shade and character. This corner lot 3-bedroom home includes a convenient one-car garage and an extended driveway for additional parking. A covered front entry creates a welcoming first impression, while large front windows allow for plenty of natural light inside. The fenced backyard offers privacy and space for outdoor entertaining, pets, or gardening. Home is priced to move quickly and would function as a great starter home or a lower priced home option with easy access to 290.
-
2026-03-23$169,000 Active 744-char remark
Show marketing remark (744 chars)
Charming single-story home offering great curb appeal and everyday comfort. This inviting property features a modern exterior with a combination of light siding and brick accents, complemented by a spacious front yard and mature trees that provide both shade and character. This corner lot 3-bedroom home includes a convenient one-car garage and an extended driveway for additional parking. A covered front entry creates a welcoming first impression, while large front windows allow for plenty of natural light inside. The fenced backyard offers privacy and space for outdoor entertaining, pets, or gardening. Home is priced to move quickly and would function as a great starter home or a lower priced home option with easy access to 290.
-
2015-12-31soldstatus
-
2015-12-31historical
-
2015-12-30soldstatus Sold
-
2015-12-23status Option Pending
-
2015-12-15$79,000 Active
-
1995-08-30soldstatus $30,900
ⓘ Source: listings_history table (triggers on properties + properties_extension) + one-shot
backfill from property_details.listing_events for pre-trigger history.
Tax reassessment forecast TX · Resets to sale price
- Current annual tax
- $3,783 · $315/mo
- Projected year-2 tax
- $3,783 · $315/mo
- Expected delta
- $0/yr ($0/mo · 0.0%)
ⓘ Screening estimate from a state-policy table — verify with the county assessor before closing.
Climate risk First Street
- Flood 1/10 Low FEMA zone X (unshaded) · 0% chance over 30 yrs
- Wildfire 5/10 Major
- Heat 9/10 Extreme 7 d/yr ≥110°F today · 23 d/yr by 30 yrs out
- Wind 8/10 Severe 99% chance of damaging wind over 30 yrs
- Air quality 2/10 Low 1 unhealthy d/yr today · 1 by 30 yrs out
Nearby sold comps map
Loading sold comps map…
Walkable amenities ~0.75 mi
Loading nearby amenities…
Taxation est. · year 1
- Rental income
- $23,902
- − Mortgage interest
- −$8,346
- − Property taxes
- −$3,783
- − Insurance
- −$745
- − Repairs & maintenance
- −$1,912
- − Management
- −$1,912
- − HOA
- −$252
- − Depreciation
- −$4,335
- Taxable income
- $2,617
- Est. tax owed @ 24.0%
- −$628
- After-tax cash flow
- $4,098/yr
For passive investors: Depreciation is non-cash, so a rental often shows a tax loss while cash-flowing — sheltering income. Rental losses are passive: they offset passive income freely, and up to $25,000/yr can offset ordinary (W-2) income if you actively participate and your MAGI is under $100k (phasing out to $0 by $150k); unused losses carry forward. On sale, claimed depreciation is recaptured at up to 25%, and gains may owe capital-gains tax (a 1031 exchange can defer both). Figures are a year-1 estimate at your 24.0% rate — not tax advice; consult a CPA.
Schools (NCES district)
- District
- Waller ISD
- NCES district ID
- 4844430
- Math proficiency
- 30% ▼ -23.00%
- Reading proficiency
- 35% ▼ -11.00%
- Median HH income
- $58,911
- Composite
- 29.12/100
- National rank
- #6593
- State rank
- #532 of 826 in TX
Livability — Houston
- Score
- 74/100
- State rank
- #184
- US rank
- #4771
Category grades
Schools grade is shown separately in the Schools card above.
Census & demographics
- County
- Harris County · 4,702,590 people
- City population
- 3,226,434
- Metro
- Houston-The Woodlands-Sugar Land, TX
- Population (ZIP)
- 25,231
- Household income
- $116,925
- Rent vs Own
- Severe rent burden
- 265.0
Population outlook (Harris County) Hauer SSP2
- Today (2025)
- 5,571,493 people
- By 2030
- 6,089,821 · +9.3%
- By 2040
- 7,142,806 · +28.2%
- By 2050
- 8,185,864 · +46.9%
- By 2075
- 10,574,329 · +89.8%
- By 2100
- 12,109,958 · +117.4%
Race, ethnicity, and origin ACS 2023
- Neighborhood character
- Diverse neighborhood (Simpson 0.63)
- Race & ethnicity
- White 44% Hispanic / Latino 41% Two or more races 16% Black 9% Asian 1%
- Hispanic origin (detail)
- Mexican 27%
- Common ancestry
- Lithuanian 3% Slovak 1% Romanian 1%
- Foreign-born
- 15% · Canada, Jamaica, Dominican Republic
- Languages at home
- 69% English-only · Spanish 28% Other Indo-European 1% Vietnamese 1%
Political lean MEDSL · Harris
- 2024 margin
- Lean D (+5.5) · D 52.0% · R 46.4% · Other 1.6%
- 2008→2024 swing
- +3.9pp toward D · 2008: 1.6pp · 2024: 5.5pp
- All cycles
- 2024: D+5.5 2020: D+13.3 2016: D+12.4 2012: D+0.1 2008: D+1.6
Not yet ingested
- Civics
- —
Market trends
- HPI YoY
- ▼ -112.73%
- Current HPI
- 249.6969
- Rent YoY
- ▼ -1.58%
- Metro
- Houston-The Woodlands-Sugar Land, TX
- State GDP YoY
- ▲ 3.95%
- F500 in state
- 110
Industry mix (Fortune 500 HQ in TX)
| Industry | F500 HQs | Revenue |
|---|---|---|
| Energy | 16 | $1,198B |
|
||
| Technology | 5 | $198B |
|
||
| Engineering / Construction | 4 | $72B |
|
||
| Energy Services | 3 | $60B |
|
||
| Utilities | 3 | $41B |
|
||
| Healthcare | 2 | $330B |
|
||
Price history
+382.2% since first listed10 events — show timeline
- 2026-05-15 Pending — HARMLS
- 2026-05-09 Price Changed $149,000 HARMLS
- 2026-04-21 Price Changed $160,000 HARMLS
- 2026-03-23 Listed $169,000 HARMLS
- 2015-12-31 Sold (Public Records) — Public Records
- 2015-12-31 Listing Removed — HARMLS
- 2015-12-30 Sold (MLS) — HARMLS
- 2015-12-23 Pending — HARMLS
- 2015-12-15 Listed $79,000 HARMLS
- 1995-08-30 Sold (Public Records) $30,900 Public Records
Property tax history
+4.6%/yrLatest (2025): $3,783 · +1.3% YoY. Source: county tax records.
Cash-flow waterfall
monthlySold comps — $/sqft
last 12 mo · ≤1 miLoading sold comps…