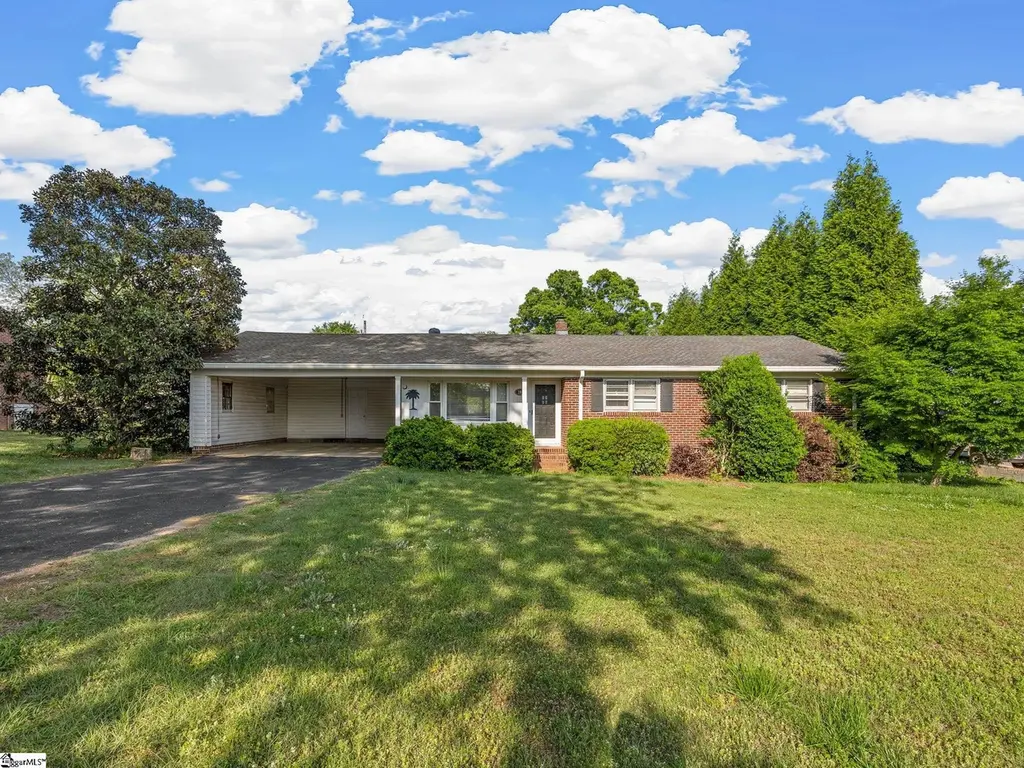
299 Mcabee Rd · Roebuck, SC
Flood risk 1/10 · Minimal
- FEMA flood zone
- X (unshaded)
- Chance of flooding over 30 yrs
- 0.0%
- Est. flood insurance / yr
- $507 – $1,088
Fire risk 3/10 · Minor
- Est. fire insurance / yr
- $783 – $1,453
Heat risk 6/10 · Moderate
- Hot days now (above 105°F)
- 7 days/yr
- Hot days in 30 yrs
- 16 days/yr
Wind risk 2/10 · Minimal
- Chance of severe wind over 30 yrs
- 2.0%
Air-quality risk 4/10 · Minor
- Unhealthy air days now
- 4 days/yr
- Unhealthy air days in 30 yrs
- 5 days/yr
Risk factors via First Street. Map © Google.
Why this score? — see what drove the B- grade
The composite is a weighted blend of 9 inputs, each scored 0–100. Each bar is that input's sub-score; the figure is the points it added to the 100-point composite (weight × sub-score).
- Cash flow +24.9/30.0
- ARV discount +15.0/15.0
- DSCR +8.1/10.0
- 1% rule +6.4/10.0
- Schools +3.2/10.0
- Livability +3.2/5.0
- Rent growth +2.5/5.0
- Condition / age +2.5/5.0
- Appreciation +0.0/10.0
$174,900
🖨 Deal sheet (PDF) 📄 Offer letter ✓ Due diligence
Listing remarks MLS
Charming 3-bedroom, 1.5-bath brick ranch in a great location within the desirable District 6 school area. This home offers a wonderful opportunity for a rental, investment property, or for buyers ready to add a few personal touches and make it their own. Home is being sold "AS IS"
Key facts
- 0.46 acre lot
- 2 garage spots
- Built 1963
Property features AI
Finance
- HOA & community: No HOA fees
Exterior
- Parking: Attached carport for 2 cars; Paved driveway
- Utilities: Public water; Electric water heater; Septic sewer; Electric power
- Home design: Single-story residence; Built around 1963; Storage in attic and outbuilding; Crawl space foundation; Lot is 1/2 acre or less; Lead-based paint and residential property disclosures required
- Construction: Architectural roof
- Exterior features: Front porch; Patio; Level lot; Brick veneer (full)
Interior
- Kitchen: Kitchen about 10 x 14; Dishwasher; Electric oven; Built-in microwave
- Bedrooms: Three main-level bedrooms; Primary bedroom includes a half bath; Primary bedroom about 12 x 14; Second bedroom about 12 x 13; Third bedroom about 17 x 13
- Flooring: Hardwood floors; Vinyl floors
- Bathrooms: One full bathroom; One half bathroom
- Heating & cooling: Electric heating; Central forced air cooling (electric)
- Interior features: Blown ceiling; No fireplace
- Laundry & utility: Washer connection; Electric dryer hookup; Dedicated laundry room
Neighborhood map
What this means for you Summary
Snapshot
- This is a 3-bed/1.5-bath single-family listed at $175k.
Deal economics
- At list price, monthly cash flow is $377 ($5k/yr) — positive.
- The deal already cash-flows at list — no discount required.
- Meets the 1% rule at list price ($2k rent vs $175k).
- Cap rate 8.9% vs local median 4.7% in Roebuck — top-decile yield for the area; either an underpriced asset or a hidden risk that comps aren't pricing in. Stress-test before assuming the spread holds.
Location & tenants
- Location reads 64/100 on livability (#147 in SC) — a middle-class / working-renter tenant base. Strengths: crime A+, cost of living A+, housing A+; Watch: amenities F, commute F, health & safety F.
- Spartanburg 06 (suburban): math 33% / reading 42% proficiency, ranked #35 of 80 in SC (top 44%) — families likely to look elsewhere, expect single-tenant / working-renter base with shorter leases.
- Zoned schools: Roebuck Elementary (math 40% / reading 37%, grade F, #306 of 597 statewide, top 51%, 800 students, 84% FRL); Dorman High (math 46% / reading 78%, grade B-, #99 of 196 statewide, top 53%, 3,808 students, 75% FRL) — zoned schools average 80% FRL vs 48% district-wide (31 pts higher); higher-poverty schools than district average — tighter screening recommended.
- Zoned-school proficiency averages 50% at this address vs 38% district-wide (+13 pts) — the actual schools serving this property are materially stronger than the Spartanburg 06 average implies; a family-tenant draw the district grade alone would hide.
- Market conditions: 144 active listings in the ZIP; 1 comparable units currently listed for rent nearby; 3,129 units permitted in Spartanburg County in 2024 (40 in 5+ unit buildings).
Forward outlook
- Local home prices are declining (-3.0%/yr); year-one equity from $1k of loan paydown is wiped out by about $5k of value loss. Plan a longer hold.
- Spartanburg County population projected at +18% by 2050 — long-run rental-demand tailwind backs the buy-and-hold thesis.
Negotiation context
- Only 4 days on market — expect competitive offers; lowballing is unlikely to land.
- 4 sale attempts since 23y ago with the ask held roughly flat each time — persistent listings suggest the price (not the market) is what's stuck; bring a comps-based counter.
- Current owner paid $80k; list at $175k implies a 119% gain — meaningful room to come down on a strong offer.
Risks & watch-outs
- Climate carrying-cost: extreme-heat days projected 7→16/yr by 2055 (HVAC capex compounding) — expect insurance premiums to compound above CPI over the hold.
Questions for the listing agent
- Built in 1963 — when were the roof, HVAC, electrical panel, plumbing, and water heater last replaced?
- Is there a deadline driving the sale (1031 exchange, divorce, estate, relocation)? That informs how much negotiation room exists.
- Schools are D-rated, which usually means shorter tenancies and higher turnover. Who's the typical renter profile here, and what's been the actual vacancy rate?
- What's the average days-on-market for RENTAL listings here right now (not sales)? A rising rental-DOM trend means longer vacancies and softer asking-rent achievability than the comps imply.
- What's the recent tenant-quality profile in this submarket — average credit score on applications, eviction rate, late-payment / NSF rate, and stable-employment percentage? A property-management company in the area should have these aggregated.
- How much new for-sale + rental construction is in the pipeline within 1–3 miles? Heavy new supply typically softens prices + rents 12–24 months out; constrained supply supports both.
Investment metrics
- 1% rule
- 1.14% ✓
- Cap rate
- 8.88%
- Cash-on-cash
- 9.24%
- DSCR
- 1.41
- GRM
- 7.3
CMA / ARV
- ARV (on-the-fly)
- $246,050
- Comps found
- 12
Show comp detail 12 sales within ~0.75 mi
| Address | Dist | Beds/Ba | Sqft | Sold | Price | $/sf | Match |
|---|---|---|---|---|---|---|---|
| 299 Mcabee Rd | 0.00mi | 3/1.5 | 1,270 (-2%) | 0mo | $174,900 | $138 | 96 |
| 1128 Kaden Ct | 0.18mi | 3/2.0 | 1,183 (-9%) | 0mo | $225,000 | $190 | 75 |
| 1140 Kaden Ct | 0.17mi | 3/2.0 | 1,183 (-9%) | 2mo | $222,000 | $188 | 74 |
| 1153 Kaden Ct | 0.14mi | 3/2.0 | 1,183 (-9%) | 5mo | $219,900 | $186 | 73 |
| 309 Mcabee Rd | 0.02mi | 3/1.5 | 1,100 (-15%) | 3mo | $234,000 | $213 | 72 |
| 1177 Kaden Ct | 0.13mi | 3/2.0 | 1,183 (-9%) | 9mo | $236,900 | $200 | 70 |
| 237 Spirit Dr | 0.41mi | 3/2.0 | 1,286 (-1%) | 10mo | $233,000 | $181 | 69 |
| 336 Bench Creek Pl | 0.70mi | 3/2.0 | 1,319 (+2%) | 9mo | $239,900 | $182 | 55 |
| 245 Basswood Dr | 0.58mi | 3/2.0 | 1,216 (-6%) | 9mo | $232,000 | $191 | 54 |
| 340 Bench Creek Pl Pl | 0.71mi | 3/2.0 | 1,216 (-6%) | 5mo | $225,000 | $185 | 50 |
| 189 Birchwood Dr | 0.71mi | 3/2.0 | 1,406 (+9%) | 2mo | $300,000 | $213 | 49 |
| 218 Joe Arthur Dr | 0.72mi | 3/2.0 | 1,383 (+7%) | 7mo | $279,900 | $202 | 47 |
Match score weights: distance 35% · size 25% · config 20% · recency 20%. Top-matched comps best support the ARV.
Projected returns pro-forma
-3.0% appreciation · 3.0% rent growth · sell at horizon
- IRR
- -2.3%
- Equity multiple
- 0.91×
- Total profit
- $-4,286
- Equity at exit
- $26,078
- IRR
- 7.4%
- Equity multiple
- 1.56×
- Total profit
- $27,316
- Equity at exit
- $15,122
Cash invested: $48,972 (down + closing). Projections, not guarantees.
Landlord ↔ Tenant lean methodology
- Overall (STATE)
- 90 Strongly Landlord-Friendly
- State South Carolina
- 90 Strongly Landlord-Friendly · R+6
- County
- — inherits STATE
- City
- — inherits STATE
ZIP-level market 29376
- Home prices YoY
- -25.6%
- Active inventory
- 144
- Price-to-rent
- 7.3×
Monthly cashflow live
- Estimated rent
- $2,000 medium interval (Pro) →
- Mortgage (P&I)
- −$917
- Tax from tax record
- −$213 /mo · $2,552/yr
- Insurance
- −$73
- HOA
- −$0
- Vacancy / Maint / Mgmt
- −$420
- Net cashflow
- $377
Break-even live
Sensitivity live
| Price | -10% $476 | -5% $427 | +0% $377 | +5% $328 | +10% $278 |
|---|---|---|---|---|---|
| Rent | -10% $219 | -5% $298 | +0% $377 | +5% $456 | +10% $535 |
| Rate | -1.0pp $465 | -0.5pp $422 | base $377 | +0.5pp $332 | +1.0pp $286 |
UW: 25.0% down · 7.5% · 30yr · 1.5% tax · 5.0% vac · 8.0% maint · 8.0% mgmt
Financing live
Cash to close
- Down payment
- $43,725
- Closing costs
- $5,247
- Reserves months
- —
- Total cash needed
- —
Loan-product check · same deal, 3 products live
Conventional
25% down · 7.5% · 30yr
- Down + closing
- —
- Monthly P&I
- —
- Monthly cashflow
- —
- DSCR
- —
- Eligible?
- —
Personal DTI + credit; lowest rate.
DSCR
20% down · 8.5% · 30yr
- Down + closing
- —
- Monthly P&I
- —
- Monthly cashflow
- —
- DSCR
- —
- Eligible?
- —
No personal income docs; deal must DSCR.
Hard money
10% down · 12.0% · 12mo
- Down + closing
- —
- Monthly P&I
- —
- Monthly cashflow
- —
- DSCR
- —
- Eligible?
- —
Short-term bridge; refi at stabilization.
Rent comps 1 comps
| Address | Beds | Baths | Sqft | Rent | $/sqft | DOM | Units | Dist |
|---|---|---|---|---|---|---|---|---|
| 2180 Davenport Ct Moore, SC | 3.0 | 2.0 | 1456 | $2,000 | $1.37 | 15d | 1 | 1.49mi |
Listing history 10 events
-
2026-05-01status Pending 291-char remark
Show marketing remark (291 chars)
Charming 3-bedroom, 1.5-bath brick ranch in a great location within the desirable District 6 school area. This home offers a wonderful opportunity for a rental, investment property, or for buyers ready to add a few personal touches and make it their own. Home is being sold "AS IS"
-
2026-05-01status Pending
Show marketing remark (291 chars)
Charming 3-bedroom, 1.5-bath brick ranch in a great location within the desirable District 6 school area. This home offers a wonderful opportunity for a rental, investment property, or for buyers ready to add a few personal touches and make it their own. Home is being sold "AS IS"
-
2026-04-30$174,900 Active 291-char remark
Show marketing remark (291 chars)
Charming 3-bedroom, 1.5-bath brick ranch in a great location within the desirable District 6 school area. This home offers a wonderful opportunity for a rental, investment property, or for buyers ready to add a few personal touches and make it their own. Home is being sold "AS IS"
-
2026-04-30soldstatus Closed 291-char remark
Show marketing remark (291 chars)
Charming 3-bedroom, 1.5-bath brick ranch in a great location within the desirable District 6 school area. This home offers a wonderful opportunity for a rental, investment property, or for buyers ready to add a few personal touches and make it their own. Home is being sold "AS IS"
-
2026-04-27$174,900 Active 291-char remark
Show marketing remark (291 chars)
Charming 3-bedroom, 1.5-bath brick ranch in a great location within the desirable District 6 school area. This home offers a wonderful opportunity for a rental, investment property, or for buyers ready to add a few personal touches and make it their own. Home is being sold "AS IS"
-
2026-04-26$174,900 Active
-
2020-12-02soldstatus $80,000
-
2004-03-12soldstatus $91,500
-
2004-03-12soldstatus $91,500
-
2003-12-16$94,900
ⓘ Source: listings_history table (triggers on properties + properties_extension) + one-shot
backfill from property_details.listing_events for pre-trigger history.
Tax reassessment forecast SC · Resets to sale price
- Current annual tax
- $2,552 · $213/mo
- Projected year-2 tax
- $2,552 · $213/mo
- Expected delta
- $0/yr ($0/mo · 0.0%)
ⓘ Screening estimate from a state-policy table — verify with the county assessor before closing.
Climate risk First Street
- Flood 1/10 Low FEMA zone X (unshaded) · 0% chance over 30 yrs
- Wildfire 3/10 Moderate
- Heat 6/10 Major 7 d/yr ≥105°F today · 16 d/yr by 30 yrs out
- Wind 2/10 Low 2% chance of damaging wind over 30 yrs
- Air quality 4/10 Moderate 4 unhealthy d/yr today · 5 by 30 yrs out
Nearby sold comps map
Loading sold comps map…
Walkable amenities ~0.75 mi
Loading nearby amenities…
Taxation est. · year 1
- Rental income
- $24,000
- − Mortgage interest
- −$9,797
- − Property taxes
- −$2,552
- − Insurance
- −$874
- − Repairs & maintenance
- −$1,920
- − Management
- −$1,920
- − Depreciation
- −$5,088
- Taxable income
- $1,848
- Est. tax owed @ 24.0%
- −$444
- After-tax cash flow
- $4,084/yr
For passive investors: Depreciation is non-cash, so a rental often shows a tax loss while cash-flowing — sheltering income. Rental losses are passive: they offset passive income freely, and up to $25,000/yr can offset ordinary (W-2) income if you actively participate and your MAGI is under $100k (phasing out to $0 by $150k); unused losses carry forward. On sale, claimed depreciation is recaptured at up to 25%, and gains may owe capital-gains tax (a 1031 exchange can defer both). Figures are a year-1 estimate at your 24.0% rate — not tax advice; consult a CPA.
Schools (NCES district)
- District
- Spartanburg 06
- NCES district ID
- 4503630
- Math proficiency
- 33% ▼ -8.00%
- Reading proficiency
- 42% ▼ -2.00%
- Median HH income
- $46,110
- Composite
- 32.02/100
- National rank
- #5827
- State rank
- #35 of 80 in SC
Livability — Roebuck
- Score
- 64/100
- State rank
- #147
- US rank
- #13929
Category grades
Schools grade is shown separately in the Schools card above.
Census & demographics
- Census place
- Roebuck, SC
- Population (ZIP)
- 8,722
Population outlook (Spartanburg County) Hauer SSP2
- Today (2025)
- 325,495 people
- By 2030
- 338,800 · +4.1%
- By 2040
- 363,471 · +11.7%
- By 2050
- 384,156 · +18.0%
- By 2075
- 430,137 · +32.1%
- By 2100
- 442,733 · +36.0%
Race, ethnicity, and origin ACS 2023
- Neighborhood character
- Predominantly White (70%)
- Race & ethnicity
- White 70% Black 20% Hispanic / Latino 6% Two or more races 6% Asian 1%
- Hispanic origin (detail)
- Mexican 2% Puerto Rican 2% Cuban 2%
- Common ancestry
- Lithuanian 3% Romanian 2% Scottish 1%
- Foreign-born
- 4% · Canada
- Languages at home
- 93% English-only · Spanish 4% German/W. Germanic 2% Other Indo-European 1%
Political lean MEDSL · Spartanburg
- 2024 margin
- Solid R (+33.6) · D 32.6% · R 66.2% · Other 1.2%
- 2008→2024 swing
- -12.0pp toward R · 2008: -21.6pp · 2024: -33.6pp
- All cycles
- 2024: R+33.6 2020: R+27.3 2016: R+30.0 2012: R+23.1 2008: R+21.6
Not yet ingested
- Civics
- —
Market trends
- HPI YoY
- ▼ -77.54%
- Current HPI
- 225.2259
- Rent YoY
- —
- Metro
- —
- State GDP YoY
- ▲ 4.51%
- F500 in state
- 2
Industry mix (Fortune 500 HQ in SC)
| Industry | F500 HQs | Revenue |
|---|---|---|
| Packaging | 1 | $7B |
|
||
Price history
+84.3% since first listed10 events — show timeline
- 2026-05-01 Pending — SPMLS
- 2026-05-01 Pending — Greater Greenville MLS
- 2026-04-30 Listed $174,900 SPMLS
- 2026-04-30 Sold (MLS) — SPMLS
- 2026-04-27 Listed $174,900 SPMLS
- 2026-04-26 Listed $174,900 Greater Greenville MLS
- 2020-12-02 Sold (Public Records) $80,000 Public Records
- 2004-03-12 Sold (Public Records) $91,500 Public Records
- 2004-03-12 Sold (MLS) $91,500 SPMLS
- 2003-12-16 Listed $94,900 SPMLS
Property tax history
+13.5%/yrLatest (2025): $2,552 · +0.7% YoY. Source: county tax records.
Cash-flow waterfall
monthlySold comps — $/sqft
last 12 mo · ≤1 miLoading sold comps…