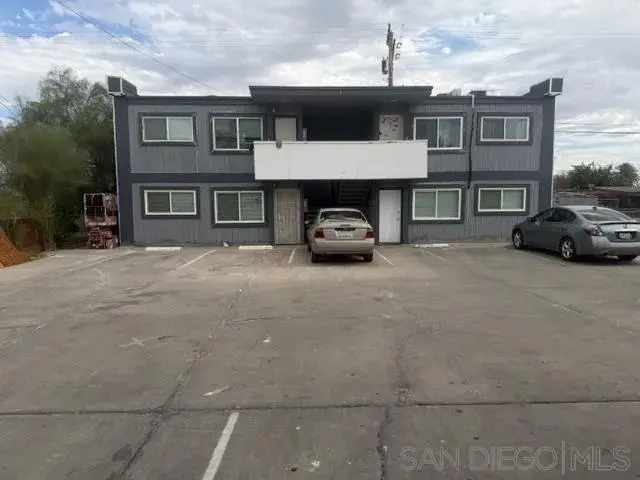
 14-Plex
700 Blair Ave · Calexico, CA
Flood risk 1/10 · Minimal
- FEMA flood zone
- X (unshaded)
- Chance of flooding over 30 yrs
- 0.0%
- Est. flood insurance / yr
- $507 – $1,088
Fire risk 3/10 · Minor
- Est. fire insurance / yr
- $659 – $1,223
Heat risk 9/10 · Severe
- Hot days now (above 113°F)
- 7 days/yr
- Hot days in 30 yrs
- 19 days/yr
Wind risk 1/10 · Minimal
- Chance of severe wind over 30 yrs
- —
Air-quality risk 4/10 · Minor
- Unhealthy air days now
- 6 days/yr
- Unhealthy air days in 30 yrs
- 7 days/yr
Risk factors via First Street. Map © Google.
Why this score? — see what drove the B- grade
The composite is a weighted blend of 9 inputs, each scored 0–100. Each bar is that input's sub-score; the figure is the points it added to the 100-point composite (weight × sub-score).
- Cash flow +30.0/30.0
- 1% rule +10.0/10.0
- DSCR +10.0/10.0
- ARV discount +7.5/15.0
- Schools +3.2/10.0
- Livability +3.2/5.0
- Rent growth +2.5/5.0
- Condition / age +2.5/5.0
- Appreciation +0.0/10.0
$1,139,000
🖨 Deal sheet (PDF) 📄 Offer letter ✓ Due diligence
Multi-family units
County records classify this as Multi-Family (5+ Unit). Listing-text estimate: 14 units. confirmed
5+ unit building — per-unit beds/baths from public records are typically unavailable; the breakdown below (if shown) is an estimate from the listing text.
Listing remarks MLS
Charming Eight-Unit Complex – All Two-Bed, One-Bath, Newly Remodeled! $115,200 annual income! Welcome to this beautifully updated eight-unit multifamily property, each unit featuring a comfortable two-bedroom, one-bath layout. Recently remodeled interiors offer modern finishes and a fresh, inviting atmosphere. With a solid cap rate around 8.00%, this property not only provides excellent rental income but also represents a fantastic investment opportunity. Don’t miss out on adding this turnkey building to your portfolio with strong returns and great curb appeal!
Key facts
- 8 parking spots
- Listed 236 days
Neighborhood map
What this means for you Summary
Snapshot
- This is a 14 × 3-bed/?-bath units multifamily listed at $1.14M.
Deal economics
- At list price, monthly cash flow is $7k ($79k/yr) — positive. Per door: $469/mo.
- The deal already cash-flows at list — no discount required.
- Meets the 1% rule at list price ($17k rent vs $1.14M).
- Recommended offer: $1.00M (12.0% below list) — sets the bar for market timing.
- Cap rate 13.2% vs local median 3.8% in Calexico — top-decile yield for the area; either an underpriced asset or a hidden risk that comps aren't pricing in. Stress-test before assuming the spread holds.
Location & tenants
- Location reads 65/100 on livability (#389 in CA) — a middle-class / working-renter tenant base. Strengths: crime A+, housing A-, amenities B+; Watch: cost of living D, schools F, commute F.
- Calexico Unified (suburban): math 29% / reading 48% proficiency, ranked #259 of 517 in CA (top 50%) — families likely to look elsewhere, expect single-tenant / working-renter base with shorter leases; 77% free/reduced lunch — lower-income household profile, screen leases tightly.
- Market conditions: 58 active listings in the ZIP; 271 units permitted in Imperial County in 2024 (112 in 5+ unit buildings).
Forward outlook
- Local home prices are declining (-3.0%/yr); year-one equity from $8k of loan paydown is wiped out by about $34k of value loss. Plan a longer hold.
- Imperial County population projected at +7% by 2050 — modest demand growth; plan on rents tracking national, not racing it.
- At projected returns (-3.0% appreciation + 3.0% rent growth), your $319k cash investment doubles in ~5 years — after that, you're playing with house money.
Negotiation context
- It's been on market 237 days — a 12% lower offer ($1.00M) is reasonable based on typical stale-listing flexibility.
- 3 sale attempts since 8y ago; this cycle's ask has dropped $160k (12%) from the opening price — seller is motivated, your offer sets the floor, not the list.
- Current owner paid $304k; list at $1.14M implies a 275% gain — meaningful room to come down on a strong offer.
Risks & watch-outs
- Climate carrying-cost: extreme-heat days projected 7→19/yr by 2055 (HVAC capex compounding) — expect insurance premiums to compound above CPI over the hold.
Questions for the listing agent
- It's been on market 237 days. Have you received any prior offers? Is the seller open to a 12% concession, seller financing, or rate buy-down credit?
- Can we see the unit-by-unit rent roll, current vacancy, and any below-market leases? What's the average tenancy length?
- What capital expenditures (roof, boiler, parking lot, exteriors) have been made in the last 5 years, and what's planned in the next 2?
- Why hasn't it sold? Are there any deal-killer items the seller is aware of (foundation, flood, title, zoning, code violations)?
- Is there a deadline driving the sale (1031 exchange, divorce, estate, relocation)? That informs how much negotiation room exists.
- Schools are F-rated, which usually means shorter tenancies and higher turnover. Who's the typical renter profile here, and what's been the actual vacancy rate?
- What's the average days-on-market for RENTAL listings here right now (not sales)? A rising rental-DOM trend means longer vacancies and softer asking-rent achievability than the comps imply.
- What's the recent tenant-quality profile in this submarket — average credit score on applications, eviction rate, late-payment / NSF rate, and stable-employment percentage? A property-management company in the area should have these aggregated.
- How much new apartment / multifamily construction is in the pipeline within 1–3 miles? Heavy new supply (>2% of stock underway) typically softens rents 12–24 months out; light construction supports rent growth.
Investment metrics
- 1% rule
- 1.53% ✓
- Cap rate
- 13.21%
- Cash-on-cash
- 24.69%
- DSCR
- 2.10
- GRM
- 5.5
CMA / ARV
- ARV (median comp)
- $536,189
- List price
- $1,139,000
- Delta
- 112.42%
- Verdict
- OVERPRICED
- Comps
- 10 within 1.0 mi
Projected returns pro-forma
-3.0% appreciation · 3.0% rent growth · sell at horizon
- IRR
- 18.1%
- Equity multiple
- 1.73×
- Total profit
- $233,187
- Equity at exit
- $169,829
- IRR
- 26.5%
- Equity multiple
- 3.32×
- Total profit
- $740,516
- Equity at exit
- $98,480
Cash invested: $318,920 (down + closing). Projections, not guarantees.
Landlord ↔ Tenant lean methodology
- Overall (STATE)
- 18 Strongly Tenant-Friendly
- State California
- 18 Strongly Tenant-Friendly · D+13
- County
- — inherits STATE
- City
- — inherits STATE
ZIP-level market 92231
- Home prices YoY
- -3.8%
- Active inventory
- 58
- Price-to-rent
- 76.4×
Monthly cashflow live
- Estimated rent
- $17,385 medium interval (Pro) →
- Mortgage (P&I)
- −$5,973
- Tax from tax record
- −$725 /mo · $8,697/yr
- Insurance
- −$475
- HOA
- −$0
- Vacancy / Maint / Mgmt
- −$3,651
- Net cashflow
- $6,562
Break-even live
Sensitivity live
| Price | -10% $7,207 | -5% $6,884 | +0% $6,562 | +5% $6,239 | +10% $5,917 |
|---|---|---|---|---|---|
| Rent | -10% $5,188 | -5% $5,875 | +0% $6,562 | +5% $7,248 | +10% $7,935 |
| Rate | -1.0pp $7,135 | -0.5pp $6,851 | base $6,562 | +0.5pp $6,267 | +1.0pp $5,966 |
14-unit breakdown (identical units grouped — click to expand)
| Units | Beds | Baths | Est. rent |
|---|---|---|---|
| 14× units | 3 | — | $17,388 |
| #1 | 3 | — | $1,242 |
| #2 | 3 | — | $1,242 |
| #3 | 3 | — | $1,242 |
| #4 | 3 | — | $1,242 |
| #5 | 3 | — | $1,242 |
| #6 | 3 | — | $1,242 |
| #7 | 3 | — | $1,242 |
| #8 | 3 | — | $1,242 |
| #9 | 3 | — | $1,242 |
| #10 | 3 | — | $1,242 |
| #11 | 3 | — | $1,242 |
| #12 | 3 | — | $1,242 |
| #13 | 3 | — | $1,242 |
| #14 | 3 | — | $1,242 |
| Total (14 units) | $17,385 | ||
UW: 25.0% down · 7.5% · 30yr · 1.5% tax · 5.0% vac · 8.0% maint · 8.0% mgmt
Financing live
Cash to close
- Down payment
- $284,750
- Closing costs
- $34,170
- Reserves months
- —
- Total cash needed
- —
Loan-product check · same deal, 3 products live
Conventional
25% down · 7.5% · 30yr
- Down + closing
- —
- Monthly P&I
- —
- Monthly cashflow
- —
- DSCR
- —
- Eligible?
- —
Personal DTI + credit; lowest rate.
DSCR
20% down · 8.5% · 30yr
- Down + closing
- —
- Monthly P&I
- —
- Monthly cashflow
- —
- DSCR
- —
- Eligible?
- —
No personal income docs; deal must DSCR.
Hard money
10% down · 12.0% · 12mo
- Down + closing
- —
- Monthly P&I
- —
- Monthly cashflow
- —
- DSCR
- —
- Eligible?
- —
Short-term bridge; refi at stabilization.
Listing history 30 events
-
2026-06-21days on market $1,139,000 Active 237 DOM
-
2026-06-19days on market $1,139,000 Active 235 DOM
-
2026-06-18days on market $1,139,000 Active 234 DOM
-
2026-06-17days on market $1,139,000 Active 233 DOM
-
2026-06-16days on market $1,139,000 Active 232 DOM
-
2026-06-15days on market $1,139,000 Active 231 DOM
-
2026-06-14days on market $1,139,000 Active 229 DOM
-
2026-06-13days on market $1,139,000 Active 228 DOM
-
2026-06-10days on market $1,139,000 Active 226 DOM
-
2026-06-09days on market $1,139,000 Active 225 DOM
-
2026-06-08days on market $1,139,000 Active 224 DOM
-
2026-06-07pricedays on market $1,139,000 Active 223 DOM
-
2026-06-05days on market $1,149,000 Active 220 DOM
-
2026-06-03days on market $1,149,000 Active 219 DOM
-
2026-06-02days on market $1,149,000 Active 218 DOM
-
2026-06-01days on market $1,149,000 Active 217 DOM
-
2026-05-31days on market $1,149,000 Active 216 DOM
-
2026-05-30days on market $1,149,000 Active 215 DOM
-
2026-03-26price $1,149,000 580-char remark
Show marketing remark (580 chars)
Charming Eight-Unit Complex – All Two-Bed, One-Bath, Newly Remodeled! $115,200 annual income! Welcome to this beautifully updated eight-unit multifamily property, each unit featuring a comfortable two-bedroom, one-bath layout. Recently remodeled interiors offer modern finishes and a fresh, inviting atmosphere. With a solid cap rate around 8.00%, this property not only provides excellent rental income but also represents a fantastic investment opportunity. Don’t miss out on adding this turnkey building to your portfolio with strong returns and great curb appeal!
-
2026-02-18price $1,175,000 580-char remark
Show marketing remark (580 chars)
Charming Eight-Unit Complex – All Two-Bed, One-Bath, Newly Remodeled! $115,200 annual income! Welcome to this beautifully updated eight-unit multifamily property, each unit featuring a comfortable two-bedroom, one-bath layout. Recently remodeled interiors offer modern finishes and a fresh, inviting atmosphere. With a solid cap rate around 8.00%, this property not only provides excellent rental income but also represents a fantastic investment opportunity. Don’t miss out on adding this turnkey building to your portfolio with strong returns and great curb appeal!
-
2026-02-05price $1,199,000 580-char remark
Show marketing remark (580 chars)
Charming Eight-Unit Complex – All Two-Bed, One-Bath, Newly Remodeled! $115,200 annual income! Welcome to this beautifully updated eight-unit multifamily property, each unit featuring a comfortable two-bedroom, one-bath layout. Recently remodeled interiors offer modern finishes and a fresh, inviting atmosphere. With a solid cap rate around 8.00%, this property not only provides excellent rental income but also represents a fantastic investment opportunity. Don’t miss out on adding this turnkey building to your portfolio with strong returns and great curb appeal!
-
2026-01-23price $1,239,000 580-char remark
Show marketing remark (580 chars)
Charming Eight-Unit Complex – All Two-Bed, One-Bath, Newly Remodeled! $115,200 annual income! Welcome to this beautifully updated eight-unit multifamily property, each unit featuring a comfortable two-bedroom, one-bath layout. Recently remodeled interiors offer modern finishes and a fresh, inviting atmosphere. With a solid cap rate around 8.00%, this property not only provides excellent rental income but also represents a fantastic investment opportunity. Don’t miss out on adding this turnkey building to your portfolio with strong returns and great curb appeal!
-
2025-11-18price $1,249,000 580-char remark
Show marketing remark (580 chars)
Charming Eight-Unit Complex – All Two-Bed, One-Bath, Newly Remodeled! $115,200 annual income! Welcome to this beautifully updated eight-unit multifamily property, each unit featuring a comfortable two-bedroom, one-bath layout. Recently remodeled interiors offer modern finishes and a fresh, inviting atmosphere. With a solid cap rate around 8.00%, this property not only provides excellent rental income but also represents a fantastic investment opportunity. Don’t miss out on adding this turnkey building to your portfolio with strong returns and great curb appeal!
-
2025-10-27$1,299,000 Active 580-char remark
Show marketing remark (580 chars)
Charming Eight-Unit Complex – All Two-Bed, One-Bath, Newly Remodeled! $115,200 annual income! Welcome to this beautifully updated eight-unit multifamily property, each unit featuring a comfortable two-bedroom, one-bath layout. Recently remodeled interiors offer modern finishes and a fresh, inviting atmosphere. With a solid cap rate around 8.00%, this property not only provides excellent rental income but also represents a fantastic investment opportunity. Don’t miss out on adding this turnkey building to your portfolio with strong returns and great curb appeal!
-
2021-10-01soldstatus $304,000
-
2018-09-24$750,000
-
2018-01-22$750,000
-
2016-10-13soldstatus $500,000
-
1989-02-13soldstatus $86,000
-
1989-02-13soldstatus $86,000
ⓘ Source: listings_history table (triggers on properties + properties_extension) + one-shot
backfill from property_details.listing_events for pre-trigger history.
Tax reassessment forecast CA · Resets to sale price
- Current annual tax
- $8,697 · $725/mo
- Projected year-2 tax
- $8,697 · $725/mo
- Expected delta
- $0/yr ($0/mo · 0.0%)
ⓘ Screening estimate from a state-policy table — verify with the county assessor before closing.
Climate risk First Street
- Flood 1/10 Low FEMA zone X (unshaded) · 0% chance over 30 yrs
- Wildfire 3/10 Moderate
- Heat 9/10 Extreme 7 d/yr ≥113°F today · 19 d/yr by 30 yrs out
- Wind 1/10 Low
- Air quality 4/10 Moderate 6 unhealthy d/yr today · 7 by 30 yrs out
Nearby sold comps map
Loading sold comps map…
Walkable amenities ~0.75 mi
Loading nearby amenities…
Taxation est. · year 1
- Rental income
- $208,620
- − Mortgage interest
- −$63,802
- − Property taxes
- −$8,697
- − Insurance
- −$5,695
- − Repairs & maintenance
- −$16,690
- − Management
- −$16,690
- − Depreciation
- −$33,135
- Taxable income
- $63,912
- Est. tax owed @ 24.0%
- −$15,339
- After-tax cash flow
- $63,402/yr
For passive investors: Depreciation is non-cash, so a rental often shows a tax loss while cash-flowing — sheltering income. Rental losses are passive: they offset passive income freely, and up to $25,000/yr can offset ordinary (W-2) income if you actively participate and your MAGI is under $100k (phasing out to $0 by $150k); unused losses carry forward. On sale, claimed depreciation is recaptured at up to 25%, and gains may owe capital-gains tax (a 1031 exchange can defer both). Figures are a year-1 estimate at your 24.0% rate — not tax advice; consult a CPA.
Schools (NCES district)
- District
- Calexico Unified
- NCES district ID
- 0606900
- Math proficiency
- 29% ▲ 7.00%
- Reading proficiency
- 48% ▲ 15.00%
- Median HH income
- $36,221
- Composite
- 31.86/100
- National rank
- #5868
- State rank
- #259 of 517 in CA
Livability — Calexico
- Score
- 65/100
- State rank
- #389
- US rank
- #13242
Category grades
Schools grade is shown separately in the Schools card above.
Census & demographics
- Census place
- Calexico, CA
- Population (ZIP)
- 38,547
Population outlook (Imperial County) Hauer SSP2
- Today (2025)
- 186,713 people
- By 2030
- 190,022 · +1.8%
- By 2040
- 195,993 · +5.0%
- By 2050
- 199,534 · +6.9%
- By 2075
- 216,878 · +16.2%
- By 2100
- 352,705 · +88.9%
Race, ethnicity, and origin ACS 2023
- Neighborhood character
- Predominantly Hispanic (98%)
- Race & ethnicity
- Hispanic / Latino 98% Two or more races 27% Asian 1% White 1%
- Hispanic origin (detail)
- Mexican 95%
- Foreign-born
- 44% · Canada, China
- Languages at home
- 7% English-only · Spanish 93%
Political lean MEDSL · Imperial
- 2024 margin
- Toss-up / Even · D 48.3% · R 49.1% · Other 2.6%
- 2008→2024 swing
- -27.0pp toward R · 2008: 26.2pp · 2024: -0.9pp
- All cycles
- 2024: R+0.9 2020: D+24.4 2016: D+41.1 2012: D+28.8 2008: D+26.2
Not yet ingested
- Civics
- —
Market trends
- HPI YoY
- ▼ -16.78%
- Current HPI
- 431.0564
- Rent YoY
- —
- Metro
- —
- State GDP YoY
- ▲ 3.21%
- F500 in state
- 116
Industry mix (Fortune 500 HQ in CA)
| Industry | F500 HQs | Revenue |
|---|---|---|
| Technology | 27 | $1,492B |
|
||
| Financial Services | 3 | $174B |
|
||
| Retail | 3 | $44B |
|
||
| Insurance | 3 | $26B |
|
||
| Media / Entertainment | 2 | $115B |
|
||
| Pharmaceuticals / Biotech | 2 | $62B |
|
||
Price history
+1236.0% since first listed12 events — show timeline
- 2026-03-26 Price Changed $1,149,000 SDMLS
- 2026-02-18 Price Changed $1,175,000 SDMLS
- 2026-02-05 Price Changed $1,199,000 SDMLS
- 2026-01-23 Price Changed $1,239,000 SDMLS
- 2025-11-18 Price Changed $1,249,000 SDMLS
- 2025-10-27 Listed $1,299,000 SDMLS
- 2021-10-01 Sold (Public Records) $304,000 Public Records
- 2018-09-24 Listed $750,000 ICAOR
- 2018-01-22 Listed $750,000 ICAOR
- 2016-10-13 Sold (Public Records) $500,000 Public Records
- 1989-02-13 Sold (Public Records) $86,000 Public Records
- 1989-02-13 Sold (Public Records) $86,000 Public Records
Property tax history
+6.1%/yrLatest (2025): $8,697 · +3.7% YoY. Source: county tax records.
Cash-flow waterfall
monthlySold comps — $/sqft
last 12 mo · ≤1 miLoading sold comps…