5094 Amber St · Bishop, TX
Flood risk 1/10 · Minimal
- FEMA flood zone
- X (unshaded)
- Chance of flooding over 30 yrs
- 0.0%
- Est. flood insurance / yr
- $507 – $1,088
Fire risk 3/10 · Minor
- Est. fire insurance / yr
- $1,222 – $2,270
Heat risk 9/10 · Severe
- Hot days now (above 110°F)
- 7 days/yr
- Hot days in 30 yrs
- 23 days/yr
Wind risk 9/10 · Severe
- Chance of severe wind over 30 yrs
- 99.0%
Air-quality risk 1/10 · Minimal
- Unhealthy air days now
- 0 days/yr
- Unhealthy air days in 30 yrs
- 0 days/yr
Risk factors via First Street. Map © Google.
Why this score? — see what drove the C grade
The composite is a weighted blend of 9 inputs, each scored 0–100. Each bar is that input's sub-score; the figure is the points it added to the 100-point composite (weight × sub-score).
- ARV discount +15.0/15.0
- Cash flow +14.6/30.0
- Appreciation +7.9/10.0
- DSCR +4.5/10.0
- Livability +3.7/5.0
- 1% rule +3.6/10.0
- Schools +3.1/10.0
- Rent growth +2.5/5.0
- Condition / age +2.5/5.0
$140,000
🖨 Deal sheet (PDF) 📄 Offer letter ✓ Due diligence
Listing remarks MLS
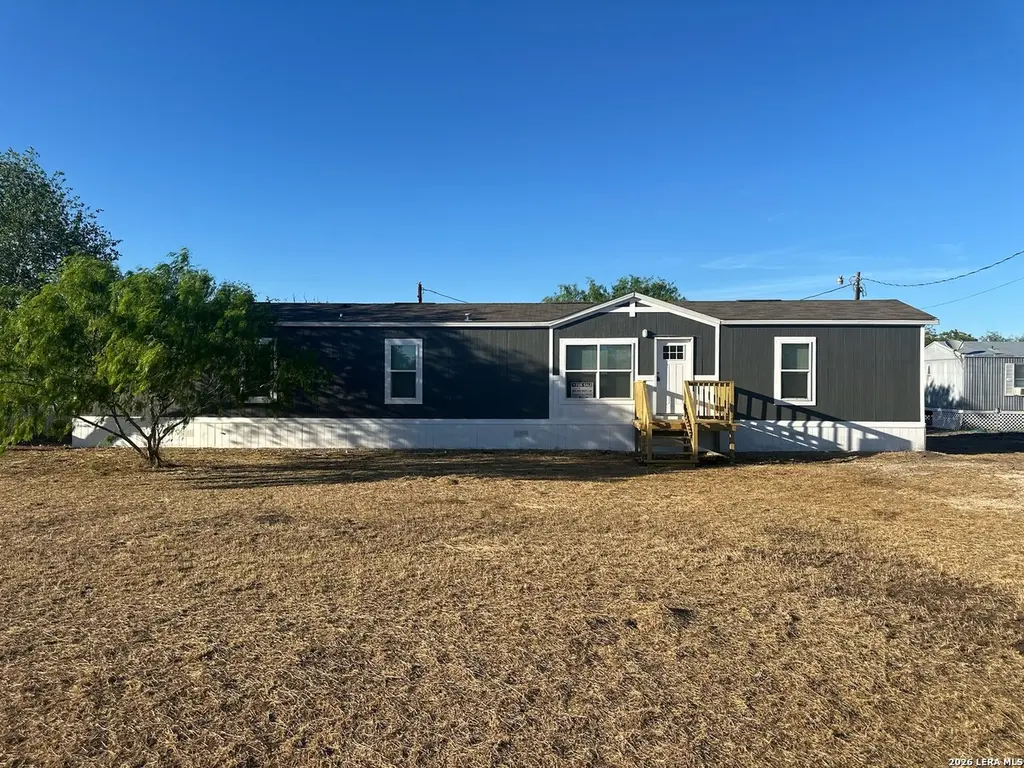
Charming 2021, 3-bedroom, 2-bath manufactured home situated on nearly half an acre in the quaint town of Bishop, TX. Enjoy the perfect blend of small-town living and spacious outdoor potential, with plenty of room for gardening, entertaining, or simply relaxing under wide Texas skies. Inside, the home offers a comfortable layout with inviting living spaces, a functional kitchen, and cozy bedrooms. Whether you're looking for a peaceful retreat or a place to grow, this property delivers both charm and opportunity.
Key facts
- 0.46 acre lot
- Built 2021
- Listed 58 days
Neighborhood map
What this means for you Summary
Snapshot
- This is a 3-bed/2.0-bath manufactured listed at $140k.
Deal economics
- At list price, monthly cash flow is $34 ($406/yr) — positive.
- The deal already cash-flows at list — no discount required.
- To meet the 1% rule (rent ≥ 1% of price), the offer needs to be $121k (13.8% below list).
- Recommended offer: $121k (13.8% below list) — sets the bar for 1% rule.
Location & tenants
- Location reads 74/100 on livability (#189 in TX, #4,857 nationally) — a middle-class / working-renter tenant base. Strengths: crime A+, cost of living A+, housing A+; Watch: amenities F, commute F, employment F.
- Bishop CISD (town): math 31% / reading 42% proficiency, ranked #486 of 826 in TX (top 59%) — families likely to look elsewhere, expect single-tenant / working-renter base with shorter leases.
- Market conditions: 39 active listings in the ZIP; 1,397 units permitted in Nueces County in 2024 (47 in 5+ unit buildings).
Forward outlook
- In year one you build about $9k of equity ($968 loan paydown + $8k appreciation (5.8% local appreciation)).
- Nueces County population projected at +36% by 2050 — long-run rental-demand tailwind backs the buy-and-hold thesis.
- At projected returns (5.8% appreciation + 3.0% rent growth), your $39k cash investment doubles in ~4 years — after that, you're playing with house money.
- By year 4, paydown + projected appreciation supports a ~$31k cash-out refi (75% LTV) — recoverable capital for the next deal without selling this one.
Negotiation context
- It's been on market 58 days — a 3% lower offer ($136k) is reasonable based on typical stale-listing flexibility.
Risks & watch-outs
- Climate carrying-cost: severe wind risk, 99% chance of damaging wind over 30y; extreme-heat days projected 7→23/yr by 2055 (HVAC capex compounding) — expect insurance premiums to compound above CPI over the hold.
Questions for the listing agent
- It's been on market 58 days. Have you received any prior offers? Is the seller open to a 14% concession, seller financing, or rate buy-down credit?
- Is there a deadline driving the sale (1031 exchange, divorce, estate, relocation)? That informs how much negotiation room exists.
- What's the average days-on-market for RENTAL listings here right now (not sales)? A rising rental-DOM trend means longer vacancies and softer asking-rent achievability than the comps imply.
- What's the recent tenant-quality profile in this submarket — average credit score on applications, eviction rate, late-payment / NSF rate, and stable-employment percentage? A property-management company in the area should have these aggregated.
- How much new for-sale + rental construction is in the pipeline within 1–3 miles? Heavy new supply typically softens prices + rents 12–24 months out; constrained supply supports both.
Investment metrics
- 1% rule
- 0.86% ✗
- Cap rate
- 6.58%
- Cash-on-cash
- 1.03%
- DSCR
- 1.05
- GRM
- 9.7
CMA / ARV
- ARV (median comp)
- $182,114
- List price
- $140,000
- Delta
- -23.13%
- Verdict
- UNDERPRICED
- Comps
- 3 within 2.0 mi
Projected returns pro-forma
5.82% appreciation · 3.0% rent growth · sell at horizon
- IRR
- 15.8%
- Equity multiple
- 2.05×
- Total profit
- $41,060
- Equity at exit
- $86,411
- IRR
- 15.9%
- Equity multiple
- 4.05×
- Total profit
- $119,479
- Equity at exit
- $155,340
Cash invested: $39,200 (down + closing). Projections, not guarantees.
Landlord ↔ Tenant lean methodology
- Overall (STATE)
- 87 Strongly Landlord-Friendly
- State Texas
- 87 Strongly Landlord-Friendly · R+5
- County
- — inherits STATE
- City
- — inherits STATE
ZIP-level market 78343
- Home prices YoY
- 5.5%
- Active inventory
- 39
- Price-to-rent
- 9.7×
Monthly cashflow live
- Estimated rent
- $1,207 medium interval (Pro) →
- Mortgage (P&I)
- −$734
- Tax from tax record
- −$127 /mo · $1,529/yr
- Insurance
- −$58
- HOA
- −$0
- Vacancy / Maint / Mgmt
- −$254
- Net cashflow
- $34
Break-even live
Sensitivity live
| Price | -10% $113 | -5% $73 | +0% $34 | +5% $-6 | +10% $-45 |
|---|---|---|---|---|---|
| Rent | -10% $-62 | -5% $-14 | +0% $34 | +5% $81 | +10% $129 |
| Rate | -1.0pp $104 | -0.5pp $69 | base $34 | +0.5pp $-2 | +1.0pp $-39 |
UW: 25.0% down · 7.5% · 30yr · 1.5% tax · 5.0% vac · 8.0% maint · 8.0% mgmt
Financing live
Cash to close
- Down payment
- $35,000
- Closing costs
- $4,200
- Reserves months
- —
- Total cash needed
- —
Loan-product check · same deal, 3 products live
Conventional
25% down · 7.5% · 30yr
- Down + closing
- —
- Monthly P&I
- —
- Monthly cashflow
- —
- DSCR
- —
- Eligible?
- —
Personal DTI + credit; lowest rate.
DSCR
20% down · 8.5% · 30yr
- Down + closing
- —
- Monthly P&I
- —
- Monthly cashflow
- —
- DSCR
- —
- Eligible?
- —
No personal income docs; deal must DSCR.
Hard money
10% down · 12.0% · 12mo
- Down + closing
- —
- Monthly P&I
- —
- Monthly cashflow
- —
- DSCR
- —
- Eligible?
- —
Short-term bridge; refi at stabilization.
Listing history 21 events
-
2026-06-18days on market $140,000 Active 58 DOM
-
2026-06-17days on market $140,000 Active 57 DOM
-
2026-06-16days on market $140,000 Active 56 DOM
-
2026-06-15days on market $140,000 Active 55 DOM
-
2026-06-14days on market $140,000 Active 53 DOM
-
2026-06-13days on market $140,000 Active 52 DOM
-
2026-06-10days on market $140,000 Active 50 DOM
-
2026-06-09days on market $140,000 Active 49 DOM
-
2026-06-08days on market $140,000 Active 48 DOM
-
2026-06-07days on market $140,000 Active 47 DOM
-
2026-06-03days on market $140,000 Active 43 DOM
-
2026-06-02days on market $140,000 Active 42 DOM
-
2026-06-01days on market $140,000 Active 41 DOM
-
2026-05-31days on market $140,000 Active 40 DOM
-
2026-05-30days on market $140,000 Active 39 DOM
-
2026-04-22price $140,000 517-char remark
Show marketing remark (517 chars)
Charming 2021, 3-bedroom, 2-bath manufactured home situated on nearly half an acre in the quaint town of Bishop, TX. Enjoy the perfect blend of small-town living and spacious outdoor potential, with plenty of room for gardening, entertaining, or simply relaxing under wide Texas skies. Inside, the home offers a comfortable layout with inviting living spaces, a functional kitchen, and cozy bedrooms. Whether you're looking for a peaceful retreat or a place to grow, this property delivers both charm and opportunity.
-
2026-04-21$179,000 New 517-char remark
Show marketing remark (517 chars)
Charming 2021, 3-bedroom, 2-bath manufactured home situated on nearly half an acre in the quaint town of Bishop, TX. Enjoy the perfect blend of small-town living and spacious outdoor potential, with plenty of room for gardening, entertaining, or simply relaxing under wide Texas skies. Inside, the home offers a comfortable layout with inviting living spaces, a functional kitchen, and cozy bedrooms. Whether you're looking for a peaceful retreat or a place to grow, this property delivers both charm and opportunity.
-
2020-03-12soldstatus
-
2020-03-05soldstatus
-
2020-03-05soldstatus
-
2018-09-19soldstatus
ⓘ Source: listings_history table (triggers on properties + properties_extension) + one-shot
backfill from property_details.listing_events for pre-trigger history.
Tax reassessment forecast TX · Resets to sale price
- Current annual tax
- $1,529 · $127/mo
- Projected year-2 tax
- $2,562 · $214/mo
- Expected delta
- +$1,033/yr (+$86/mo · 67.5%)
ⓘ Screening estimate from a state-policy table — verify with the county assessor before closing.
Climate risk First Street
- Flood 1/10 Low FEMA zone X (unshaded) · 0% chance over 30 yrs
- Wildfire 3/10 Moderate
- Heat 9/10 Extreme 7 d/yr ≥110°F today · 23 d/yr by 30 yrs out
- Wind 9/10 Extreme 99% chance of damaging wind over 30 yrs
- Air quality 1/10 Low 0 unhealthy d/yr today · 0 by 30 yrs out
Nearby sold comps map
Loading sold comps map…
Walkable amenities ~0.75 mi
Loading nearby amenities…
Taxation est. · year 1
- Rental income
- $14,487
- − Mortgage interest
- −$7,842
- − Property taxes
- −$1,529
- − Insurance
- −$700
- − Repairs & maintenance
- −$1,159
- − Management
- −$1,159
- − Depreciation
- −$4,073
- Taxable loss
- −$1,975
- Est. tax savings @ 24.0%
- +$474
- After-tax cash flow
- $880/yr
For passive investors: Depreciation is non-cash, so a rental often shows a tax loss while cash-flowing — sheltering income. Rental losses are passive: they offset passive income freely, and up to $25,000/yr can offset ordinary (W-2) income if you actively participate and your MAGI is under $100k (phasing out to $0 by $150k); unused losses carry forward. On sale, claimed depreciation is recaptured at up to 25%, and gains may owe capital-gains tax (a 1031 exchange can defer both). Figures are a year-1 estimate at your 24.0% rate — not tax advice; consult a CPA.
Schools (NCES district)
- District
- Bishop CISD
- NCES district ID
- 4810260
- Math proficiency
- 31% ▼ -33.00%
- Reading proficiency
- 42% ▼ -12.00%
- Median HH income
- $46,296
- Composite
- 31.2/100
- National rank
- #6044
- State rank
- #486 of 826 in TX
Livability — Bishop
- Score
- 74/100
- State rank
- #189
- US rank
- #4857
Category grades
Schools grade is shown separately in the Schools card above.
Census & demographics
- Population (ZIP)
- 4,565
Population outlook (Nueces County) Hauer SSP2
- Today (2025)
- 418,037 people
- By 2030
- 447,123 · +7.0%
- By 2040
- 505,911 · +21.0%
- By 2050
- 567,522 · +35.8%
- By 2075
- 729,686 · +74.6%
- By 2100
- 847,087 · +102.6%
Race, ethnicity, and origin ACS 2023
- Neighborhood character
- Predominantly Hispanic (70%)
- Race & ethnicity
- Hispanic / Latino 70% Two or more races 28% White 22% Black 7%
- Hispanic origin (detail)
- Mexican 66%
- Common ancestry
- Iranian 1% Slovak 1% Lithuanian 1%
- Foreign-born
- 8% · Canada
- Languages at home
- 60% English-only · Spanish 40%
Political lean MEDSL · Nueces
- 2024 margin
- R (+11.5) · D 43.8% · R 55.3%
- 2008→2024 swing
- -7.1pp toward R · 2008: -4.4pp · 2024: -11.5pp
- All cycles
- 2024: R+11.5 2020: R+2.9 2016: R+1.5 2012: R+3.2 2008: R+4.4
Not yet ingested
- Civics
- —
Market trends
- HPI YoY
- ▲ 5.82%
- Current HPI
- 111.5556
- Rent YoY
- —
- Metro
- —
- State GDP YoY
- ▲ 3.95%
- F500 in state
- 110
Industry mix (Fortune 500 HQ in TX)
| Industry | F500 HQs | Revenue |
|---|---|---|
| Energy | 16 | $1,198B |
|
||
| Technology | 5 | $198B |
|
||
| Engineering / Construction | 4 | $72B |
|
||
| Energy Services | 3 | $60B |
|
||
| Utilities | 3 | $41B |
|
||
| Healthcare | 2 | $330B |
|
||
Price history
-21.8% since first listed6 events — show timeline
- 2026-04-22 Price Changed $140,000 LERA
- 2026-04-21 Listed $179,000 LERA
- 2020-03-12 Sold (Public Records) — Public Records
- 2020-03-05 Sold (Public Records) — Public Records
- 2020-03-05 Sold (Public Records) — Public Records
- 2018-09-19 Sold (Public Records) — Public Records
Property tax history
+28.7%/yrLatest (2025): $1,529 · -3.6% YoY. Source: county tax records.
Cash-flow waterfall
monthlySold comps — $/sqft
last 12 mo · ≤1 miLoading sold comps…