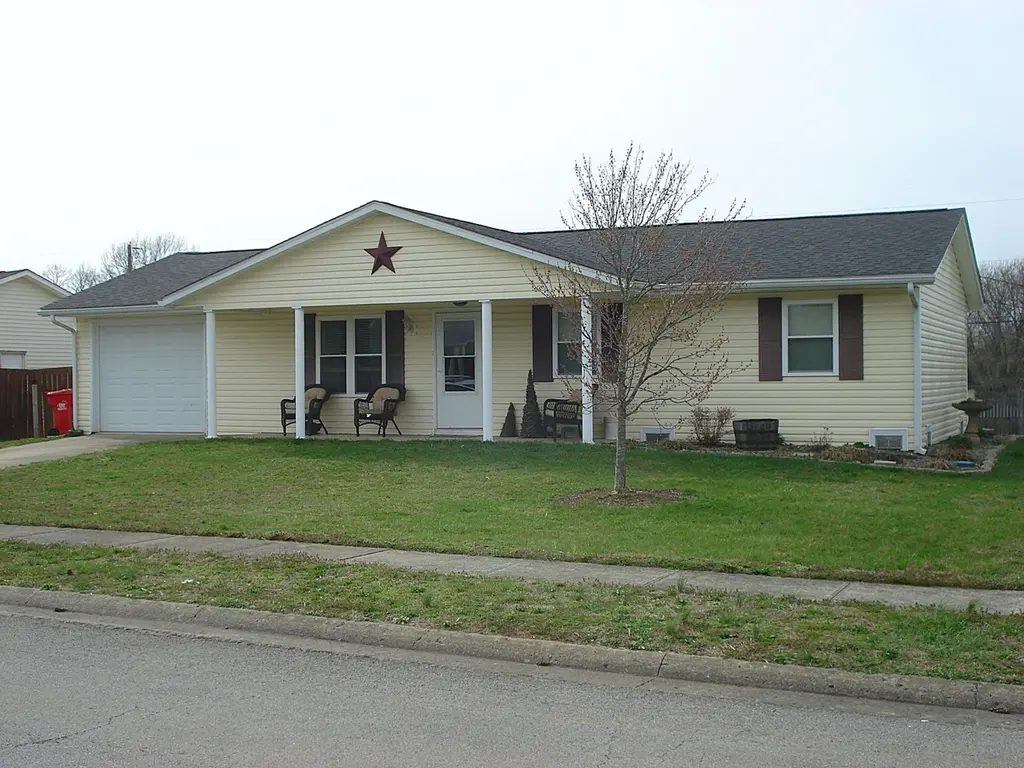
117 Leawood Dr · Cynthiana, KY
Flood risk 1/10 · Minimal
- FEMA flood zone
- X (unshaded)
- Chance of flooding over 30 yrs
- 0.0%
- Est. flood insurance / yr
- $507 – $1,088
Fire risk 2/10 · Minimal
- Est. fire insurance / yr
- $839 – $1,559
Heat risk 4/10 · Minor
- Hot days now (above 102°F)
- 7 days/yr
- Hot days in 30 yrs
- 20 days/yr
Wind risk 2/10 · Minimal
- Chance of severe wind over 30 yrs
- 3.0%
Air-quality risk 2/10 · Minimal
- Unhealthy air days now
- 1 days/yr
- Unhealthy air days in 30 yrs
- 2 days/yr
Risk factors via First Street. Map © Google.
Why this score? — see what drove the C- grade
The composite is a weighted blend of 9 inputs, each scored 0–100. Each bar is that input's sub-score; the figure is the points it added to the 100-point composite (weight × sub-score).
- Cash flow +20.9/30.0
- Appreciation +10.0/10.0
- DSCR +6.6/10.0
- 1% rule +4.4/10.0
- Livability +3.7/5.0
- Rent growth +2.5/5.0
- Condition / age +2.5/5.0
- Schools +2.2/10.0
- ARV discount +0.0/15.0
$233,000
🖨 Deal sheet 📄 Offer letter ✓ Due diligence
Listing remarks
Super nice well kept one level home in Robynwood! 3 bedrooms, 1 full bath, eat in kitchen and a one car attached garage.
Key facts
- 7,840 sq ft lot
- Garage
- Built 1991
Property features AI
Finance
- Other: Lot approximately 0.18 acres (public records); Subdivision: Robinwood; County: Harrison
Exterior
- Parking: Attached garage; Property has a garage
- Utilities: Public sewer; Cable available; Electricity available; Sewer connected; Water connected
- Home design: House; 1,008 total building area
- Construction: Vinyl siding; Dimensional style shingle roof; Block foundation; Built using standard residential construction materials
- Exterior features: Shed(s); Partial fencing; Public water (not waterfront)
Interior
- Kitchen: Microwave; Refrigerator; Range
- Bedrooms: 6 total rooms (bedrooms not specifically itemized)
- Flooring: Laminate; Tile
- Bathrooms: 1 full bathroom
- Heating & cooling: Forced air heating; Heat pump; Central air
- Interior features: Eat-in kitchen; Ceiling fan(s); Insulated windows; Blinds; Window screens; Crawl space (basement type); No fireplace
- Laundry & utility: Washer hookup (main level); Electric dryer hookup
Neighborhood map
What this means for you Summary
Snapshot
- This is a 3-bed/1.0-bath single-family listed at $233k.
Deal economics
- At list price, monthly cash flow is $324 ($4k/yr) — positive.
- The deal already cash-flows at list — no discount required.
- To meet the 1% rule (rent ≥ 1% of price), the offer needs to be $220k (5.6% below list).
- Recommended offer: $219k (6.0% below list) — sets the bar for market timing.
- Cap rate 8.0% vs local median 3.5% in Cynthiana — top-decile yield for the area; either an underpriced asset or a hidden risk that comps aren't pricing in. Stress-test before assuming the spread holds.
Location & tenants
- Location reads 74/100 on livability (#113 in KY, #4,911 nationally) — a middle-class / working-renter tenant base. Strengths: cost of living A+, housing A+, health & safety A+; Watch: amenities F, commute F, employment D-.
- Harrison County (town): math 21% / reading 32% proficiency, ranked #133 of 165 in KY (top 81%) — low school quality limits family demand, transient renter base, plan for 1-2y turnover.
- Zoned schools: Southside Elementary School (math 17% / reading 32%, grade F, #489 of 676 statewide, top 76%, 347 students, 51% FRL); Harrison County Middle School (math 19% / reading 35%, grade F, #172 of 217 statewide, top 80%, 607 students, 58% FRL); Harrison County High School (math 29% / reading 41%, grade F, #74 of 254 statewide, top 29%, 865 students, 46% FRL) — zoned schools at 51% FRL track the district average.
- Market conditions: 95 active listings in the ZIP; 1 comparable units currently listed for rent nearby; 69 units permitted in Harrison County in 2024 (0 in 5+ unit buildings).
Forward outlook
- In year one you build about $25k of equity ($2k loan paydown + $23k appreciation (10.0% local appreciation)).
- Harrison County population projected to shrink 10% by 2050 — rents likely to lag national; underwrite the cash flow, not the appreciation.
- At projected returns (10.0% appreciation + 3.0% rent growth), your $65k cash investment doubles in ~3 years — after that, you're playing with house money.
- By year 2, paydown + projected appreciation supports a ~$40k cash-out refi (75% LTV) — recoverable capital for the next deal without selling this one.
Negotiation context
- It's been on market 87 days — a 6% lower offer ($219k) is reasonable based on typical stale-listing flexibility.
- Current owner paid $113k; list at $233k implies a 106% gain — meaningful room to come down on a strong offer.
Questions for the listing agent
- It's been on market 87 days. Have you received any prior offers? Is the seller open to a 6% concession, seller financing, or rate buy-down credit?
- Why hasn't it sold? Are there any deal-killer items the seller is aware of (foundation, flood, title, zoning, code violations)?
- Is there a deadline driving the sale (1031 exchange, divorce, estate, relocation)? That informs how much negotiation room exists.
- What's the average days-on-market for RENTAL listings here right now (not sales)? A rising rental-DOM trend means longer vacancies and softer asking-rent achievability than the comps imply.
- What's the recent tenant-quality profile in this submarket — average credit score on applications, eviction rate, late-payment / NSF rate, and stable-employment percentage? A property-management company in the area should have these aggregated.
- How much new for-sale + rental construction is in the pipeline within 1–3 miles? Heavy new supply typically softens prices + rents 12–24 months out; constrained supply supports both.
Investment metrics
- 1% rule
- 0.94% ✗
- Cap rate
- 7.96%
- Cash-on-cash
- 5.95%
- DSCR
- 1.26
- GRM
- 8.8
CMA / ARV
- ARV (on-the-fly)
- $183,456
- Comps found
- 9
Show comp detail 9 sales within ~0.75 mi
| Address | Dist | Beds/Ba | Sqft | Sold | Price | $/sf | Match |
|---|---|---|---|---|---|---|---|
| 107 Stone Ave | 0.18mi | 3/1.0 | 928 (-8%) | 1mo | $180,000 | $194 | 78 |
| 128 Brooks St | 0.05mi | 3/1.0 | 1,100 (+9%) | 6mo | $198,000 | $180 | 77 |
| 112 Robynwood Dr | 0.13mi | 3/1.0 | 1,092 (+8%) | 8mo | $199,000 | $182 | 74 |
| 111 Brooks St | 0.09mi | 3/1.0 | 1,092 (+8%) | 10mo | $200,000 | $183 | 74 |
| 106 Dogwood Ct | 0.05mi | 3/1.0 | 1,092 (+8%) | 14mo | $190,000 | $174 | 72 |
| 142 S Leawood Dr | 0.17mi | 2/1.0 (-1) | 1,075 (+7%) | 5mo | $175,000 | $163 | 72 |
| 120 Robynwood Dr | 0.14mi | 3/1.0 | 1,092 (+8%) | 19mo | $190,000 | $174 | 64 |
| 213 Springdale Ave | 0.22mi | 2/1.0 (-1) | 899 (-11%) | 5mo | $177,500 | $197 | 62 |
| 106 Sherwood Dr | 0.57mi | 3/1.0 | 1,131 (+12%) | 11mo | $231,500 | $205 | 44 |
Match score weights: distance 35% · size 25% · config 20% · recency 20%. Top-matched comps best support the ARV.
Projected returns pro-forma
10.0% appreciation · 3.0% rent growth · sell at horizon
- IRR
- 28.6%
- Equity multiple
- 3.26×
- Total profit
- $147,423
- Equity at exit
- $209,905
- IRR
- 24.9%
- Equity multiple
- 7.40×
- Total profit
- $417,754
- Equity at exit
- $452,668
Cash invested: $65,240 (down + closing). Projections, not guarantees.
Landlord ↔ Tenant lean methodology
- Overall (STATE)
- 83 Strongly Landlord-Friendly
- State Kentucky
- 83 Strongly Landlord-Friendly · R+16
- County
- — inherits STATE
- City
- — inherits STATE
ZIP-level market 41031
- Home prices YoY
- 4.4%
- Active inventory
- 95
- Price-to-rent
- 8.8×
Monthly cashflow live
- Estimated rent
- $2,200 medium interval (Pro) →
- Mortgage (P&I)
- −$1,222
- Tax from tax record
- −$95 /mo · $1,145/yr
- Insurance
- −$97
- HOA
- −$0
- Vacancy / Maint / Mgmt
- −$462
- Net cashflow
- $324
Break-even live
UW: 25.0% down · 7.5% · 30yr · 1.5% tax · 5.0% vac · 8.0% maint · 8.0% mgmt
Financing live
Cash to close
- Down payment
- $58,250
- Closing costs
- $6,990
- Reserves months
- —
- Total cash needed
- —
Loan-product check · same deal, 3 products live
Conventional
25% down · 7.5% · 30yr
- Down + closing
- —
- Monthly P&I
- —
- Monthly cashflow
- —
- DSCR
- —
- Eligible?
- —
Personal DTI + credit; lowest rate.
DSCR
20% down · 8.5% · 30yr
- Down + closing
- —
- Monthly P&I
- —
- Monthly cashflow
- —
- DSCR
- —
- Eligible?
- —
No personal income docs; deal must DSCR.
Hard money
10% down · 12.0% · 12mo
- Down + closing
- —
- Monthly P&I
- —
- Monthly cashflow
- —
- DSCR
- —
- Eligible?
- —
Short-term bridge; refi at stabilization.
Rent comps 1 comps
| Address | Beds | Baths | Sqft | Rent | $/sqft | DOM | Units | Dist |
|---|---|---|---|---|---|---|---|---|
| 28 Heron Pl Cynthiana, KY | 2.0 | 2.0 | 1296 | $2,200 | $1.70 | 13d | 1 | 0.79mi |
Listing history 19 events
-
2026-06-18days on market $233,000 Active 87 DOM
-
2026-06-17days on market $233,000 Active 86 DOM
-
2026-06-16days on market $233,000 Active 85 DOM
-
2026-06-15days on market $233,000 Active 84 DOM
-
2026-06-14days on market $233,000 Active 82 DOM
-
2026-06-10days on market $233,000 Active 79 DOM
-
2026-06-09days on market $233,000 Active 78 DOM
-
2026-06-08days on market $233,000 Active 77 DOM
-
2026-06-07days on market $233,000 Active 76 DOM
-
2026-06-03days on market $233,000 Active 72 DOM
-
2026-06-02days on market $233,000 Active 71 DOM
-
2026-06-01days on market $233,000 Active 70 DOM
-
2026-05-31days on market $233,000 Active 69 DOM
-
2026-05-31days on market $233,000 Active 68 DOM
-
2026-04-14price $233,000
-
2026-03-23$238,000 Active
-
2017-10-27soldstatus $113,000
-
2017-05-22soldstatus $45,000
-
1991-06-18soldstatus $8,500
ⓘ Source: listings_history table (triggers on properties + properties_extension) + one-shot
backfill from property_details.listing_events for pre-trigger history.
Tax reassessment forecast KY · Resets to sale price
- Current annual tax
- $1,145 · $95/mo
- Projected year-2 tax
- $2,004 · $167/mo
- Expected delta
- +$859/yr (+$72/mo · 75.0%)
ⓘ Screening estimate from a state-policy table — verify with the county assessor before closing.
Climate risk First Street
- Flood 1/10 Low FEMA zone X (unshaded) · 0% chance over 30 yrs
- Wildfire 2/10 Low
- Heat 4/10 Moderate 7 d/yr ≥102°F today · 20 d/yr by 30 yrs out
- Wind 2/10 Low 3% chance of damaging wind over 30 yrs
- Air quality 2/10 Low 1 unhealthy d/yr today · 2 by 30 yrs out
Nearby sold comps map
Loading sold comps map…
Walkable amenities ~0.75 mi
Loading nearby amenities…
Taxation est. · year 1
- Rental income
- $26,400
- − Mortgage interest
- −$13,052
- − Property taxes
- −$1,145
- − Insurance
- −$1,165
- − Repairs & maintenance
- −$2,112
- − Management
- −$2,112
- − Depreciation
- −$6,778
- Taxable income
- $36
- Est. tax owed @ 24.0%
- −$9
- After-tax cash flow
- $3,875/yr
For passive investors: Depreciation is non-cash, so a rental often shows a tax loss while cash-flowing — sheltering income. Rental losses are passive: they offset passive income freely, and up to $25,000/yr can offset ordinary (W-2) income if you actively participate and your MAGI is under $100k (phasing out to $0 by $150k); unused losses carry forward. On sale, claimed depreciation is recaptured at up to 25%, and gains may owe capital-gains tax (a 1031 exchange can defer both). Figures are a year-1 estimate at your 24.0% rate — not tax advice; consult a CPA.
Schools (NCES district)
- District
- Harrison County
- NCES district ID
- 2102580
- Math proficiency
- 21% ▼ -25.00%
- Reading proficiency
- 32% ▼ -19.00%
- Median HH income
- $39,744
- Composite
- 22.28/100
- National rank
- #8138
- State rank
- #133 of 165 in KY
Livability — Cynthiana
- Score
- 74/100
- State rank
- #113
- US rank
- #4911
Category grades
Schools grade is shown separately in the Schools card above.
Census & demographics
- Census place
- Cynthiana, KY
- Population (ZIP)
- 16,748
Population outlook (Harrison County) Hauer SSP2
- Today (2025)
- 18,605 people
- By 2030
- 18,361 · -1.3%
- By 2040
- 17,685 · -4.9%
- By 2050
- 16,845 · -9.5%
- By 2075
- 14,882 · -20.0%
- By 2100
- 12,314 · -33.8%
Race, ethnicity, and origin ACS 2023
- Neighborhood character
- Predominantly White (93%)
- Race & ethnicity
- White 93% Two or more races 4% Hispanic / Latino 2% Black 2%
- Common ancestry
- Slovak 2% Serbian 2% Italian 2%
- Foreign-born
- 1% · Canada
- Languages at home
- 97% English-only · Spanish 1% German/W. Germanic 1%
Political lean MEDSL · Harrison
- 2024 margin
- Solid R (+48.5) · D 25.1% · R 73.6% · Other 1.3%
- 2008→2024 swing
- -27.4pp toward R · 2008: -21.1pp · 2024: -48.5pp
- All cycles
- 2024: R+48.5 2020: R+44.4 2016: R+43.8 2012: R+29.1 2008: R+21.1
Not yet ingested
- Civics
- —
Market trends
- HPI YoY
- ▲ 14.31%
- Current HPI
- 339.482
- Rent YoY
- —
- Metro
- —
- State GDP YoY
- ▲ 1.81%
- F500 in state
- 4
Industry mix (Fortune 500 HQ in KY)
| Industry | F500 HQs | Revenue |
|---|---|---|
| Healthcare | 1 | $118B |
|
||
| Food / Beverage | 1 | $7B |
|
||
Price history
+2641.2% since first listed5 events — show timeline
- 2026-04-14 Price Changed $233,000 ImagineMLS
- 2026-03-23 Listed $238,000 ImagineMLS
- 2017-10-27 Sold (Public Records) $113,000 Public Records
- 2017-05-22 Sold (Public Records) $45,000 Public Records
- 1991-06-18 Sold (Public Records) $8,500 Public Records
Property tax history
+6.3%/yrLatest (2025): $1,145 · -0.6% YoY. Source: county tax records.
Cash-flow waterfall
monthlySold comps — $/sqft
last 12 mo · ≤1 miLoading sold comps…