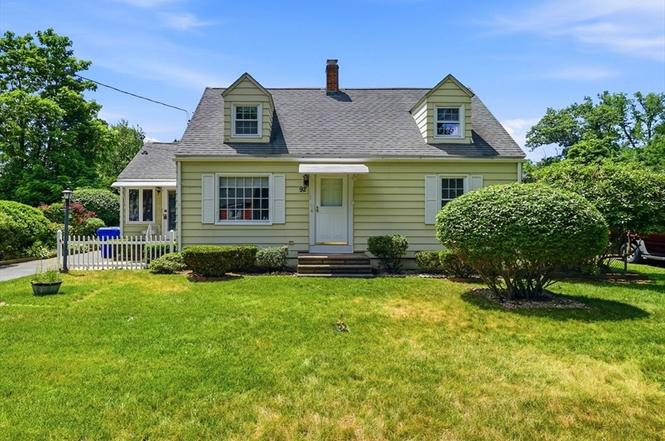
92 Massreco St · Springfield, MA
Flood risk No data
- FEMA flood zone
- —
- Chance of flooding over 30 yrs
- —
- Est. flood insurance / yr
- —
Fire risk No data
- Est. fire insurance / yr
- —
Heat risk No data
- Hot days now (above threshold)
- —
- Hot days in 30 yrs
- —
Wind risk No data
- Chance of severe wind over 30 yrs
- —
Air-quality risk No data
- Unhealthy air days now
- —
- Unhealthy air days in 30 yrs
- —
Risk factors via First Street. Map © Google.
Why this score? — see what drove the D- grade
The composite is a weighted blend of 9 inputs, each scored 0–100. Each bar is that input's sub-score; the figure is the points it added to the 100-point composite (weight × sub-score).
- ARV discount +11.2/15.0
- Cash flow +10.9/30.0
- Livability +3.7/5.0
- DSCR +3.2/10.0
- 1% rule +3.1/10.0
- Rent growth +2.5/5.0
- Condition / age +2.5/5.0
- Schools +1.6/10.0
- Appreciation +0.0/10.0
$279,900
🖨 Deal sheet (PDF) 📄 Offer letter ✓ Due diligence
Listing remarks
Charming and well-maintained Cape located in a desirable neighborhood! A welcoming front porch invites you into this spacious home featuring an eat-in kitchen, formal dining room, and comfortable living room. With 4 bedrooms, 2 full baths, and hardwood floors throughout much of the home, there is plenty of space for family and guests. The finished lower level offers a family room complete with a wet bar, providing the perfect space for entertaining, game nights, or relaxing. Enjoy outdoor living in the large fenced backyard, complete with a storage shed. Major updates include a newer furnace (2012) and hot water heater (2017) and windows. All appliances will remain for the buyer's convenien
Key facts
- Formal dining room
- Wet bar
- Front porch
Tags
Property features AI
Finance
- Other: Basement: full, partially finished, interior entry, bulkhead access, sump pump, concrete
- HOA & community: Community near shopping, parks, houses of worship, public schools and a university; Not a senior community
Exterior
- Parking: Off-street paved parking; Open parking for 4 vehicles (4 parking spaces total)
- Utilities: Public water; Public sewer; Electric with circuit breakers; Gas water heater and water heater; Utilities set up for electric range and electric dryer; washer hookup
- Home design: Single family residence; Shingle roof
- Construction: Frame construction; Block foundation; Built (year per public records)
- Exterior features: Fenced yard (fully fenced/enclosed); Rain gutters; Level lot; Paved road frontage on a public, publicly maintained road
Interior
- Kitchen: Kitchen with dining area
- Bedrooms: Main level bedroom (1) with ceiling fan, closet, hardwood and wall-to-wall carpet flooring; Second bedroom on main/first level with ceiling fan, closet, hardwood and wall-to-wall carpet flooring; Two bedrooms on second level, each with closets, custom built closet/cabinets and hardwood flooring; Master bedroom on first level with ceiling fan, closet, hardwood and wall-to-wall carpet flooring
- Flooring: Hardwood; Tile (stone/ceramic); Vinyl; Wall-to-wall carpet
- Bathrooms: Two full bathrooms; Main/first level full bathroom with tiled tub & shower, linen closet and stone/ceramic tile flooring; Second level full bathroom with shower stall, cedar closet(s) and stone/ceramic tile flooring
- Heating & cooling: Forced air heating (natural gas); Central air conditioning; Has heating and cooling
- Interior features: Mud room; Insulated windows; 7 total rooms
- Laundry & utility: Washer hookup; Electric dryer hookup; Laundry located in basement
Neighborhood map
What this means for you Summary
Snapshot
- This is a 3-bed/2.5-bath single-family listed at $280k.
Deal economics
- At list price, monthly cash flow is $-124 ($-1k/yr) — negative.
- To cash-flow at today's rent, offer at most $258k (7.8% below list).
- To meet the 1% rule (rent ≥ 1% of price), the offer needs to be $227k (18.8% below list).
- Recommended offer: $227k (18.8% below list) — sets the bar for 1% rule.
Location & tenants
- Location reads 73/100 on livability (#97 in MA) — a middle-class / working-renter tenant base. Strengths: commute A+, health & safety A+, amenities A; Watch: crime F, employment D-.
- Springfield (urban): math 13% / reading 25% proficiency, ranked #296 of 302 in MA (top 98%) — low school quality limits family demand, transient renter base, plan for 1-2y turnover; 81% free/reduced lunch — lower-income household profile, screen leases tightly.
- Zoned schools: Alfred G. Zanetti Montessori Magnet School (math 33% / reading 60%, grade D-, #405 of 938 statewide, top 44%, 434 students, 0% FRL); John F Kennedy Middle (math 5% / reading 11%, grade F, #297 of 305 statewide, top 97%, 390 students, 0% FRL); Springfield Central High (math 27% / reading 41%, grade F, #250 of 343 statewide, top 73%, 2,095 students, 0% FRL) — zoned schools average 0% FRL vs 81% district-wide (81 pts lower); this property's tenant base skews higher-income than the district average.
- Market conditions: 38 active listings in the ZIP; 4 comparable units currently listed for rent nearby; rentals lingering (median 46d on market — plan ~5-8 weeks vacancy on turnover, expect pricing pressure); 75% of comp listings sitting > 30 days — soft ceiling on asking rent; 453 units permitted in Hampden County in 2024 (116 in 5+ unit buildings).
- At $2,272/mo this rent would consume 56% of the median local household income ($48k/yr) (locally 1322% of renters already pay >50% of income on rent) — very limited rent-growth headroom before tenants either downsize or default.
Forward outlook
- Local home prices are declining (-3.0%/yr); year-one equity from $2k of loan paydown is wiped out by about $8k of value loss. Plan a longer hold.
- Hampden County population projected at +5% by 2050 — modest demand growth; plan on rents tracking national, not racing it.
Negotiation context
- Only 5 days on market — expect competitive offers; lowballing is unlikely to land.
Risks & watch-outs
- Watch-outs: built in 1949 — expect roof / HVAC / electrical / plumbing capex.
Questions for the listing agent
- What do current leases actually rent for vs. the listed asking? Can we see a recent rent roll and the last 12 months of T-12 income?
- Built in 1949 — when were the roof, HVAC, electrical panel, plumbing, and water heater last replaced?
- Is there a deadline driving the sale (1031 exchange, divorce, estate, relocation)? That informs how much negotiation room exists.
- Schools are D-rated, which usually means shorter tenancies and higher turnover. Who's the typical renter profile here, and what's been the actual vacancy rate?
- Crime grade is F in this area — have there been break-ins, vandalism, or insurance claims at this property in the last 3 years? What carrier currently insures it and at what premium?
- The area grade is low — what's the realistic commute time and amenity access for the typical tenant pool here? Any planned neighborhood developments (good or bad) we should know about?
- What's the average days-on-market for RENTAL listings here right now (not sales)? A rising rental-DOM trend means longer vacancies and softer asking-rent achievability than the comps imply.
- What's the recent tenant-quality profile in this submarket — average credit score on applications, eviction rate, late-payment / NSF rate, and stable-employment percentage? A property-management company in the area should have these aggregated.
- How much new for-sale + rental construction is in the pipeline within 1–3 miles? Heavy new supply typically softens prices + rents 12–24 months out; constrained supply supports both.
Investment metrics
- 1% rule
- 0.81% ✗
- Cap rate
- 5.76%
- Cash-on-cash
- -1.90%
- DSCR
- 0.92
- GRM
- 10.3
CMA / ARV
- ARV (on-the-fly)
- $305,230
- Comps found
- 12
Show comp detail 12 sales within ~0.75 mi
| Address | Dist | Beds/Ba | Sqft | Sold | Price | $/sf | Match |
|---|---|---|---|---|---|---|---|
| 54 Bernard St | 0.05mi | 3/1.5 | 1,298 (-1%) | 4mo | $260,000 | $200 | 89 |
| 270 Berkshire Ave | 0.24mi | 4/2.0 (+1) | 1,370 (+5%) | 2mo | $230,000 | $168 | 73 |
| 54 Seymour Ave | 0.28mi | 4/2.0 (+1) | 1,368 (+4%) | 3mo | $279,900 | $205 | 70 |
| 297 Breckwood Blvd | 0.67mi | 3/2.0 | 1,320 (+1%) | 2mo | $330,000 | $250 | 64 |
| 181 Marsden St | 0.40mi | 3/2.0 | 1,200 (-8%) | 3mo | $269,900 | $225 | 62 |
| 36 Emily St | 0.45mi | 3/1.0 | 1,250 (-5%) | 4mo | $230,000 | $184 | 62 |
| 63 Peer St | 0.61mi | 3/1.0 | 1,335 (+2%) | 3mo | $264,000 | $198 | 60 |
| 321 Rosewell St | 0.69mi | 3/3.0 | 1,288 (-2%) | 4mo | $300,000 | $233 | 60 |
| 187 Lamont St | 0.45mi | 3/1.0 | 1,142 (-13%) | 2mo | $300,000 | $263 | 50 |
| 285 Breckwood Blvd | 0.65mi | 4/2.0 (+1) | 1,440 (+10%) | 1mo | $350,000 | $243 | 45 |
| 64 Berkshire Ave | 0.56mi | 3/1.0 | 1,141 (-13%) | 1mo | $280,000 | $245 | 45 |
| 56 Rosemary Dr | 0.62mi | 3/1.0 | 1,124 (-14%) | 2mo | $310,000 | $276 | 40 |
Match score weights: distance 35% · size 25% · config 20% · recency 20%. Top-matched comps best support the ARV.
Projected returns pro-forma
-3.0% appreciation · 3.0% rent growth · sell at horizon
- IRR
- -19.4%
- Equity multiple
- 0.32×
- Total profit
- $-53,248
- Equity at exit
- $41,734
- IRR
- -12.1%
- Equity multiple
- 0.28×
- Total profit
- $-56,459
- Equity at exit
- $24,201
Cash invested: $78,372 (down + closing). Projections, not guarantees.
Landlord ↔ Tenant lean methodology
- Overall (STATE)
- 20 Strongly Tenant-Friendly
- State Massachusetts
- 20 Strongly Tenant-Friendly · D+15
- County
- — inherits STATE
- City
- — inherits STATE
ZIP-level market 01109
- Home prices YoY
- -22.8%
- Active inventory
- 38
- Price-to-rent
- 10.3×
Monthly cashflow live
- Estimated rent
- $2,272 medium interval (Pro) →
- Mortgage (P&I)
- −$1,468
- Tax from tax record
- −$335 /mo · $4,020/yr
- Insurance
- −$117
- HOA
- −$0
- Vacancy / Maint / Mgmt
- −$477
- Net cashflow
- $-124
Break-even live
Sensitivity live
| Price | -10% $34 | -5% $-45 | +0% $-124 | +5% $-204 | +10% $-283 |
|---|---|---|---|---|---|
| Rent | -10% $-304 | -5% $-214 | +0% $-124 | +5% $-35 | +10% $55 |
| Rate | -1.0pp $17 | -0.5pp $-53 | base $-124 | +0.5pp $-197 | +1.0pp $-271 |
UW: 25.0% down · 7.5% · 30yr · 1.5% tax · 5.0% vac · 8.0% maint · 8.0% mgmt
Financing live
Cash to close
- Down payment
- $69,975
- Closing costs
- $8,397
- Reserves months
- —
- Total cash needed
- —
Loan-product check · same deal, 3 products live
Conventional
25% down · 7.5% · 30yr
- Down + closing
- —
- Monthly P&I
- —
- Monthly cashflow
- —
- DSCR
- —
- Eligible?
- —
Personal DTI + credit; lowest rate.
DSCR
20% down · 8.5% · 30yr
- Down + closing
- —
- Monthly P&I
- —
- Monthly cashflow
- —
- DSCR
- —
- Eligible?
- —
No personal income docs; deal must DSCR.
Hard money
10% down · 12.0% · 12mo
- Down + closing
- —
- Monthly P&I
- —
- Monthly cashflow
- —
- DSCR
- —
- Eligible?
- —
Short-term bridge; refi at stabilization.
Rent comps 4 comps
| Address | Beds | Baths | Sqft | Rent | $/sqft | DOM | Units | Dist |
|---|---|---|---|---|---|---|---|---|
| 137 Cobb St Springfield, MA | 4.0 | 2.0 | 1500 | $2,500 | $1.67 | 45d | 1 | 0.88mi |
| 49 Riverton Rd Unit 49 Springfield, MA | 2.0 | 1.5 | 965 | $1,750 | $1.81 | 5d | 1 | 0.93mi |
| 65 Wisteria St Springfield, MA | 2.0 | 1.5 | 972 | $2,100 | $2.16 | 45d | 1 | 0.96mi |
| 63 Granger St Springfield, MA | 4.0 | 2.0 | 1200 | $2,700 | $2.25 | 45d | 1 | 1.21mi |
Listing history 4 events
-
2026-06-22statusdays on market $279,900 Active 5 DOM
-
2026-06-18days on market $279,900 New 2 DOM
-
2026-06-16remarks 699-char remark
-
2026-06-16$279,900 New 1 DOM
ⓘ Source: listings_history table (triggers on properties + properties_extension) + one-shot
backfill from property_details.listing_events for pre-trigger history.
Tax reassessment forecast MA · Partial reset (capped growth)
- Current annual tax
- $4,020 · $335/mo
- Projected year-2 tax
- $4,020 · $335/mo
- Expected delta
- $0/yr ($0/mo · 0.0%)
ⓘ Screening estimate from a state-policy table — verify with the county assessor before closing.
Nearby sold comps map
Loading sold comps map…
Walkable amenities ~0.75 mi
Loading nearby amenities…
Taxation est. · year 1
- Rental income
- $27,268
- − Mortgage interest
- −$15,679
- − Property taxes
- −$4,020
- − Insurance
- −$1,400
- − Repairs & maintenance
- −$2,181
- − Management
- −$2,181
- − Depreciation
- −$8,143
- Taxable loss
- −$6,336
- Est. tax savings @ 24.0%
- +$1,521
- After-tax cash flow
- $29/yr
For passive investors: Depreciation is non-cash, so a rental often shows a tax loss while cash-flowing — sheltering income. Rental losses are passive: they offset passive income freely, and up to $25,000/yr can offset ordinary (W-2) income if you actively participate and your MAGI is under $100k (phasing out to $0 by $150k); unused losses carry forward. On sale, claimed depreciation is recaptured at up to 25%, and gains may owe capital-gains tax (a 1031 exchange can defer both). Figures are a year-1 estimate at your 24.0% rate — not tax advice; consult a CPA.
Schools (NCES district)
- District
- Springfield
- NCES district ID
- 2511130
- Math proficiency
- 13% ▼ -12.00%
- Reading proficiency
- 25% ▼ -5.00%
- Median HH income
- $34,938
- Composite
- 15.6/100
- National rank
- #9293
- State rank
- #296 of 302 in MA
Livability — Springfield
- Score
- 73/100
- State rank
- #97
- US rank
- #5195
Category grades
Schools grade is shown separately in the Schools card above.
Census & demographics
- Census place
- Springfield, MA
- County
- Hampden County · 230,965 people
- City population
- 61,006
- Metro
- Springfield, MA
- Population (ZIP)
- 31,124
- Household income
- $48,415
- Rent vs Own
- Severe rent burden
- 1322.0
Population outlook (Hampden County) Hauer SSP2
- Today (2025)
- 485,646 people
- By 2030
- 491,517 · +1.2%
- By 2040
- 500,539 · +3.1%
- By 2050
- 508,827 · +4.8%
- By 2075
- 539,167 · +11.0%
- By 2100
- 545,698 · +12.4%
Race, ethnicity, and origin ACS 2023
- Neighborhood character
- Diverse neighborhood (Simpson 0.67)
- Race & ethnicity
- Hispanic / Latino 45% Black 31% Two or more races 20% White 18% Asian 1% Native American 1%
- Hispanic origin (detail)
- Puerto Rican 39% Dominican 3%
- Common ancestry
- Lithuanian 2% Romanian 1%
- Foreign-born
- 9% · Canada, China
- Languages at home
- 65% English-only · Spanish 32% Other Asian/Pacific 1% Russian/Polish/Slavic 1%
Political lean MEDSL · Hampden
- 2024 margin
- Lean D (+8.9) · D 53.4% · R 44.5% · Other 2.1%
- 2008→2024 swing
- -16.4pp toward R · 2008: 25.3pp · 2024: 8.9pp
- All cycles
- 2024: D+8.9 2020: D+17.7 2016: D+16.0 2012: D+25.4 2008: D+25.3
Not yet ingested
- Civics
- —
Market trends
- HPI YoY
- ▼ -113.11%
- Current HPI
- 382.9038
- Rent YoY
- —
- Metro
- Springfield, MA
- State GDP YoY
- ▲ 2.28%
- F500 in state
- 38
Industry mix (Fortune 500 HQ in MA)
| Industry | F500 HQs | Revenue |
|---|---|---|
| Technology | 3 | $17B |
|
||
| Insurance | 2 | $84B |
|
||
| Retail | 2 | $76B |
|
||
| Life Sciences | 1 | $43B |
|
||
| Energy Technology | 1 | $31B |
|
||
| Aerospace / Defense | 1 | $18B |
|
||
Price history
1 event — show timeline
- 2026-06-16 Listed $279,900 MLS PIN
Property tax history
+5.4%/yrLatest (2023): $4,020 · +32.8% YoY. Source: county tax records.
Cash-flow waterfall
monthlySold comps — $/sqft
last 12 mo · ≤1 miLoading sold comps…