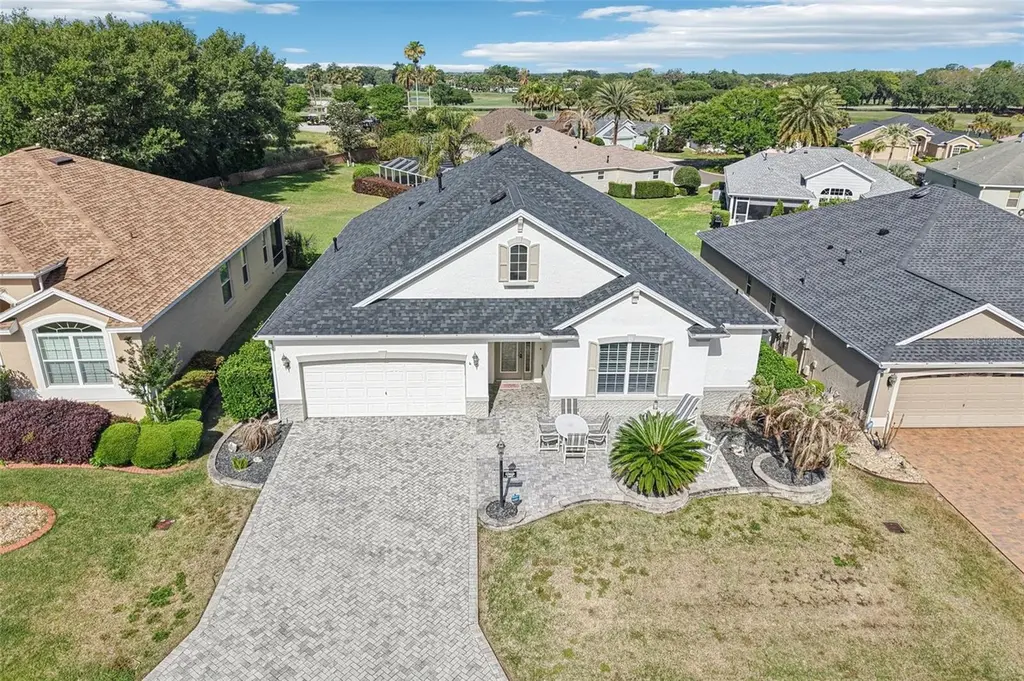
1605 Lynchburg Loop · The Villages, FL
Flood risk 1/10 · Minimal
- FEMA flood zone
- X (unshaded)
- Chance of flooding over 30 yrs
- 0.0%
- Est. flood insurance / yr
- $507 – $1,088
Fire risk 4/10 · Minor
- Est. fire insurance / yr
- $947 – $1,759
Heat risk 9/10 · Severe
- Hot days now (above 108°F)
- 7 days/yr
- Hot days in 30 yrs
- 22 days/yr
Wind risk 9/10 · Severe
- Chance of severe wind over 30 yrs
- 99.0%
Air-quality risk 3/10 · Minor
- Unhealthy air days now
- 2 days/yr
- Unhealthy air days in 30 yrs
- 3 days/yr
Risk factors via First Street. Map © Google.
Why this score? — see what drove the D- grade
The composite is a weighted blend of 9 inputs, each scored 0–100. Each bar is that input's sub-score; the figure is the points it added to the 100-point composite (weight × sub-score).
- Cash flow +11.8/30.0
- ARV discount +5.6/15.0
- Schools +5.2/10.0
- DSCR +3.5/10.0
- Rent growth +3.5/5.0
- Livability +3.5/5.0
- 1% rule +2.8/10.0
- Condition / age +2.5/5.0
- Appreciation +0.0/10.0
$515,000
🖨 Deal sheet (PDF) 📄 Offer letter ✓ Due diligence
Listing remarks
NO BOND on this Designer Block and Stucco Bridgeport model located in the Village of Mallory, offering a private setting with no rear-facing lanai. This well-maintained home features three bedrooms, two full bathrooms, and an additional half bath, providing added convenience for guests. Roof 2023, Water Heater 2023, HVAC 2018. Inside, you’ll find 10-foot ceilings throughout and textured walls that create an open and comfortable feel. The layout includes a formal dining area and an eat-in kitchen with a built-in desk space. The kitchen is equipped with maple cabinetry, pull-out shelving, and a breakfast bar. A spacious foyer welcomes you into the main living area. Flooring consists
Key facts
- Roof 2023
- Textured walls
- Water heater 2023
Tags
Property features AI
Finance
- Other: Directions available to property
- Financial info: Lease restrictions apply
- HOA & community: Community features: pool, fitness center, playground, park, dog park, golf, community mailbox, deed restrictions; Senior community; Pets allowed: cats and dogs; Association fee includes pool, maintenance of grounds, recreational facilities, and security; CDD present
Exterior
- Parking: Attached garage with 2 garage spaces
- Security: Community provides security
- Utilities: Public water; Public sewer; Electricity connected; Water connected; Sewer connected; BB/HS internet available; Underground utilities; Sprinkler meter
- Home design: Single family residence; One level; East-facing
- Construction: Vinyl siding; Shingle roof; Slab foundation; Built in public records (living area and building area provided)
- Exterior features: Front porch; Patio; Mature landscaping; Irrigation equipment
Interior
- Kitchen: Disposal; Microwave; Range; Refrigerator; Solid surface counters; Eat-in kitchen
- Bedrooms: 3 bedrooms
- Flooring: Carpet; Tile
- Bathrooms: 2 full bathrooms; 1 half bathroom
- Heating & cooling: Central heating; Central air conditioning
- Interior features: Built-in features; Ceiling fans; Eat-in kitchen; High ceilings; Open floorplan; Solid surface counters; Split bedroom layout; Walk-in closets; Window treatments
- Laundry & utility: Laundry room; Washer; Dryer; Electric water heater
Neighborhood map
What this means for you Summary
Snapshot
- This is a 3-bed/2.5-bath single-family listed at $515k.
Deal economics
- At list price, monthly cash flow is $-139 ($-2k/yr) — negative.
- To cash-flow at today's rent, offer at most $491k (4.8% below list).
- To meet the 1% rule (rent ≥ 1% of price), the offer needs to be $402k (21.9% below list).
- Recommended offer: $402k (21.9% below list) — sets the bar for 1% rule.
Location & tenants
- Location reads 70/100 on livability (#431 in FL) — a middle-class / working-renter tenant base. Strengths: crime A+, housing A, employment B+; Watch: amenities F, commute F, health & safety F.
- Sumter (rural): math 61% / reading 61% proficiency, ranked #11 of 73 in FL (top 15%) — acceptable for families but not a draw, mixed tenant base, ~2y average lease.
- Zoned schools: Wildwood Elementary School (math 49% / reading 52%, grade D+, #1,055 of 2,144 statewide, top 50%, 940 students, 76% FRL); South Sumter Middle School (math 55% / reading 54%, grade B-, #183 of 571 statewide, top 34%, 897 students, 61% FRL) — zoned schools average 68% FRL vs 51% district-wide (18 pts higher); higher-poverty schools than district average — tighter screening recommended.
- Market conditions: Rents rising (+3.9%/yr); 551 active listings in the ZIP; 4 comparable units currently listed for rent nearby; rentals at typical pace (median 23d on market — plan ~3-4 weeks tenant-placement turnaround); 3,961 units permitted in Sumter County in 2024 (248 in 5+ unit buildings).
- At $4,020/mo this rent would consume 65% of the median local household income ($74k/yr) (locally 987% of renters already pay >50% of income on rent) — very limited rent-growth headroom before tenants either downsize or default.
Forward outlook
- Local home prices are declining (-3.0%/yr); year-one equity from $4k of loan paydown is wiped out by about $15k of value loss. Plan a longer hold.
- Sumter County population projected at +45% by 2050 — long-run rental-demand tailwind backs the buy-and-hold thesis.
Negotiation context
- It's been on market 66 days — a 6% lower offer ($484k) is reasonable based on typical stale-listing flexibility.
- Current owner paid $425k; 21% above their basis — modest negotiation headroom, anchor on the comps not their cost.
Risks & watch-outs
- Climate carrying-cost: severe wind risk, 99% chance of damaging wind over 30y; extreme-heat days projected 7→22/yr by 2055 (HVAC capex compounding) — expect insurance premiums to compound above CPI over the hold.
Questions for the listing agent
- What do current leases actually rent for vs. the listed asking? Can we see a recent rent roll and the last 12 months of T-12 income?
- It's been on market 66 days. Have you received any prior offers? Is the seller open to a 22% concession, seller financing, or rate buy-down credit?
- Why hasn't it sold? Are there any deal-killer items the seller is aware of (foundation, flood, title, zoning, code violations)?
- Is there a deadline driving the sale (1031 exchange, divorce, estate, relocation)? That informs how much negotiation room exists.
- Schools are A-rated — typically a magnet for longer-tenancy family renters. What's the average tenant stay here, and is there a school-zone premium baked into asking?
- The area grade is low — what's the realistic commute time and amenity access for the typical tenant pool here? Any planned neighborhood developments (good or bad) we should know about?
- What's the average days-on-market for RENTAL listings here right now (not sales)? A rising rental-DOM trend means longer vacancies and softer asking-rent achievability than the comps imply.
- What's the recent tenant-quality profile in this submarket — average credit score on applications, eviction rate, late-payment / NSF rate, and stable-employment percentage? A property-management company in the area should have these aggregated.
- How much new for-sale + rental construction is in the pipeline within 1–3 miles? Heavy new supply typically softens prices + rents 12–24 months out; constrained supply supports both.
Investment metrics
- 1% rule
- 0.78% ✗
- Cap rate
- 5.97%
- Cash-on-cash
- -1.15%
- DSCR
- 0.95
- GRM
- 10.7
CMA / ARV
- ARV (on-the-fly)
- $494,406
- Comps found
- 12
Show comp detail 12 sales within ~0.75 mi
| Address | Dist | Beds/Ba | Sqft | Sold | Price | $/sf | Match |
|---|---|---|---|---|---|---|---|
| 1607 Mount Croghan Trl | 0.14mi | 3/2.5 | 2,075 (+2%) | 1mo | $525,000 | $253 | 90 |
| 1615 Snelling Ave | 0.19mi | 3/2.0 | 1,887 (-8%) | 0mo | $630,000 | $334 | 76 |
| 1637 Mount Croghan Trl | 0.20mi | 3/2.0 | 1,887 (-8%) | 1mo | $457,500 | $242 | 75 |
| 1466 Perry Ln | 0.29mi | 3/2.0 | 1,927 (-6%) | 2mo | $425,000 | $221 | 73 |
| 550 Little River Path | 0.54mi | 3/2.0 | 2,012 (-2%) | 3mo | $720,000 | $358 | 68 |
| 565 Society Hill Cir | 0.36mi | 3/2.0 | 1,899 (-7%) | 2mo | $600,000 | $316 | 68 |
| 778 Moore Ter | 0.56mi | 3/2.0 | 2,005 (-2%) | 2mo | $480,000 | $239 | 67 |
| 329 Bishopville Loop | 0.65mi | 3/2.5 | 2,075 (+2%) | 1mo | $475,000 | $229 | 66 |
| 1348 Honea Path | 0.54mi | 3/2.0 | 1,912 (-6%) | 0mo | $434,000 | $227 | 62 |
| 879 Astor Way | 0.53mi | 3/2.0 | 1,861 (-9%) | 2mo | $335,000 | $180 | 57 |
| 1398 Inman Mills Rd | 0.69mi | 3/2.0 | 1,912 (-6%) | 0mo | $420,000 | $220 | 55 |
| 533 Inner Cir | 0.73mi | 3/2.5 | 2,171 (+6%) | 1mo | $660,000 | $304 | 55 |
Match score weights: distance 35% · size 25% · config 20% · recency 20%. Top-matched comps best support the ARV.
Projected returns pro-forma
-3.0% appreciation · 3.92% rent growth · sell at horizon
- IRR
- -17.3%
- Equity multiple
- 0.39×
- Total profit
- $-88,613
- Equity at exit
- $76,788
- IRR
- -7.8%
- Equity multiple
- 0.49×
- Total profit
- $-73,193
- Equity at exit
- $44,528
Cash invested: $144,200 (down + closing). Projections, not guarantees.
Landlord ↔ Tenant lean methodology
- Overall (STATE)
- 87 Strongly Landlord-Friendly
- State Florida
- 87 Strongly Landlord-Friendly · R+3
- County
- — inherits STATE
- City
- — inherits STATE
ZIP-level market 32162
- Home prices YoY
- -6.9%
- Rents YoY
- 3.9%
- Active inventory
- 551
- Price-to-rent
- 10.7×
Monthly cashflow live
- Estimated rent
- $4,020 medium interval (Pro) →
- Mortgage (P&I)
- −$2,701
- Tax from tax record
- −$399 /mo · $4,785/yr
- Insurance
- −$215
- HOA
- −$0
- Vacancy / Maint / Mgmt
- −$844
- Net cashflow
- $-139
Break-even live
Sensitivity live
| Price | -10% $153 | -5% $7 | +0% $-139 | +5% $-284 | +10% $-430 |
|---|---|---|---|---|---|
| Rent | -10% $-456 | -5% $-297 | +0% $-139 | +5% $20 | +10% $179 |
| Rate | -1.0pp $121 | -0.5pp $-8 | base $-139 | +0.5pp $-272 | +1.0pp $-408 |
UW: 25.0% down · 7.5% · 30yr · 1.5% tax · 5.0% vac · 8.0% maint · 8.0% mgmt
Financing live
Cash to close
- Down payment
- $128,750
- Closing costs
- $15,450
- Reserves months
- —
- Total cash needed
- —
Loan-product check · same deal, 3 products live
Conventional
25% down · 7.5% · 30yr
- Down + closing
- —
- Monthly P&I
- —
- Monthly cashflow
- —
- DSCR
- —
- Eligible?
- —
Personal DTI + credit; lowest rate.
DSCR
20% down · 8.5% · 30yr
- Down + closing
- —
- Monthly P&I
- —
- Monthly cashflow
- —
- DSCR
- —
- Eligible?
- —
No personal income docs; deal must DSCR.
Hard money
10% down · 12.0% · 12mo
- Down + closing
- —
- Monthly P&I
- —
- Monthly cashflow
- —
- DSCR
- —
- Eligible?
- —
Short-term bridge; refi at stabilization.
Rent comps 4 comps
| Address | Beds | Baths | Sqft | Rent | $/sqft | DOM | Units | Dist |
|---|---|---|---|---|---|---|---|---|
| 898 Moses Loop The Villages, FL | 3.0 | 2.0 | 1911 | $2,600 | $1.36 | 23d | 1 | 0.67mi |
| 2111 Jem Path The Villages, FL | 3.0 | 2.0 | 2000 | $5,800 | $2.90 | 23d | 1 | 0.92mi |
| 731 Baisley Trl The Villages, FL | 2.0 | 2.0 | 1512 | $4,500 | $2.98 | 23d | 1 | 1.20mi |
| 1220 Turtle Island Rd Lady Lake, FL | 3.0 | 2.0 | 1504 | $2,000 | $1.33 | 25d | 1 | 1.31mi |
Listing history 19 events
-
2026-06-22days on market $515,000 Active 66 DOM
-
2026-06-19days on market $515,000 Active 64 DOM
-
2026-06-18days on market $515,000 Active 63 DOM
-
2026-06-17days on market $515,000 Active 62 DOM
-
2026-06-16pricedays on market $515,000 Active 61 DOM
-
2026-06-15days on market $525,000 Active 60 DOM
-
2026-06-14days on market $525,000 Active 58 DOM
-
2026-06-13days on market $525,000 Active 57 DOM
-
2026-06-10days on market $525,000 Active 55 DOM
-
2026-06-09days on market $525,000 Active 54 DOM
-
2026-06-08days on market $525,000 Active 53 DOM
-
2026-06-07days on market $525,000 Active 52 DOM
-
2026-06-02days on market $525,000 Active 47 DOM
-
2026-06-01days on market $525,000 Active 46 DOM
-
2026-05-31days on market $525,000 Active 45 DOM
-
2026-05-30days on market $525,000 Active 44 DOM
-
2026-04-16$525,000 Active
-
2023-09-21soldstatus $425,000
-
2011-05-05soldstatus $245,000
ⓘ Source: listings_history table (triggers on properties + properties_extension) + one-shot
backfill from property_details.listing_events for pre-trigger history.
Tax reassessment forecast FL · Resets to sale price
- Current annual tax
- $4,785 · $399/mo
- Projected year-2 tax
- $4,785 · $399/mo
- Expected delta
- $0/yr ($0/mo · 0.0%)
ⓘ Screening estimate from a state-policy table — verify with the county assessor before closing.
Climate risk First Street
- Flood 1/10 Low FEMA zone X (unshaded) · 0% chance over 30 yrs
- Wildfire 4/10 Moderate
- Heat 9/10 Extreme 7 d/yr ≥108°F today · 22 d/yr by 30 yrs out
- Wind 9/10 Extreme 99% chance of damaging wind over 30 yrs
- Air quality 3/10 Moderate 2 unhealthy d/yr today · 3 by 30 yrs out
Nearby sold comps map
Loading sold comps map…
Walkable amenities ~0.75 mi
Loading nearby amenities…
Taxation est. · year 1
- Rental income
- $48,235
- − Mortgage interest
- −$28,848
- − Property taxes
- −$4,785
- − Insurance
- −$2,575
- − Repairs & maintenance
- −$3,859
- − Management
- −$3,859
- − Depreciation
- −$14,982
- Taxable loss
- −$10,672
- Est. tax savings @ 24.0%
- +$2,561
- After-tax cash flow
- $899/yr
For passive investors: Depreciation is non-cash, so a rental often shows a tax loss while cash-flowing — sheltering income. Rental losses are passive: they offset passive income freely, and up to $25,000/yr can offset ordinary (W-2) income if you actively participate and your MAGI is under $100k (phasing out to $0 by $150k); unused losses carry forward. On sale, claimed depreciation is recaptured at up to 25%, and gains may owe capital-gains tax (a 1031 exchange can defer both). Figures are a year-1 estimate at your 24.0% rate — not tax advice; consult a CPA.
Schools (NCES district)
- District
- Sumter
- NCES district ID
- 1201800
- Math proficiency
- 61% ▼ -4.00%
- Reading proficiency
- 61% ▼ -2.00%
- Median HH income
- $48,240
- Composite
- 51.74/100
- National rank
- #1682
- State rank
- #11 of 73 in FL
Livability — The Villages
- Score
- 70/100
- State rank
- #431
- US rank
- #7363
Category grades
Schools grade is shown separately in the Schools card above.
Census & demographics
- Census place
- The Villages, FL
- County
- Sumter County · 110,591 people
- City population
- 83,973
- Metro
- The Villages, FL
- Population (ZIP)
- 55,424
- Household income
- $74,119
- Rent vs Own
- Severe rent burden
- 987.0
Population outlook (Sumter County) Hauer SSP2
- Today (2025)
- 161,172 people
- By 2030
- 180,083 · +11.7%
- By 2040
- 209,892 · +30.2%
- By 2050
- 234,186 · +45.3%
- By 2075
- 284,602 · +76.6%
- By 2100
- 317,039 · +96.7%
Race, ethnicity, and origin ACS 2023
- Neighborhood character
- Predominantly White (95%)
- Race & ethnicity
- White 95% Two or more races 2% Hispanic / Latino 2% Asian 1% Black 1%
- Common ancestry
- Romanian 7% Slovak 4% Lithuanian 4%
- Foreign-born
- 5% · Canada
- Languages at home
- 96% English-only · Spanish 1% Tagalog/Filipino 1%
Political lean MEDSL · Sumter
- 2024 margin
- Solid R (+37.6) · D 30.9% · R 68.6%
- 2008→2024 swing
- -10.6pp toward R · 2008: -27.0pp · 2024: -37.6pp
- All cycles
- 2024: R+37.6 2020: R+36.1 2016: R+39.2 2012: R+34.9 2008: R+27.0
Not yet ingested
- Civics
- —
Market trends
- HPI YoY
- ▼ -16.16%
- Current HPI
- 218.1956
- Rent YoY
- ▲ 3.92%
- Metro
- The Villages, FL
- State GDP YoY
- ▲ 3.28%
- F500 in state
- 36
Industry mix (Fortune 500 HQ in FL)
| Industry | F500 HQs | Revenue |
|---|---|---|
| Industrial Technology | 2 | $29B |
|
||
| Insurance | 2 | $17B |
|
||
| Retail | 1 | $60B |
|
||
| Technology Distribution | 1 | $58B |
|
||
| Homebuilding | 1 | $35B |
|
||
| Technology Manufacturing | 1 | $35B |
|
||
Price history
+114.3% since first listed3 events — show timeline
- 2026-04-16 Listed $525,000 Stellar MLS as Distributed by MLS Grid
- 2023-09-21 Sold (Public Records) $425,000 Public Records
- 2011-05-05 Sold (Public Records) $245,000 Public Records
Property tax history
+3.0%/yrLatest (2025): $4,785 · +0.3% YoY. Source: county tax records.
Cash-flow waterfall
monthlySold comps — $/sqft
last 12 mo · ≤1 miLoading sold comps…