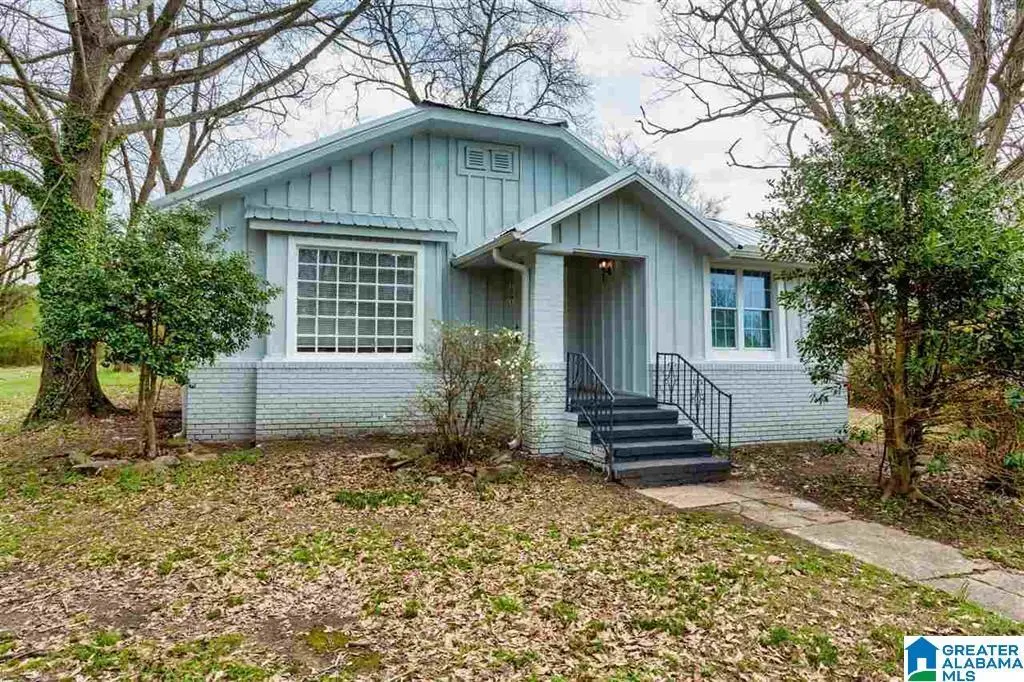
1001 3rd Ave · Pleasant Grove, AL
Flood risk 1/10 · Minimal
- FEMA flood zone
- X (unshaded)
- Chance of flooding over 30 yrs
- 0.0%
- Est. flood insurance / yr
- $507 – $1,088
Fire risk 4/10 · Minor
- Est. fire insurance / yr
- $916 – $1,700
Heat risk 6/10 · Moderate
- Hot days now (above 107°F)
- 7 days/yr
- Hot days in 30 yrs
- 18 days/yr
Wind risk 6/10 · Moderate
- Chance of severe wind over 30 yrs
- 27.0%
Air-quality risk 3/10 · Minor
- Unhealthy air days now
- 3 days/yr
- Unhealthy air days in 30 yrs
- 5 days/yr
Risk factors via First Street. Map © Google.
Why this score? — see what drove the D+ grade
The composite is a weighted blend of 9 inputs, each scored 0–100. Each bar is that input's sub-score; the figure is the points it added to the 100-point composite (weight × sub-score).
- Cash flow +15.1/30.0
- ARV discount +12.8/15.0
- DSCR +4.6/10.0
- 1% rule +3.7/10.0
- Livability +3.1/5.0
- Rent growth +2.5/5.0
- Condition / age +2.5/5.0
- Schools +1.8/10.0
- Appreciation +0.0/10.0
$165,000
🖨 Deal sheet 📄 Offer letter ✓ Due diligence
Listing remarks MLS
Terrific investment property, 3/2, large living room, separate dining room, open floor plan. Level backyard, perfect for cooking out.
Key facts
- 0.43 acre lot
- Built 1910
- Listed 42 days
Property features AI
Finance
- Other: Property access via paved, public road; Approximately 0.43 acre lot; Flood plain: no
- HOA & community: No association fees
Exterior
- Parking: On-street parking
- Utilities: Public water; Septic sewer; Electric water heater; Internet service available
- Home design: Existing (previously built) property; 1 side brick and wood siding construction
- Construction: Crawl space foundation
- Exterior features: Front porch; No pool; No patio or deck; Not waterfront; Lot view: none
Interior
- Kitchen: Electric cooktop; Electric oven; Refrigerator
- Bedrooms: Three bedrooms on the main level
- Flooring: Hardwood laminate flooring; Tile flooring
- Bathrooms: Two full bathrooms total; Baths feature tub/shower combos
- Heating & cooling: Central heating; Central cooling
- Interior features: Stone kitchen countertops; Window treatments remain; Attic present (other); Ceilings: other (see remarks); No additional interior features listed
- Laundry & utility: Washer hookup; Electric dryer hookup; Laundry located on the main level
Neighborhood map
What this means for you Summary
Snapshot
- This is a 2-bed/2.0-bath single-family listed at $165k.
Deal economics
- At list price, monthly cash flow is $55 ($656/yr) — positive.
- The deal already cash-flows at list — no discount required.
- To meet the 1% rule (rent ≥ 1% of price), the offer needs to be $143k (13.1% below list).
- Recommended offer: $143k (13.1% below list) — sets the bar for 1% rule.
Location & tenants
- Location reads 62/100 on livability (#211 in AL) — a middle-class / working-renter tenant base. Strengths: cost of living A+, housing A+, crime A; Watch: amenities F, commute F, health & safety F.
- Jefferson County (suburban): math 9% / reading 32% proficiency, ranked #104 of 129 in AL (top 81%) — low school quality limits family demand, transient renter base, plan for 1-2y turnover.
- Zoned schools: Pleasant Grove Elementary School (math 2% / reading 28%, grade F, #505 of 627 statewide, top 81%, 616 students, 54% FRL); Pleasant Grove High School (math 0% / reading 18%, grade F, #260 of 305 statewide, top 85%, 729 students, 57% FRL).
- Market conditions: 56 active listings in the ZIP; 5 comparable units currently listed for rent nearby; rentals at typical pace (median 21d on market — plan ~3-4 weeks tenant-placement turnaround); 2,114 units permitted in Jefferson County in 2024 (556 in 5+ unit buildings).
Forward outlook
- Local home prices are declining (-3.0%/yr); year-one equity from $1k of loan paydown is wiped out by about $5k of value loss. Plan a longer hold.
- Jefferson County population projected to shrink 4% by 2050 — rents likely to lag national; underwrite the cash flow, not the appreciation.
Negotiation context
- It's been on market 42 days — a 3% lower offer ($160k) is reasonable based on typical stale-listing flexibility.
- 6 sale attempts since 13y ago with the ask held roughly flat each time — persistent listings suggest the price (not the market) is what's stuck; bring a comps-based counter.
- Current owner paid $75k; list at $165k implies a 120% gain — meaningful room to come down on a strong offer.
Risks & watch-outs
- Watch-outs: built in 1910 — expect roof / HVAC / electrical / plumbing capex.
- Climate carrying-cost: major wind risk, 27% chance of damaging wind over 30y; extreme-heat days projected 7→18/yr by 2055 (HVAC capex compounding) — expect insurance premiums to compound above CPI over the hold.
Questions for the listing agent
- It's been on market 42 days. Have you received any prior offers? Is the seller open to a 13% concession, seller financing, or rate buy-down credit?
- Built in 1910 — when were the roof, HVAC, electrical panel, plumbing, and water heater last replaced?
- Is there a deadline driving the sale (1031 exchange, divorce, estate, relocation)? That informs how much negotiation room exists.
- The area grade is low — what's the realistic commute time and amenity access for the typical tenant pool here? Any planned neighborhood developments (good or bad) we should know about?
- What's the average days-on-market for RENTAL listings here right now (not sales)? A rising rental-DOM trend means longer vacancies and softer asking-rent achievability than the comps imply.
- What's the recent tenant-quality profile in this submarket — average credit score on applications, eviction rate, late-payment / NSF rate, and stable-employment percentage? A property-management company in the area should have these aggregated.
- How much new for-sale + rental construction is in the pipeline within 1–3 miles? Heavy new supply typically softens prices + rents 12–24 months out; constrained supply supports both.
Investment metrics
- 1% rule
- 0.87% ✗
- Cap rate
- 6.69%
- Cash-on-cash
- 1.42%
- DSCR
- 1.06
- GRM
- 9.6
CMA / ARV
- ARV (median comp)
- $187,106
- List price
- $165,000
- Delta
- -11.81%
- Verdict
- UNDERPRICED
- Comps
- 20 within 1.0 mi
Show comp detail 7 sales within ~0.75 mi
| Address | Dist | Beds/Ba | Sqft | Sold | Price | $/sf | Match |
|---|---|---|---|---|---|---|---|
| 324 10th Way | 0.10mi | 3/2.0 (+1) | 1,150 (-8%) | 4mo | $160,000 | $139 | 74 |
| 912 2nd Ave | 0.08mi | 3/1.0 (+1) | 1,288 (+4%) | 9mo | $124,000 | $96 | 74 |
| 209 Park Pl | 0.39mi | 3/2.0 (+1) | 1,270 (+2%) | 3mo | $192,000 | $151 | 71 |
| 115 5th Way | 0.61mi | 3/1.5 (+1) | 1,250 (+0%) | 8mo | $125,000 | $100 | 57 |
| 112 9th St | 0.17mi | 3/1.0 (+1) | 1,302 (+5%) | 24mo | $181,900 | $140 | 56 |
| 168 Park Rd | 0.52mi | 2/1.0 | 1,120 (-10%) | 20mo | $125,000 | $112 | 38 |
| 1132 1st Ave | 0.37mi | 3/1.5 (+1) | 1,375 (+10%) | 24mo | $223,000 | $162 | 38 |
Match score weights: distance 35% · size 25% · config 20% · recency 20%. Top-matched comps best support the ARV.
Projected returns pro-forma
-3.0% appreciation · 3.0% rent growth · sell at horizon
- IRR
- -14.1%
- Equity multiple
- 0.50×
- Total profit
- $-23,272
- Equity at exit
- $24,602
- IRR
- -5.3%
- Equity multiple
- 0.66×
- Total profit
- $-15,848
- Equity at exit
- $14,266
Cash invested: $46,200 (down + closing). Projections, not guarantees.
Landlord ↔ Tenant lean methodology
- Overall (STATE)
- 90 Strongly Landlord-Friendly
- State Alabama
- 90 Strongly Landlord-Friendly · R+15
- County
- — inherits STATE
- City
- — inherits STATE
ZIP-level market 35127
- Home prices YoY
- -32.6%
- Active inventory
- 56
- Price-to-rent
- 9.6×
Monthly cashflow live
- Estimated rent
- $1,434 high interval (Pro) →
- Mortgage (P&I)
- −$865
- Tax from tax record
- −$144 /mo · $1,730/yr
- Insurance
- −$69
- HOA
- −$0
- Vacancy / Maint / Mgmt
- −$301
- Net cashflow
- $55
Break-even live
UW: 25.0% down · 7.5% · 30yr · 1.5% tax · 5.0% vac · 8.0% maint · 8.0% mgmt
Financing live
Cash to close
- Down payment
- $41,250
- Closing costs
- $4,950
- Reserves months
- —
- Total cash needed
- —
Loan-product check · same deal, 3 products live
Conventional
25% down · 7.5% · 30yr
- Down + closing
- —
- Monthly P&I
- —
- Monthly cashflow
- —
- DSCR
- —
- Eligible?
- —
Personal DTI + credit; lowest rate.
DSCR
20% down · 8.5% · 30yr
- Down + closing
- —
- Monthly P&I
- —
- Monthly cashflow
- —
- DSCR
- —
- Eligible?
- —
No personal income docs; deal must DSCR.
Hard money
10% down · 12.0% · 12mo
- Down + closing
- —
- Monthly P&I
- —
- Monthly cashflow
- —
- DSCR
- —
- Eligible?
- —
Short-term bridge; refi at stabilization.
Rent comps 5 comps
| Address | Beds | Baths | Sqft | Rent | $/sqft | DOM | Units | Dist |
|---|---|---|---|---|---|---|---|---|
| 120 6th St Pleasant Grove, AL | 3.0 | 2.0 | 1425 | $1,375 | $0.96 | 23d | 1 | 0.59mi |
| 1133 7th Ave Pleasant Grove, AL | 3.0 | 2.0 | 1104 | $1,250 | $1.13 | 14d | 1 | 0.73mi |
| 1207 7th Ave Pleasant Grove, AL | 3.0 | 1.0 | 1362 | $1,601 | $1.18 | 1d | 1 | 0.77mi |
| 713 10th Ln Pleasant Grove, AL | 3.0 | 2.0 | 1400 | $1,595 | $1.14 | 43d | 1 | 1.27mi |
| 704 3rd St Pleasant Grove, AL | 3.0 | 2.0 | 1194 | $1,350 | $1.13 | 21d | 1 | 1.36mi |
Listing history 35 events
-
2026-06-18days on market $165,000 Active 42 DOM
-
2026-06-17days on market $165,000 Active 41 DOM
-
2026-06-16days on market $165,000 Active 40 DOM
-
2026-06-15days on market $165,000 Active 39 DOM
-
2026-06-13days on market $165,000 Active 37 DOM
-
2026-06-10days on market $165,000 Active 34 DOM
-
2026-06-09days on market $165,000 Active 33 DOM
-
2026-06-08days on market $165,000 Active 32 DOM
-
2026-06-07days on market $165,000 Active 31 DOM
-
2026-06-03days on market $165,000 Active 27 DOM
-
2026-06-02days on market $165,000 Active 26 DOM
-
2026-06-01days on market $165,000 Active 25 DOM
-
2026-05-31days on market $165,000 Active 24 DOM
-
2026-05-07$165,000 Active 173-char remark
-
2025-11-13historical $1,195
-
2025-10-16price $1,195
-
2025-07-19$1,295
-
2024-01-22historical $1,125
-
2024-01-20$1,125
-
2024-01-20historical $1,125
-
2024-01-11price $1,125
-
2023-12-30$1,133
-
2020-01-23soldstatus $75,000
-
2020-01-20soldstatus $34,500 Sold 133-char remark
Show marketing remark (133 chars)
Terrific investment property, 3/2, large living room, separate dining room, open floor plan. Level backyard, perfect for cooking out.
-
2019-12-24status Pending 133-char remark
Show marketing remark (133 chars)
Terrific investment property, 3/2, large living room, separate dining room, open floor plan. Level backyard, perfect for cooking out.
-
2019-12-19historical Contingent 133-char remark
Show marketing remark (133 chars)
Terrific investment property, 3/2, large living room, separate dining room, open floor plan. Level backyard, perfect for cooking out.
-
2019-12-13$34,500 Active 133-char remark
Show marketing remark (133 chars)
Terrific investment property, 3/2, large living room, separate dining room, open floor plan. Level backyard, perfect for cooking out.
-
2019-12-12soldstatus $114,000
-
2018-08-20soldstatus $32,969,600
-
2014-05-28soldstatus $45,000
-
2014-05-23soldstatus $45,000
Show marketing remark (53 chars)
This house is occupied but can be show without notice
-
2013-04-17$56,700
Show marketing remark (53 chars)
This house is occupied but can be show without notice
-
2007-08-15soldstatus $27,500
-
2005-10-26soldstatus $90,000
-
1998-08-12soldstatus $47,500
ⓘ Source: listings_history table (triggers on properties + properties_extension) + one-shot
backfill from property_details.listing_events for pre-trigger history.
Tax reassessment forecast AL · Resets to sale price
- Current annual tax
- $1,730 · $144/mo
- Projected year-2 tax
- $1,730 · $144/mo
- Expected delta
- $0/yr ($0/mo · 0.0%)
ⓘ Screening estimate from a state-policy table — verify with the county assessor before closing.
Climate risk First Street
- Flood 1/10 Low FEMA zone X (unshaded) · 0% chance over 30 yrs
- Wildfire 4/10 Moderate
- Heat 6/10 Major 7 d/yr ≥107°F today · 18 d/yr by 30 yrs out
- Wind 6/10 Major 27% chance of damaging wind over 30 yrs
- Air quality 3/10 Moderate 3 unhealthy d/yr today · 5 by 30 yrs out
Nearby sold comps map
Loading sold comps map…
Walkable amenities ~0.75 mi
Loading nearby amenities…
Taxation est. · year 1
- Rental income
- $17,208
- − Mortgage interest
- −$9,243
- − Property taxes
- −$1,730
- − Insurance
- −$825
- − Repairs & maintenance
- −$1,377
- − Management
- −$1,377
- − Depreciation
- −$4,800
- Taxable loss
- −$2,143
- Est. tax savings @ 24.0%
- +$514
- After-tax cash flow
- $1,170/yr
For passive investors: Depreciation is non-cash, so a rental often shows a tax loss while cash-flowing — sheltering income. Rental losses are passive: they offset passive income freely, and up to $25,000/yr can offset ordinary (W-2) income if you actively participate and your MAGI is under $100k (phasing out to $0 by $150k); unused losses carry forward. On sale, claimed depreciation is recaptured at up to 25%, and gains may owe capital-gains tax (a 1031 exchange can defer both). Figures are a year-1 estimate at your 24.0% rate — not tax advice; consult a CPA.
Schools (NCES district)
- District
- Jefferson County
- NCES district ID
- 0101920
- Math proficiency
- 9% ▼ -24.00%
- Reading proficiency
- 32% ▼ -5.00%
- Median HH income
- $51,712
- Composite
- 18.4/100
- National rank
- #8937
- State rank
- #104 of 129 in AL
Livability — Pleasant Grove
- Score
- 62/100
- State rank
- #211
- US rank
- #16232
Category grades
Schools grade is shown separately in the Schools card above.
Census & demographics
- Census place
- Pleasant Grove, AL
- County
- Jefferson County · 527,445 people
- City population
- 9,442
- Metro
- Birmingham-Hoover, AL
- Population (ZIP)
- 9,442
- Household income
- $70,317
- Rent vs Own
- Severe rent burden
- 198.0
Population outlook (Jefferson County) Hauer SSP2
- Today (2025)
- 669,185 people
- By 2030
- 669,694 · +0.1%
- By 2040
- 661,388 · -1.2%
- By 2050
- 643,086 · -3.9%
- By 2075
- 577,267 · -13.7%
- By 2100
- 474,758 · -29.1%
Race, ethnicity, and origin ACS 2023
- Neighborhood character
- Predominantly Black (68%)
- Race & ethnicity
- Black 68% White 29% Two or more races 1% Hispanic / Latino 1%
- Common ancestry
- Slovak 1% Italian 1% Serbian 1%
- Foreign-born
- 1% · Canada
- Languages at home
- 98% English-only · Spanish 2%
Political lean MEDSL · Jefferson
- 2024 margin
- D (+10.4) · D 54.6% · R 44.2% · Other 1.2%
- 2008→2024 swing
- +5.4pp toward D · 2008: 5.1pp · 2024: 10.4pp
- All cycles
- 2024: D+10.4 2020: D+13.2 2016: D+7.2 2012: D+6.0 2008: D+5.1
Not yet ingested
- Civics
- —
Market trends
- HPI YoY
- ▼ -98.05%
- Current HPI
- 202.2294
- Rent YoY
- —
- Metro
- Birmingham-Hoover, AL
- State GDP YoY
- ▲ 2.94%
- F500 in state
- 4
Industry mix (Fortune 500 HQ in AL)
| Industry | F500 HQs | Revenue |
|---|---|---|
| Financial Services | 1 | $8B |
|
||
| Healthcare | 1 | $5B |
|
||
Price history
+247.4% since first listed22 events — show timeline
- 2026-05-07 Listed $165,000 Greater Alabama MLS
- 2025-11-13 Rental Removed $1,195 GALMLS
- 2025-10-16 Price Changed $1,195 GALMLS
- 2025-07-19 Listed for Rent $1,295 GALMLS
- 2024-01-22 Rental Removed $1,125 BUILDIUM
- 2024-01-20 Listed for Rent $1,125 BUILDIUM
- 2024-01-20 Rental Removed $1,125 GALMLS
- 2024-01-11 Price Changed $1,125 GALMLS
- 2023-12-30 Listed for Rent $1,133 GALMLS
- 2020-01-23 Sold (Public Records) $75,000 Public Records
- 2020-01-20 Sold (MLS) $34,500 Greater Alabama MLS
- 2019-12-24 Pending — Greater Alabama MLS
- 2019-12-19 Contingent — Greater Alabama MLS
- 2019-12-13 Listed $34,500 Greater Alabama MLS
- 2019-12-12 Sold (Public Records) $114,000 Public Records
- 2018-08-20 Sold (Public Records) $32,969,600 Public Records
- 2014-05-28 Sold (Public Records) $45,000 Public Records
- 2014-05-23 Sold (MLS) $45,000 Greater Alabama MLS
- 2013-04-17 Listed $56,700 Greater Alabama MLS
- 2007-08-15 Sold (Public Records) $27,500 Public Records
- 2005-10-26 Sold (Public Records) $90,000 Public Records
- 1998-08-12 Sold (Public Records) $47,500 Public Records
Property tax history
+10.7%/yrLatest (2025): $1,730 · +6.9% YoY. Source: county tax records.
Cash-flow waterfall
monthlySold comps — $/sqft
last 12 mo · ≤1 miLoading sold comps…