4 Tarot Ct Unit 41 Tarot Court, Lot /41 · Salem, PA
Flood risk 1/10 · Minimal
- FEMA flood zone
- X (unshaded)
- Chance of flooding over 30 yrs
- 0.0%
- Est. flood insurance / yr
- $473 – $860
Fire risk 1/10 · Minimal
- Est. fire insurance / yr
- $511 – $949
Heat risk 2/10 · Minimal
- Hot days now (above 90°F)
- 7 days/yr
- Hot days in 30 yrs
- 16 days/yr
Wind risk 2/10 · Minimal
- Chance of severe wind over 30 yrs
- 4.0%
Air-quality risk 2/10 · Minimal
- Unhealthy air days now
- 1 days/yr
- Unhealthy air days in 30 yrs
- 2 days/yr
Risk factors via First Street. Map © Google.
Why this score? — see what drove the C+ grade
The composite is a weighted blend of 9 inputs, each scored 0–100. Each bar is that input's sub-score; the figure is the points it added to the 100-point composite (weight × sub-score).
- Cash flow +16.0/30.0
- ARV discount +15.0/15.0
- Appreciation +10.0/10.0
- 1% rule +5.4/10.0
- DSCR +4.9/10.0
- Schools +4.4/10.0
- Condition / age +4.0/5.0
- Rent growth +2.5/5.0
- Livability +2.5/5.0
$250,000
🖨 Deal sheet 📄 Offer letter ✓ Due diligence
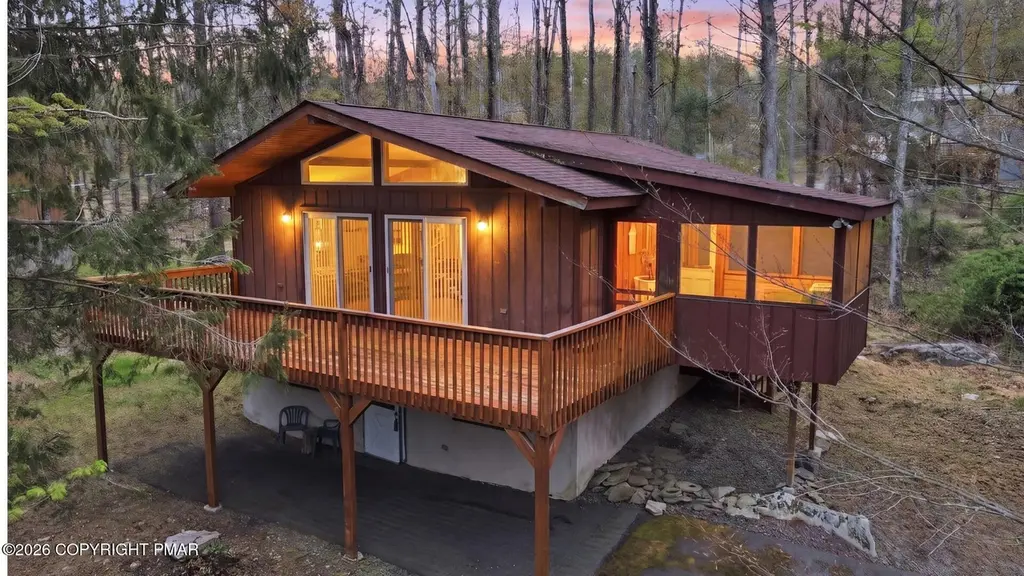
Listing remarks
If you grew up in the 1970s, this 4-bedroom chalet in The Hideout might feel wonderfully familiar (sorry, 70s purists: no shag carpet though). Located in one of the Northern Poconos' premier gated lake communities, this vintage home blends nostalgic charm with a warm, well-maintained interior just minutes from lakes, pools, skiing, and golf. Built in 1974, the original harvest gold kitchen remains beautifully preserved and in genuinely excellent condition; a rare mid-century time capsule lovingly cared for over the years. Cathedral ceilings, pine floors, wood paneling, & sliders create the classic mountain vibe buyers search for when looking for a getaway, vacation home, or weekend cab
Key facts
- Cathedral ceilings
- Harvest gold kitchen
- Paved driveway
Tags
Property features AI
Finance
- Other: Road is private and maintained via a road maintenance agreement
- HOA & community: Homeowners association with amenities including gated entry, security, clubhouse, pool, fitness center, playground, trails, courts (tennis, basketball, racquetball), recreation/game rooms, meeting/party rooms, billiards, dog park, workshop area and golf course access; Annual association fee
Exterior
- Parking: Driveway; Off-street paved parking
- Utilities: Private water; Private sewer; Cable connected
- Home design: Single-family house; East-facing
- Construction: Shingle roof
- Exterior features: Rain gutters; Porch, side porch, deck and screened porch
Interior
- Kitchen: Electric range; Refrigerator; Water heater
- Basement: Finished full daylight basement with interior and exterior entry and walk-out access
- Bedrooms: Total rooms: 7
- Flooring: Carpet; Wood
- Bathrooms: 2 full bathrooms
- Heating & cooling: Electric baseboard heating; Ceiling fan cooling
- Interior features: Eat-in kitchen; Cathedral and high ceilings; Open floor plan; Ceiling fans
- Laundry & utility: Washer and dryer; Laundry closet on lower level
Neighborhood map
What this means for you Summary
Snapshot
- This is a 4-bed/2.0-bath single-family listed at $250k. Condition is rated good.
Deal economics
- At list price, monthly cash flow is $124 ($1k/yr) — positive.
- The deal already cash-flows at list — no discount required.
- Meets the 1% rule at list price ($3k rent vs $250k).
- Recommended offer: $242k (3.0% below list) — sets the bar for market timing.
Location & tenants
- Location reads: area grade C — affects rentability + tenant quality, not the cash-flow math above.
- Western Wayne SD (rural): math 39% / reading 63% proficiency, ranked #165 of 539 in PA (top 31%) — acceptable for families but not a draw, mixed tenant base, ~2y average lease.
- Market conditions: 337 active listings in the ZIP; 177 units permitted in Wayne County in 2024 (0 in 5+ unit buildings).
Forward outlook
- In year one you build about $27k of equity ($2k loan paydown + $25k appreciation (10.0% local appreciation)).
- Wayne County population projected at -17% by 2050 — secular population decline; favor cash flow + early exit over multi-decade hold.
- At projected returns (10.0% appreciation + 3.0% rent growth), your $70k cash investment doubles in ~3 years — after that, you're playing with house money.
- By year 2, paydown + projected appreciation supports a ~$43k cash-out refi (75% LTV) — recoverable capital for the next deal without selling this one.
Negotiation context
- It's been on market 41 days — a 3% lower offer ($242k) is reasonable based on typical stale-listing flexibility.
Questions for the listing agent
- It's been on market 41 days. Have you received any prior offers? Is the seller open to a 3% concession, seller financing, or rate buy-down credit?
- Built in 1974 — when were the roof, HVAC, electrical panel, plumbing, and water heater last replaced?
- What does the HOA fee cover, when was the last increase, and are there any pending special assessments or reserve-fund shortfalls?
- Is there a deadline driving the sale (1031 exchange, divorce, estate, relocation)? That informs how much negotiation room exists.
- What's the average days-on-market for RENTAL listings here right now (not sales)? A rising rental-DOM trend means longer vacancies and softer asking-rent achievability than the comps imply.
- What's the recent tenant-quality profile in this submarket — average credit score on applications, eviction rate, late-payment / NSF rate, and stable-employment percentage? A property-management company in the area should have these aggregated.
- How much new for-sale + rental construction is in the pipeline within 1–3 miles? Heavy new supply typically softens prices + rents 12–24 months out; constrained supply supports both.
Investment metrics
- 1% rule
- 1.04% ✓
- Cap rate
- 6.89%
- Cash-on-cash
- 2.12%
- DSCR
- 1.09
- GRM
- 8.0
CMA / ARV
- ARV (median comp)
- $317,363
- List price
- $250,000
- Delta
- -21.23%
- Verdict
- UNDERPRICED
- Comps
- 20 within 1.0 mi
Show comp detail 12 sales within ~0.75 mi
| Address | Dist | Beds/Ba | Sqft | Sold | Price | $/sf | Match |
|---|---|---|---|---|---|---|---|
| 70 Lakewood Dr | 0.28mi | 4/2.0 | 1,800 (+2%) | 10mo | $280,000 | $156 | 76 |
| 24 Lakewood Dr | 0.23mi | 4/2.0 | 1,900 (+8%) | 5mo | $240,000 | $126 | 73 |
| 145 Lakeview Dr W | 0.36mi | 3/2.0 (-1) | 1,806 (+2%) | 4mo | $310,000 | $172 | 72 |
| 6 Greenview Court Ct | 0.08mi | 3/2.0 (-1) | 1,593 (-10%) | 9mo | $315,000 | $198 | 67 |
| 12 Parkwood Dr Lot 429 | 0.09mi | 3/2.0 (-1) | 1,547 (-12%) | 4mo | $370,000 | $239 | 67 |
| 470 Oakwood Ct | 0.29mi | 4/2.0 | 1,536 (-13%) | 8mo | $290,000 | $189 | 58 |
| 582 Lakeview Dr W | 0.39mi | 3/3.0 (-1) | 1,692 (-4%) | 9mo | $275,000 | $163 | 58 |
| 248 Parkwood Dr | 0.47mi | 3/2.0 (-1) | 1,697 (-4%) | 10mo | $255,000 | $150 | 58 |
| 445 Lakewood Dr | 0.22mi | 3/1.5 (-1) | 1,512 (-14%) | 1mo | $250,000 | $165 | 58 |
| 138 Oak Circle Cir | 0.61mi | 3/2.5 (-1) | 1,750 (-1%) | 11mo | $308,750 | $176 | 53 |
| 83 Oak Cir | 0.73mi | 3/1.5 (-1) | 1,570 (-11%) | 4mo | $258,000 | $164 | 37 |
| 2527 Oak Cir | 0.66mi | 3/2.0 (-1) | 1,520 (-14%) | 10mo | $420,000 | $276 | 33 |
Match score weights: distance 35% · size 25% · config 20% · recency 20%. Top-matched comps best support the ARV.
Projected returns pro-forma
10.0% appreciation · 3.0% rent growth · sell at horizon
- IRR
- 25.8%
- Equity multiple
- 3.06×
- Total profit
- $144,191
- Equity at exit
- $225,220
- IRR
- 22.7%
- Equity multiple
- 6.98×
- Total profit
- $418,740
- Equity at exit
- $485,695
Cash invested: $70,000 (down + closing). Projections, not guarantees.
Landlord ↔ Tenant lean methodology
- Overall (STATE)
- 62 Landlord-Friendly
- State Pennsylvania
- 62 Landlord-Friendly · EVEN
- County
- — inherits STATE
- City
- — inherits STATE
ZIP-level market 18436
- Home prices YoY
- 16.9%
- Active inventory
- 337
- Price-to-rent
- 8.0×
Monthly cashflow live
- Estimated rent
- $2,589 medium interval (Pro) →
- Mortgage (P&I)
- −$1,311
- Tax est. 1.5%
- −$312 /mo · $3,750/yr
- Insurance
- −$104
- HOA
- −$194
- Vacancy / Maint / Mgmt
- −$544
- Net cashflow
- $124
Break-even live
UW: 25.0% down · 7.5% · 30yr · 1.5% tax · 5.0% vac · 8.0% maint · 8.0% mgmt
Financing live
Cash to close
- Down payment
- $62,500
- Closing costs
- $7,500
- Reserves months
- —
- Total cash needed
- —
Loan-product check · same deal, 3 products live
Conventional
25% down · 7.5% · 30yr
- Down + closing
- —
- Monthly P&I
- —
- Monthly cashflow
- —
- DSCR
- —
- Eligible?
- —
Personal DTI + credit; lowest rate.
DSCR
20% down · 8.5% · 30yr
- Down + closing
- —
- Monthly P&I
- —
- Monthly cashflow
- —
- DSCR
- —
- Eligible?
- —
No personal income docs; deal must DSCR.
Hard money
10% down · 12.0% · 12mo
- Down + closing
- —
- Monthly P&I
- —
- Monthly cashflow
- —
- DSCR
- —
- Eligible?
- —
Short-term bridge; refi at stabilization.
HOA detail
- Monthly dues
- $194 · $2,328/yr
- Likely covers
- poolsecurity
Listing history 16 events
-
2026-06-18days on market $250,000 Active 41 DOM
-
2026-06-17days on market $250,000 Active 40 DOM
-
2026-06-16days on market $250,000 Active 39 DOM
-
2026-06-15days on market $250,000 Active 38 DOM
-
2026-06-14days on market $250,000 Active 36 DOM
-
2026-06-13days on market $250,000 Active 35 DOM
-
2026-06-10days on market $250,000 Active 33 DOM
-
2026-06-09days on market $250,000 Active 32 DOM
-
2026-06-08days on market $250,000 Active 31 DOM
-
2026-06-07days on market $250,000 Active 30 DOM
-
2026-06-03days on market $250,000 Active 26 DOM
-
2026-06-02days on market $250,000 Active 25 DOM
-
2026-06-01days on market $250,000 Active 24 DOM
-
2026-05-31days on market $250,000 Active 23 DOM
-
2026-05-30days on market $250,000 Active 22 DOM
-
2026-05-07$250,000 Active 2034-char remark
ⓘ Source: listings_history table (triggers on properties + properties_extension) + one-shot
backfill from property_details.listing_events for pre-trigger history.
Climate risk First Street
- Flood 1/10 Low FEMA zone X (unshaded) · 0% chance over 30 yrs
- Wildfire 1/10 Low
- Heat 2/10 Low 7 d/yr ≥90°F today · 16 d/yr by 30 yrs out
- Wind 2/10 Low 4% chance of damaging wind over 30 yrs
- Air quality 2/10 Low 1 unhealthy d/yr today · 2 by 30 yrs out
Nearby sold comps map
Loading sold comps map…
Walkable amenities ~0.75 mi
Loading nearby amenities…
Taxation est. · year 1
- Rental income
- $31,069
- − Mortgage interest
- −$14,004
- − Property taxes
- −$3,750
- − Insurance
- −$1,250
- − Repairs & maintenance
- −$2,485
- − Management
- −$2,485
- − HOA
- −$2,328
- − Depreciation
- −$7,273
- Taxable loss
- −$2,507
- Est. tax savings @ 24.0%
- +$602
- After-tax cash flow
- $2,086/yr
For passive investors: Depreciation is non-cash, so a rental often shows a tax loss while cash-flowing — sheltering income. Rental losses are passive: they offset passive income freely, and up to $25,000/yr can offset ordinary (W-2) income if you actively participate and your MAGI is under $100k (phasing out to $0 by $150k); unused losses carry forward. On sale, claimed depreciation is recaptured at up to 25%, and gains may owe capital-gains tax (a 1031 exchange can defer both). Figures are a year-1 estimate at your 24.0% rate — not tax advice; consult a CPA.
Condition & rehab AI · 6 photos
This vintage home in The Hideout is in excellent condition with a well-maintained interior and exterior. It offers a nostalgic charm with a warm, well-maintained interior and a classic mountain vibe. The property is located in a premier gated lake community, making it an ideal getaway or vacation home.
Value-add opportunities
- Both Painting the exterior siding — Enhances curb appeal and can increase both resale and rental value.
- Both Landscaping improvements — Enhances curb appeal and can increase both resale and rental value.
- Both Deck maintenance — Maintaining the deck ensures safety and can increase both resale and rental value.
Renovation cost estimate screening
Value-add ROI direction
- Both Painting the exterior siding — Enhances curb appeal and can increase both resale and rental value. ↑
- Both Landscaping improvements — Enhances curb appeal and can increase both resale and rental value. ↑
- Both Deck maintenance — Maintaining the deck ensures safety and can increase both resale and rental value. ↑
ⓘ Cost ranges are severity-bucket heuristics (US national rule-of-thumb). Get contractor quotes + a written scope before underwriting a rehab budget.
Schools (NCES district)
- District
- Western Wayne SD
- NCES district ID
- 4226070
- Math proficiency
- 39% ▼ -12.00%
- Reading proficiency
- 63% ▼ -6.00%
- Median HH income
- $51,358
- Composite
- 43.65/100
- National rank
- #2964
- State rank
- #165 of 539 in PA
Livability — Salem
No livability data for this city. (Only ~50 U.S. cities are tracked.)
Census & demographics
- Census place
- The Hideout, PA
- Population (ZIP)
- 13,225
Population outlook (Wayne County) Hauer SSP2
- Today (2025)
- 47,924 people
- By 2030
- 46,191 · -3.6%
- By 2040
- 42,815 · -10.7%
- By 2050
- 39,873 · -16.8%
- By 2075
- 34,556 · -27.9%
- By 2100
- 28,358 · -40.8%
Race, ethnicity, and origin ACS 2023
- Neighborhood character
- Predominantly White (95%)
- Race & ethnicity
- White 95% Two or more races 3% Hispanic / Latino 2%
- Common ancestry
- Romanian 9% Scotch-Irish 2% Iranian 2%
- Foreign-born
- 4%
- Languages at home
- 95% English-only · French/Haitian/Cajun 2% Russian/Polish/Slavic 1% Spanish 1%
Political lean MEDSL · Wayne
- 2024 margin
- Solid R (+37.1) · D 31.1% · R 68.2%
- 2008→2024 swing
- -24.8pp toward R · 2008: -12.3pp · 2024: -37.1pp
- All cycles
- 2024: R+37.1 2020: R+33.6 2016: R+39.7 2012: R+20.9 2008: R+12.3
Not yet ingested
- Civics
- —
Market trends
- HPI YoY
- ▲ 47.95%
- Current HPI
- 331.9645
- Rent YoY
- —
- Metro
- —
- State GDP YoY
- ▲ 1.68%
- F500 in state
- 34
Industry mix (Fortune 500 HQ in PA)
| Industry | F500 HQs | Revenue |
|---|---|---|
| Healthcare | 2 | $309B |
|
||
| Insurance | 2 | $27B |
|
||
| Telecommunications / Media | 1 | $124B |
|
||
| Industrial Distribution | 1 | $22B |
|
||
| Financial Services | 1 | $20B |
|
||
| Chemicals / Materials | 1 | $18B |
|
||
Price history
1 event — show timeline
- 2026-05-07 Listed $250,000 PMAR
Cash-flow waterfall
monthlySold comps — $/sqft
last 12 mo · ≤1 miLoading sold comps…