4709 S Texas Ave Unit 4709D · Orlando, FL
Flood risk No data
- FEMA flood zone
- —
- Chance of flooding over 30 yrs
- —
- Est. flood insurance / yr
- —
Fire risk No data
- Est. fire insurance / yr
- —
Heat risk No data
- Hot days now (above threshold)
- —
- Hot days in 30 yrs
- —
Wind risk No data
- Chance of severe wind over 30 yrs
- —
Air-quality risk No data
- Unhealthy air days now
- —
- Unhealthy air days in 30 yrs
- —
Risk factors via First Street. Map © Google.
Why this score? — see what drove the C+ grade
The composite is a weighted blend of 9 inputs, each scored 0–100. Each bar is that input's sub-score; the figure is the points it added to the 100-point composite (weight × sub-score).
- Cash flow +25.5/30.0
- DSCR +8.4/10.0
- ARV discount +7.5/15.0
- 1% rule +6.4/10.0
- Livability +4.3/5.0
- Schools +4.1/10.0
- Condition / age +2.5/5.0
- Rent growth +2.4/5.0
- Appreciation +0.0/10.0
$149,000
🖨 Deal sheet (PDF) 📄 Offer letter ✓ Due diligence
Listing remarks MLS
This is a Fannie Mae HomePath property. Purchase this property for as little as 3% down! This property is approved for HomePath Mortgage Financing.
Key facts
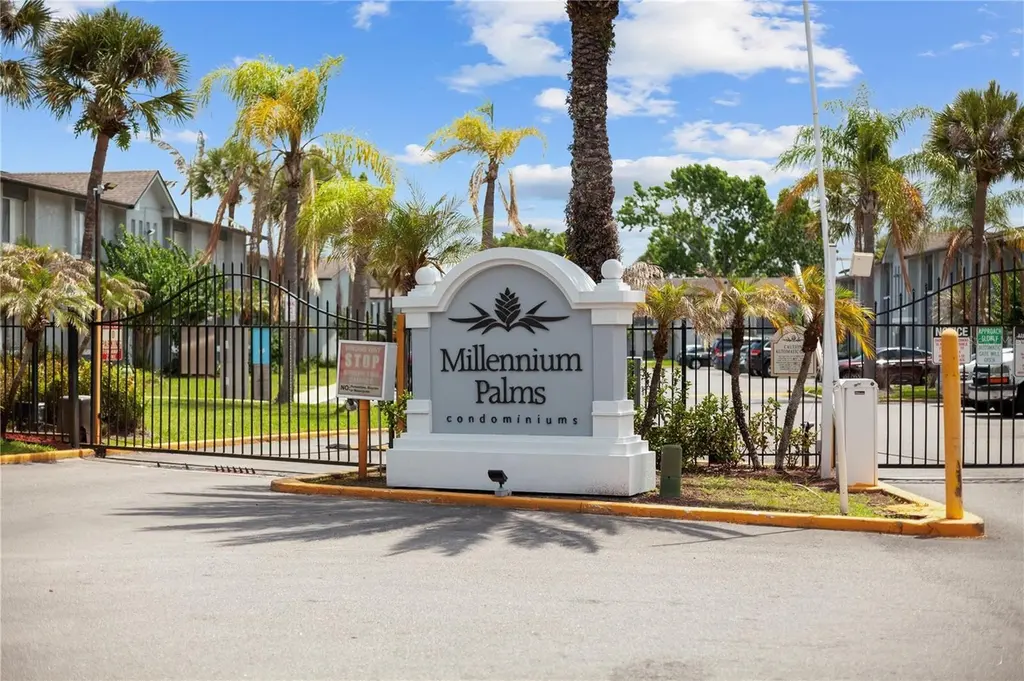
- Gated community
- Community pool
- Built 1973
Tags
Property features AI
Finance
- Other: Property type: Residential condominium; Zoning: R-3; Lot approximately 0.12 acres; Living area about 1,270 square feet; Unfurnished; Pets allowed with size limit; No lease restrictions reported
- HOA & community: HOA: First Residential; Monthly association fee (includes pool); Association fees required
Exterior
- Parking: No parking details provided
- Utilities: Public water; Public sewer; Electricity connected
- Home design: Condominium (attached); Two stories; Faces south; Entry on second floor (unit on floor 2)
- Construction: Block construction; Shingle roof; Slab foundation; Built as part of building 4709
- Exterior features: Exterior lighting; Paved road access
Interior
- Kitchen: Disposal; Range; Refrigerator
- Bedrooms: 3 bedrooms
- Flooring: Ceramic tile
- Bathrooms: 2 full bathrooms
- Heating & cooling: Central heating; Central air conditioning
- Interior features: Thermostat; Disposal; Range; Refrigerator
- Laundry & utility: Indoor laundry
Neighborhood map
What this means for you Summary
Snapshot
- This is a 3-bed/2.0-bath condo listed at $149k.
Deal economics
- At list price, monthly cash flow is $347 ($4k/yr) — positive.
- The deal already cash-flows at list — no discount required.
- Meets the 1% rule at list price ($2k rent vs $149k).
- Cap rate 9.1% vs local median 3.0% in Orlando — top-decile yield for the area; either an underpriced asset or a hidden risk that comps aren't pricing in. Stress-test before assuming the spread holds.
Location & tenants
- Location reads 86/100 on livability (#12 in FL, #360 nationally) — a professional / high-income tenant draw. Strengths: amenities A+, commute A+, housing A+.
- Orange (suburban): math 46% / reading 51% proficiency, ranked #43 of 73 in FL (top 59%) — families likely to look elsewhere, expect single-tenant / working-renter base with shorter leases.
- Zoned schools: Palmetto Elementary (math 31% / reading 33%, grade F, #1,797 of 2,144 statewide, top 86%, 805 students, 75% FRL); Memorial Middle (math 29% / reading 30%, grade F, #469 of 571 statewide, top 84%, 944 students, 75% FRL); Oak Ridge High (math 17% / reading 27%, grade F, #544 of 667 statewide, top 82%, 2,477 students, 66% FRL) — zoned schools average 72% FRL vs 56% district-wide (16 pts higher); higher-poverty schools than district average — tighter screening recommended.
- Zoned-school proficiency averages 28% at this address vs 48% district-wide (-21 pts) — the specific schools serving this property underperform the Orange average; the district grade overstates school quality for this exact location.
- Market conditions: Rents soft (-0.5%/yr); 224 active listings in the ZIP; 40 comparable units currently listed for rent nearby; rentals at typical pace (median 19d on market — plan ~3-4 weeks tenant-placement turnaround); 8,053 units permitted in Orange County in 2024 (3,133 in 5+ unit buildings).
- This rent runs 43% of the median local income ($47k/yr) — at the standard rent-burdened threshold; future hikes will face affordability resistance.
Forward outlook
- Local home prices are declining (-3.0%/yr); year-one equity from $1k of loan paydown is wiped out by about $4k of value loss. Plan a longer hold.
- Orange County population projected at +52% by 2050 — long-run rental-demand tailwind backs the buy-and-hold thesis.
Negotiation context
- Only 14 days on market — expect competitive offers; lowballing is unlikely to land.
- 2 sale attempts since 17y ago with the ask held roughly flat each time — persistent listings suggest the price (not the market) is what's stuck; bring a comps-based counter.
- Current owner paid $48k; list at $149k implies a 207% gain — meaningful room to come down on a strong offer.
Questions for the listing agent
- Built in 1973 — when were the roof, HVAC, electrical panel, plumbing, and water heater last replaced?
- Any open or pending special assessments — roof, HVAC, plumbing, elevator, façade? What's the per-unit balance and payoff schedule, and is the seller paying it off at close or rolling it to the buyer?
- Is there a deadline driving the sale (1031 exchange, divorce, estate, relocation)? That informs how much negotiation room exists.
- Schools are B-rated — typically a magnet for longer-tenancy family renters. What's the average tenant stay here, and is there a school-zone premium baked into asking?
- What's the average days-on-market for RENTAL listings here right now (not sales)? A rising rental-DOM trend means longer vacancies and softer asking-rent achievability than the comps imply.
- What's the recent tenant-quality profile in this submarket — average credit score on applications, eviction rate, late-payment / NSF rate, and stable-employment percentage? A property-management company in the area should have these aggregated.
- How much new apartment / multifamily construction is in the pipeline within 1–3 miles? Heavy new supply (>2% of stock underway) typically softens rents 12–24 months out; light construction supports rent growth.
Investment metrics
- 1% rule
- 1.14% ✓
- Cap rate
- 9.09%
- Cash-on-cash
- 9.99%
- DSCR
- 1.44
- GRM
- 7.3
CMA / ARV
No comps found within radius.
Projected returns pro-forma
-3.0% appreciation · 0.0% rent growth · sell at horizon
- IRR
- -4.6%
- Equity multiple
- 0.83×
- Total profit
- $-6,997
- Equity at exit
- $22,216
- IRR
- 1.2%
- Equity multiple
- 1.08×
- Total profit
- $3,176
- Equity at exit
- $12,883
Cash invested: $41,720 (down + closing). Projections, not guarantees.
Landlord ↔ Tenant lean methodology
- Overall (STATE)
- 87 Strongly Landlord-Friendly
- State Florida
- 87 Strongly Landlord-Friendly · R+3
- County
- — inherits STATE
- City
- — inherits STATE
ZIP-level market 32839
- Home prices YoY
- -20.1%
- Rents YoY
- -0.5%
- Active inventory
- 224
- Price-to-rent
- 7.3×
Monthly cashflow live
- Estimated rent
- $1,698 high interval (Pro) →
- Mortgage (P&I)
- −$781
- Tax from tax record
- −$150 /mo · $1,804/yr
- Insurance
- −$62
- HOA
- −$0
- Vacancy / Maint / Mgmt
- −$356
- Net cashflow
- $347
Break-even live
Sensitivity live
| Price | -10% $432 | -5% $389 | +0% $347 | +5% $305 | +10% $263 |
|---|---|---|---|---|---|
| Rent | -10% $213 | -5% $280 | +0% $347 | +5% $414 | +10% $481 |
| Rate | -1.0pp $422 | -0.5pp $385 | base $347 | +0.5pp $309 | +1.0pp $269 |
UW: 25.0% down · 7.5% · 30yr · 1.5% tax · 5.0% vac · 8.0% maint · 8.0% mgmt
Financing live
Cash to close
- Down payment
- $37,250
- Closing costs
- $4,470
- Reserves months
- —
- Total cash needed
- —
Loan-product check · same deal, 3 products live
Conventional
25% down · 7.5% · 30yr
- Down + closing
- —
- Monthly P&I
- —
- Monthly cashflow
- —
- DSCR
- —
- Eligible?
- —
Personal DTI + credit; lowest rate.
DSCR
20% down · 8.5% · 30yr
- Down + closing
- —
- Monthly P&I
- —
- Monthly cashflow
- —
- DSCR
- —
- Eligible?
- —
No personal income docs; deal must DSCR.
Hard money
10% down · 12.0% · 12mo
- Down + closing
- —
- Monthly P&I
- —
- Monthly cashflow
- —
- DSCR
- —
- Eligible?
- —
Short-term bridge; refi at stabilization.
Rent comps 40 comps
| Address | Beds | Baths | Sqft | Rent | $/sqft | DOM | Units | Dist |
|---|---|---|---|---|---|---|---|---|
| 4711 S Texas Ave Unit 4711A Orlando, FL | 2.0 | 2.0 | 976 | $1,600 | $1.64 | 26d | 1 | 0.03mi |
| 4789 S Texas Ave Apt A Orlando, FL | 2.0 | 2.0 | 976 | $1,500 | $1.54 | 10d | 1 | 0.07mi |
| 2107 Honour Rd #2107 Orlando, FL | 2.0 | 2.5 | 1208 | $1,650 | $1.37 | 5d | 1 | 0.08mi |
| 2107 Honour Rd #2107 Orlando, FL | 2.0 | 2.5 | 1208 | $1,650 | $1.37 | 0d | 1 | 0.08mi |
| 4791 S Texas Ave Orlando, FL | 2.0 | 2.0 | 976 | $1,300 | $1.33 | 26d | 1 | 0.08mi |
| 4725 S Texas Ave Apt C Orlando, FL | 2.0 | 2.0 | 976 | $1,249 | $1.28 | 26d | 1 | 0.09mi |
| 4733 S Texas Ave Unit 4733B Orlando, FL | 2.0 | 2.0 | 976 | $1,450 | $1.49 | 24d | 1 | 0.11mi |
| 5208 Via Hacienda Cir Unit 101 Orlando, FL | 2.0 | 2.0 | 1073 | $2,000 | $1.86 | 26d | 1 | 0.13mi |
| 4759 S Texas Ave Unit 4759C Orlando, FL | 2.0 | 2.0 | 976 | $1,450 | $1.49 | 18d | 1 | 0.15mi |
| 4779 S Texas Ave Unit 4779D Orlando, FL | 2.0 | 2.0 | 976 | $1,450 | $1.49 | 5d | 1 | 0.15mi |
| 5214 Via Hacienda Cir Apt 207 Orlando, FL | 2.0 | 2.0 | 1073 | $1,500 | $1.40 | 0d | 1 | 0.17mi |
| 5219 Via Hacienda Cir Unit B209 Orlando, FL | 2.0 | 2.0 | 1073 | $1,500 | $1.40 | 18d | 1 | 0.17mi |
| 5226 Via Hacienda Cir Unit A313 Orlando, FL | 2.0 | 2.0 | 934 | $1,400 | $1.50 | 5d | 1 | 0.19mi |
| 5226 Via Hacienda Cir Unit A215 Orlando, FL | 2.0 | 2.0 | 1073 | $1,550 | $1.44 | 26d | 1 | 0.19mi |
| 5226 Via Hacienda Cir Unit A116 Orlando, FL | 2.0 | 2.0 | 934 | $1,350 | $1.45 | 26d | 1 | 0.19mi |
| 4749 S Texas Ave Unit 4749C Orlando, FL | 2.0 | 2.0 | 976 | $1,450 | $1.49 | 26d | 1 | 0.19mi |
| 4767 S Texas Ave Unit 4767B Orlando, FL | 2.0 | 2.0 | 976 | $1,450 | $1.49 | 16d | 1 | 0.19mi |
| 2225 Holden Ave #104 Orlando, FL | 2.0 | 2.0 | 1248 | $1,800 | $1.44 | 26d | 1 | 0.20mi |
| 5225 Via Hacienda Cir Unit B115 Orlando, FL | 2.0 | 2.0 | 1073 | $1,480 | $1.38 | 26d | 1 | 0.20mi |
| 2691 Charleston Town Pl Orlando, FL | 1.0–3.0 | 1.0–2.0 | 1199 | $2,372 | $1.98 | 0d | 20 | 0.22mi |
| 1926 Honour Rd #4 Orlando, FL | 3.0 | 1.0 | 910 | $1,500 | $1.65 | 26d | 1 | 0.26mi |
| 1902 Honour Rd Orlando, FL | 3.0 | 2.0 | 1000 | $1,750 | $1.75 | 26d | 1 | 0.26mi |
| 2363 Huntington Green Ct #5 Orlando, FL | 3.0 | 2.5 | 1405 | $1,850 | $1.32 | 17d | 1 | 0.28mi |
| 2424 Grand Central Pkwy Orlando, FL | 2.0 | 2.5 | 1250 | $1,795 | $1.44 | 6d | 1 | 0.29mi |
| 1717 Holden Ave Orlando, FL | 1.0–3.0 | 1.0–2.5 | 980 | $1,799 | $1.84 | 0d | 24 | 0.29mi |
| 2442 Grand Central Pkwy #2 Orlando, FL | 2.0 | 2.5 | 1250 | $2,200 | $1.76 | 26d | 1 | 0.30mi |
| 2424 Grand Central Pkwy Orlando, FL | 2.0 | 2.5 | 1250 | $1,822 | $1.46 | 10d | 2 | 0.30mi |
| 2342 Huntington Green Ct #2 Orlando, FL | 2.0 | 1.5 | 996 | $1,300 | $1.31 | 24d | 1 | 0.31mi |
| 2352 Huntington Green Ct #7 Orlando, FL | 2.0 | 1.5 | 996 | $1,400 | $1.41 | 26d | 1 | 0.31mi |
| 2334 Grand Central Pkwy #17 Orlando, FL | 2.0 | 2.5 | 1250 | $1,750 | $1.40 | 22d | 1 | 0.33mi |
| 1980 Lake Fountain Dr Orlando, FL | 1.0–2.0 | 1.0–2.0 | 870 | $2,107 | $2.42 | 0d | 18 | 0.33mi |
| 2262 Grand Central Pkwy #3 Orlando, FL | 3.0 | 2.0 | 1465 | $2,150 | $1.47 | 24d | 1 | 0.38mi |
| 4746 Rio Grande Ave Orlando, FL | 1.0–3.0 | 1.0–2.0 | 920 | $2,002 | $2.18 | 0d | 38 | 0.39mi |
| 2437 Americana Blvd Orlando, FL | 2.0 | 1.0–2.0 | 895 | $2,147 | $2.40 | 0d | 16 | 0.43mi |
| 2604 Grand Central Pkwy #2 Orlando, FL | 3.0 | 2.0 | 1457 | $1,895 | $1.30 | 10d | 1 | 0.43mi |
| 2604 Grand Central Pkwy Orlando, FL | 3.0 | 2.0 | 1457 | $2,148 | $1.47 | 16d | 1 | 0.43mi |
| 4405 S Texas Ave Orlando, FL | 2.0 | 2.0 | 1100 | $1,550 | $1.41 | 26d | 1 | 0.43mi |
| 4424 S Texas Ave Unit 204 Orlando, FL | 2.0 | 2.0 | 900 | $1,900 | $2.11 | 12d | 1 | 0.44mi |
| 4424 S Texas Ave Unit 1-2051-205 Orlando, FL | 2.0 | 2.0 | 900 | $1,750 | $1.94 | 5d | 1 | 0.44mi |
| 1432 Holden Ave Unit C6 Orlando, FL | 2.0 | 2.0 | 970 | $1,500 | $1.55 | 26d | 1 | 0.46mi |
HOA detail condo
- Monthly dues
- $0 · $0/yr
- Assessments
- None detected in remarks — confirm with the listing agent.
Listing history 10 events
-
2026-06-21days on market $149,000 Active 14 DOM
-
2026-06-18days on market $149,000 Active 11 DOM
-
2026-06-17days on market $149,000 Active 10 DOM
-
2026-06-16days on market $149,000 Active 9 DOM
-
2026-06-15days on market $149,000 Active 8 DOM
-
2026-06-13days on market $149,000 Active 6 DOM
-
2026-06-13days on market $149,000 Active 5 DOM
-
2026-06-09days on market $149,000 Active 2 DOM
-
2026-06-08remarks 392-char remark
-
2026-06-08$149,000 Active 1 DOM
ⓘ Source: listings_history table (triggers on properties + properties_extension) + one-shot
backfill from property_details.listing_events for pre-trigger history.
Tax reassessment forecast FL · Resets to sale price
- Current annual tax
- $1,804 · $150/mo
- Projected year-2 tax
- $1,804 · $150/mo
- Expected delta
- $0/yr ($0/mo · -0.0%)
ⓘ Screening estimate from a state-policy table — verify with the county assessor before closing.
Nearby sold comps map
Loading sold comps map…
Walkable amenities ~0.75 mi
Loading nearby amenities…
Taxation est. · year 1
- Rental income
- $20,370
- − Mortgage interest
- −$8,346
- − Property taxes
- −$1,804
- − Insurance
- −$745
- − Repairs & maintenance
- −$1,630
- − Management
- −$1,630
- − Depreciation
- −$4,335
- Taxable income
- $1,881
- Est. tax owed @ 24.0%
- −$452
- After-tax cash flow
- $3,716/yr
For passive investors: Depreciation is non-cash, so a rental often shows a tax loss while cash-flowing — sheltering income. Rental losses are passive: they offset passive income freely, and up to $25,000/yr can offset ordinary (W-2) income if you actively participate and your MAGI is under $100k (phasing out to $0 by $150k); unused losses carry forward. On sale, claimed depreciation is recaptured at up to 25%, and gains may owe capital-gains tax (a 1031 exchange can defer both). Figures are a year-1 estimate at your 24.0% rate — not tax advice; consult a CPA.
Schools (NCES district)
- District
- Orange
- NCES district ID
- 1201440
- Math proficiency
- 46% ▼ -9.00%
- Reading proficiency
- 51% ▼ -2.00%
- Median HH income
- $49,350
- Composite
- 41.47/100
- National rank
- #3461
- State rank
- #43 of 73 in FL
Livability — Orlando
- Score
- 86/100
- State rank
- #12
- US rank
- #360
Category grades
Schools grade is shown separately in the Schools card above.
Census & demographics
- County
- Orange County · 1,471,359 people
- City population
- 964,969
- Metro
- Orlando-Kissimmee-Sanford, FL
- Population (ZIP)
- 53,242
- Household income
- $47,313
- Rent vs Own
- Severe rent burden
- 5337.0
Population outlook (Orange County) Hauer SSP2
- Today (2025)
- 1,618,226 people
- By 2030
- 1,787,404 · +10.5%
- By 2040
- 2,125,621 · +31.4%
- By 2050
- 2,454,016 · +51.6%
- By 2075
- 3,173,711 · +96.1%
- By 2100
- 3,607,781 · +122.9%
Race, ethnicity, and origin ACS 2023
- Neighborhood character
- Diverse neighborhood (Simpson 0.69)
- Race & ethnicity
- Hispanic / Latino 39% Black 35% Two or more races 17% White 16% Asian 4%
- Hispanic origin (detail)
- Mexican 5% Puerto Rican 14% Cuban 2% Dominican 3%
- Common ancestry
- Hispanic 8% Estonian 1% Lithuanian 1%
- Foreign-born
- 30% · Canada, Jamaica, Vietnam
- Languages at home
- 51% English-only · Spanish 33% French/Haitian/Cajun 9% Other Indo-European 2%
Political lean MEDSL · Orange
- 2024 margin
- D (+13.6) · D 56.1% · R 42.5% · Other 1.3%
- 2008→2024 swing
- -5.0pp toward R · 2008: 18.6pp · 2024: 13.6pp
- All cycles
- 2024: D+13.6 2020: D+23.1 2016: D+24.6 2012: D+18.2 2008: D+18.6
Not yet ingested
- Civics
- —
Market trends
- HPI YoY
- ▼ -89.65%
- Current HPI
- 357.4828
- Rent YoY
- ▼ -0.50%
- Metro
- Orlando-Kissimmee-Sanford, FL
- State GDP YoY
- ▲ 3.28%
- F500 in state
- 36
Industry mix (Fortune 500 HQ in FL)
| Industry | F500 HQs | Revenue |
|---|---|---|
| Industrial Technology | 2 | $29B |
|
||
| Insurance | 2 | $17B |
|
||
| Retail | 1 | $60B |
|
||
| Technology Distribution | 1 | $58B |
|
||
| Homebuilding | 1 | $35B |
|
||
| Technology Manufacturing | 1 | $35B |
|
||
Price history
+273.4% since first listed4 events — show timeline
- 2026-06-07 Listed $149,000 Stellar MLS as Distributed by MLS Grid
- 2017-02-16 Sold (Public Records) $48,500 Public Records
- 2010-01-22 Sold (MLS) $39,000 Stellar MLS as Distributed by MLS Grid
- 2009-11-03 Listed $39,900 Stellar MLS as Distributed by MLS Grid
Property tax history
+4.8%/yrLatest (2025): $1,804 · +10.4% YoY. Source: county tax records.
Cash-flow waterfall
monthlySold comps — $/sqft
last 12 mo · ≤1 miLoading sold comps…