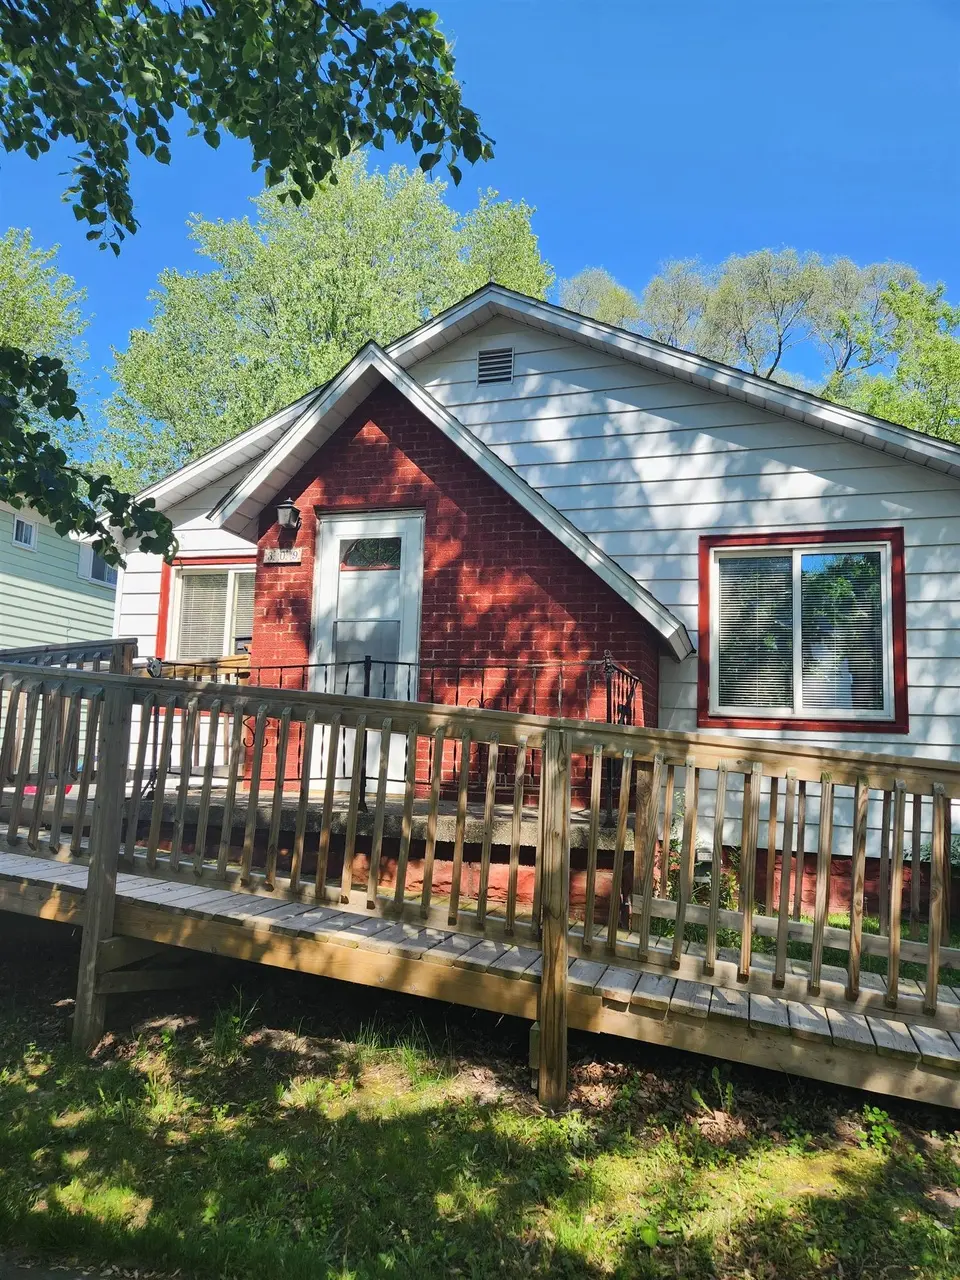
309 S Warner St · Bay City, MI
Flood risk 6/10 · Moderate
- FEMA flood zone
- X (unshaded)
- Chance of flooding over 30 yrs
- 0.68%
- Est. flood insurance / yr
- $473 – $860
Fire risk 1/10 · Minimal
- Est. fire insurance / yr
- $784 – $1,456
Heat risk 2/10 · Minimal
- Hot days now (above 97°F)
- 7 days/yr
- Hot days in 30 yrs
- 14 days/yr
Wind risk 1/10 · Minimal
- Chance of severe wind over 30 yrs
- —
Air-quality risk 2/10 · Minimal
- Unhealthy air days now
- 1 days/yr
- Unhealthy air days in 30 yrs
- 2 days/yr
Risk factors via First Street. Map © Google.
Why this score? — see what drove the D+ grade
The composite is a weighted blend of 9 inputs, each scored 0–100. Each bar is that input's sub-score; the figure is the points it added to the 100-point composite (weight × sub-score).
- Cash flow +14.3/30.0
- ARV discount +13.2/15.0
- DSCR +4.4/10.0
- 1% rule +4.2/10.0
- Livability +3.4/5.0
- Schools +2.8/10.0
- Rent growth +2.5/5.0
- Condition / age +2.5/5.0
- Appreciation +0.0/10.0
$127,000
🖨 Deal sheet 📄 Offer letter ✓ Due diligence
Listing remarks
This is a quaint 3-bedroom ranch on Bay City’s west side, in the same family for 18 years. Well-maintained home offers a warm and inviting feel with a mix of beautiful hardwood and easy-care laminate flooring throughout. The living room features classic plaster walls and cove ceiling, adding character you don’t often find. Updated bathroom. Enjoy the convenience of a one-car garage with a unique drive-through design, providing easy access to the fully fenced backyard—perfect for outdoor entertaining or pets. Deep lot 120 ft. The breezeway has new storm doors, adding both function and curb appeal. Major updates offer peace of mind, including a newer roof 11 years, furnace,
Key facts
- Newer windows
- New storm doors
- Major updates
Tags
Property features AI
Finance
- Other: Probate listing
Exterior
- Parking: Attached garage (24 x 14), 1 parking space
- Utilities: Natural gas heating fuel; Public water; Public sanitary sewer; Electric service (standard)
- Home design: Residential, single-story; Built in 1899; Basement; Frontage on a road
- Construction: Vinyl siding exterior; Block foundation; Basement (full)
- Exterior features: Vinyl siding; Fenced yard; Porch; Sidewalks; City/County road frontage
Interior
- Kitchen: Kitchen on the first floor (13 x 12); Refrigerator; Range/oven
- Bedrooms: First-floor bedroom (16 x 11) with laminate flooring; First-floor bedroom (12 x 9) with wood flooring; First-floor bedroom (approx. 9 ft wide) with wood flooring
- Flooring: Laminate in dining room and living areas; Laminate in one bedroom; Wood flooring in two bedrooms; Vinyl in the kitchen
- Bathrooms: One full bathroom on the main/first floor (approx. 10 x 7)
- Heating & cooling: Forced air heating; Central air conditioning; Ceiling fan(s)
- Interior features: Bay window; Hardwood floors; Breezeway; Basement lavatory; Main floor full bathroom
- Laundry & utility: Dryer; Full basement (block foundation)
Neighborhood map
What this means for you Summary
Snapshot
- This is a 3-bed/1.0-bath single-family listed at $127k.
Deal economics
- At list price, monthly cash flow is $24 ($293/yr) — positive.
- The deal already cash-flows at list — no discount required.
- To meet the 1% rule (rent ≥ 1% of price), the offer needs to be $117k (8.2% below list).
- Recommended offer: $117k (8.2% below list) — sets the bar for 1% rule.
Location & tenants
- Location reads 68/100 on livability (#360 in MI) — a middle-class / working-renter tenant base. Strengths: cost of living A+, housing A+, health & safety A+; Watch: schools D+, amenities D, crime F.
- Bay City School District (urban): math 27% / reading 40% proficiency, ranked #317 of 540 in MI (top 59%) — families likely to look elsewhere, expect single-tenant / working-renter base with shorter leases.
- Market conditions: 246 active listings in the ZIP; 3 comparable units currently listed for rent nearby; rentals lingering (median 44d on market — plan ~5-8 weeks vacancy on turnover, expect pricing pressure); 100% of comp listings sitting > 30 days — soft ceiling on asking rent; 39 units permitted in Bay County in 2024 (0 in 5+ unit buildings).
Forward outlook
- Local home prices are declining (-3.0%/yr); year-one equity from $878 of loan paydown is wiped out by about $4k of value loss. Plan a longer hold.
- Bay County population projected at -21% by 2050 — secular population decline; favor cash flow + early exit over multi-decade hold.
Negotiation context
- It's been on market 21 days — a 2% lower offer ($125k) is reasonable based on typical stale-listing flexibility.
- 4 sale attempts since 22y ago with the ask held roughly flat each time — persistent listings suggest the price (not the market) is what's stuck; bring a comps-based counter.
- Current owner paid $40k; list at $127k implies a 217% gain — meaningful room to come down on a strong offer.
Risks & watch-outs
- Watch-outs: built in 1899 — expect roof / HVAC / electrical / plumbing capex.
- Climate carrying-cost: major flood risk — expect insurance premiums to compound above CPI over the hold.
Questions for the listing agent
- Built in 1899 — when were the roof, HVAC, electrical panel, plumbing, and water heater last replaced?
- Is there a deadline driving the sale (1031 exchange, divorce, estate, relocation)? That informs how much negotiation room exists.
- Schools are D-rated, which usually means shorter tenancies and higher turnover. Who's the typical renter profile here, and what's been the actual vacancy rate?
- Crime grade is F in this area — have there been break-ins, vandalism, or insurance claims at this property in the last 3 years? What carrier currently insures it and at what premium?
- The area grade is low — what's the realistic commute time and amenity access for the typical tenant pool here? Any planned neighborhood developments (good or bad) we should know about?
- What's the average days-on-market for RENTAL listings here right now (not sales)? A rising rental-DOM trend means longer vacancies and softer asking-rent achievability than the comps imply.
- What's the recent tenant-quality profile in this submarket — average credit score on applications, eviction rate, late-payment / NSF rate, and stable-employment percentage? A property-management company in the area should have these aggregated.
- How much new for-sale + rental construction is in the pipeline within 1–3 miles? Heavy new supply typically softens prices + rents 12–24 months out; constrained supply supports both.
Investment metrics
- 1% rule
- 0.92% ✗
- Cap rate
- 6.52%
- Cash-on-cash
- 0.82%
- DSCR
- 1.04
- GRM
- 9.1
CMA / ARV
- ARV (on-the-fly)
- $145,576
- Comps found
- 12
Show comp detail 12 sales within ~0.75 mi
| Address | Dist | Beds/Ba | Sqft | Sold | Price | $/sf | Match |
|---|---|---|---|---|---|---|---|
| 607 W Jenny St | 0.20mi | 3/1.0 | 1,236 (+5%) | 3mo | $100,000 | $81 | 79 |
| 203 W Jenny St | 0.06mi | 3/2.5 | 1,233 (+5%) | 7mo | $190,000 | $154 | 77 |
| 214 S Warner St | 0.07mi | 3/1.0 | 1,042 (-11%) | 4mo | $113,000 | $108 | 75 |
| 304 S Erie St | 0.08mi | 3/1.0 | 1,011 (-14%) | 3mo | $90,000 | $89 | 71 |
| 315 S Alp St | 0.19mi | 2/2.0 (-1) | 1,223 (+4%) | 6mo | $130,000 | $106 | 70 |
| 207 Main St | 0.58mi | 3/1.0 | 1,200 (+2%) | 5mo | $148,900 | $124 | 65 |
| 215 S Kiesel St | 0.15mi | 2/1.0 (-1) | 1,041 (-11%) | 7mo | $140,000 | $134 | 64 |
| 312 S Barclay St | 0.32mi | 2/1.0 (-1) | 1,271 (+8%) | 7mo | $160,000 | $126 | 60 |
| 604 S Barclay St | 0.41mi | 3/1.0 | 1,003 (-15%) | 1mo | $127,000 | $127 | 56 |
| 401 E Florence St | 0.67mi | 3/2.0 | 1,248 (+6%) | 4mo | $125,000 | $100 | 51 |
| 1507 W White St | 0.70mi | 3/1.0 | 1,056 (-10%) | 0mo | $175,000 | $166 | 50 |
| 104 W Ionia St | 0.70mi | 3/1.5 | 1,096 (-7%) | 5mo | $106,000 | $97 | 50 |
Match score weights: distance 35% · size 25% · config 20% · recency 20%. Top-matched comps best support the ARV.
Projected returns pro-forma
-3.0% appreciation · 3.0% rent growth · sell at horizon
- IRR
- -15.0%
- Equity multiple
- 0.47×
- Total profit
- $-18,997
- Equity at exit
- $18,936
- IRR
- -6.3%
- Equity multiple
- 0.59×
- Total profit
- $-14,422
- Equity at exit
- $10,981
Cash invested: $35,560 (down + closing). Projections, not guarantees.
Landlord ↔ Tenant lean methodology
- Overall (STATE)
- 62 Landlord-Friendly
- State Michigan
- 62 Landlord-Friendly · EVEN
- County
- — inherits STATE
- City
- — inherits STATE
ZIP-level market 48706
- Active inventory
- 246
- Price-to-rent
- 9.1×
Monthly cashflow live
- Estimated rent
- $1,166 medium interval (Pro) →
- Mortgage (P&I)
- −$666
- Tax from tax record
- −$178 /mo · $2,136/yr
- Insurance
- −$53
- HOA
- −$0
- Vacancy / Maint / Mgmt
- −$245
- Net cashflow
- $24
Break-even live
UW: 25.0% down · 7.5% · 30yr · 1.5% tax · 5.0% vac · 8.0% maint · 8.0% mgmt
Financing live
Cash to close
- Down payment
- $31,750
- Closing costs
- $3,810
- Reserves months
- —
- Total cash needed
- —
Loan-product check · same deal, 3 products live
Conventional
25% down · 7.5% · 30yr
- Down + closing
- —
- Monthly P&I
- —
- Monthly cashflow
- —
- DSCR
- —
- Eligible?
- —
Personal DTI + credit; lowest rate.
DSCR
20% down · 8.5% · 30yr
- Down + closing
- —
- Monthly P&I
- —
- Monthly cashflow
- —
- DSCR
- —
- Eligible?
- —
No personal income docs; deal must DSCR.
Hard money
10% down · 12.0% · 12mo
- Down + closing
- —
- Monthly P&I
- —
- Monthly cashflow
- —
- DSCR
- —
- Eligible?
- —
Short-term bridge; refi at stabilization.
Rent comps 3 comps
| Address | Beds | Baths | Sqft | Rent | $/sqft | DOM | Units | Dist |
|---|---|---|---|---|---|---|---|---|
| 1305 Washington Ave Bay City, MI | 2.0 | 1.0 | 635 | $1,675 | $2.64 | 43d | 1 | 1.07mi |
| 800 McKinley St Bay City, MI | 2.0 | 1.0 | 796 | $925 | $1.16 | 43d | 1 | 1.31mi |
| 600 18th St Bay City, MI | 2.0 | 1.0 | 1000 | $950 | $0.95 | 43d | 1 | 1.40mi |
Listing history 25 events
-
2026-06-19days on market $127,000 Active 21 DOM
-
2026-06-18days on market $127,000 Active 20 DOM
-
2026-06-17days on market $127,000 Active 19 DOM
-
2026-06-16days on market $127,000 Active 18 DOM
-
2026-06-15days on market $127,000 Active 17 DOM
-
2026-06-14days on market $127,000 Active 15 DOM
-
2026-06-12pricedays on market $127,000 Active 14 DOM
-
2026-06-09days on market $129,000 Active 11 DOM
-
2026-06-08days on market $129,000 Active 10 DOM
-
2026-06-07days on market $129,000 Active 9 DOM
-
2026-06-05days on market $129,000 Active 6 DOM
-
2026-06-03days on market $129,000 Active 5 DOM
-
2026-06-02days on market $129,000 Active 4 DOM
-
2026-06-01days on market $129,000 Active 3 DOM
-
2026-05-31days on market $129,000 Active 2 DOM
-
2026-05-29$129,000 Active
-
2018-04-25historical
-
2010-01-19soldstatus $40,000
-
2008-11-26soldstatus $23,000
-
2008-06-10$23,900
-
2004-10-14soldstatus $77,150
-
2004-10-08soldstatus $77,150
-
2004-09-01$74,900
-
2004-02-29$74,900
-
2001-04-03soldstatus $75,000
ⓘ Source: listings_history table (triggers on properties + properties_extension) + one-shot
backfill from property_details.listing_events for pre-trigger history.
Tax reassessment forecast MI · Partial reset (capped growth)
- Current annual tax
- $2,136 · $178/mo
- Projected year-2 tax
- $2,136 · $178/mo
- Expected delta
- $0/yr ($0/mo · 0.0%)
ⓘ Screening estimate from a state-policy table — verify with the county assessor before closing.
Climate risk First Street
- Flood 6/10 Major FEMA zone X (unshaded) · 68% chance over 30 yrs
- Wildfire 1/10 Low
- Heat 2/10 Low 7 d/yr ≥97°F today · 14 d/yr by 30 yrs out
- Wind 1/10 Low
- Air quality 2/10 Low 1 unhealthy d/yr today · 2 by 30 yrs out
Nearby sold comps map
Loading sold comps map…
Walkable amenities ~0.75 mi
Loading nearby amenities…
Taxation est. · year 1
- Rental income
- $13,995
- − Mortgage interest
- −$7,114
- − Property taxes
- −$2,136
- − Insurance
- −$635
- − Repairs & maintenance
- −$1,120
- − Management
- −$1,120
- − Depreciation
- −$3,695
- Taxable loss
- −$1,824
- Est. tax savings @ 24.0%
- +$438
- After-tax cash flow
- $730/yr
For passive investors: Depreciation is non-cash, so a rental often shows a tax loss while cash-flowing — sheltering income. Rental losses are passive: they offset passive income freely, and up to $25,000/yr can offset ordinary (W-2) income if you actively participate and your MAGI is under $100k (phasing out to $0 by $150k); unused losses carry forward. On sale, claimed depreciation is recaptured at up to 25%, and gains may owe capital-gains tax (a 1031 exchange can defer both). Figures are a year-1 estimate at your 24.0% rate — not tax advice; consult a CPA.
Schools (NCES district)
- District
- Bay City School District
- NCES district ID
- 2604260
- Math proficiency
- 27% ▼ -8.00%
- Reading proficiency
- 40% ▼ -4.00%
- Median HH income
- $43,833
- Composite
- 28.47/100
- National rank
- #6743
- State rank
- #317 of 540 in MI
Livability — Bay City
- Score
- 68/100
- State rank
- #360
- US rank
- #8912
Category grades
Schools grade is shown separately in the Schools card above.
Census & demographics
- Census place
- Bay City, MI
- City population
- 25,635
- Population (ZIP)
- 38,756
Population outlook (Bay County) Hauer SSP2
- Today (2025)
- 101,476 people
- By 2030
- 98,152 · -3.3%
- By 2040
- 89,711 · -11.6%
- By 2050
- 80,614 · -20.6%
- By 2075
- 60,544 · -40.3%
- By 2100
- 41,603 · -59.0%
Race, ethnicity, and origin ACS 2023
- Neighborhood character
- Predominantly White (90%)
- Race & ethnicity
- White 90% Hispanic / Latino 5% Two or more races 4%
- Common ancestry
- Romanian 16% Lithuanian 9% Slovak 2%
- Foreign-born
- 1%
- Languages at home
- 98% English-only · Spanish 1%
Political lean MEDSL · Bay
- 2024 margin
- R (+14.7) · D 42.0% · R 56.7% · Other 1.3%
- 2008→2024 swing
- -30.0pp toward R · 2008: 15.3pp · 2024: -14.7pp
- All cycles
- 2024: R+14.7 2020: R+11.6 2016: R+12.6 2012: D+6.0 2008: D+15.3
Not yet ingested
- Civics
- —
Market trends
- HPI YoY
- ▼ -133.29%
- Current HPI
- 203.6444
- Rent YoY
- —
- Metro
- —
- State GDP YoY
- ▲ 1.37%
- F500 in state
- 28
Industry mix (Fortune 500 HQ in MI)
| Industry | F500 HQs | Revenue |
|---|---|---|
| Automotive Parts | 3 | $48B |
|
||
| Automotive | 2 | $372B |
|
||
| Chemicals | 1 | $45B |
|
||
| Automotive Retail | 1 | $29B |
|
||
| Healthcare / Medical Devices | 1 | $23B |
|
||
| Automotive Technology | 1 | $20B |
|
||
Price history
+72.0% since first listed10 events — show timeline
- 2026-05-29 Listed $129,000 MiRealSource-MiMLS
- 2018-04-25 Listing Removed — MiRealSource-MiMLS
- 2010-01-19 Sold (Public Records) $40,000 Public Records
- 2008-11-26 Sold (MLS) $23,000 MiRealSource-MiMLS
- 2008-06-10 Listed $23,900 MiRealSource-MiMLS
- 2004-10-14 Sold (Public Records) $77,150 Public Records
- 2004-10-08 Sold (MLS) $77,150 MiRealSource-MiMLS
- 2004-09-01 Listed $74,900 MiRealSource-MiMLS
- 2004-02-29 Listed $74,900 MiRealSource-MiMLS
- 2001-04-03 Sold (Public Records) $75,000 Public Records
Property tax history
+4.1%/yrLatest (2025): $2,136 · -10.1% YoY. Source: county tax records.
Cash-flow waterfall
monthlySold comps — $/sqft
last 12 mo · ≤1 miLoading sold comps…