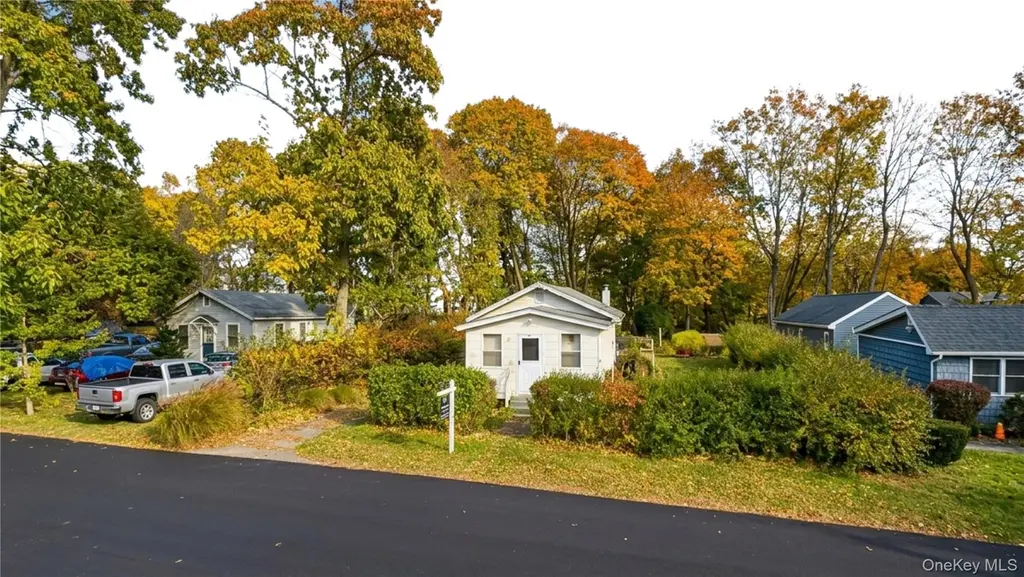
60 Kenneth Ave · Elwood, NY
Flood risk 1/10 · Minimal
- FEMA flood zone
- X (unshaded)
- Chance of flooding over 30 yrs
- 0.0%
- Est. flood insurance / yr
- $473 – $860
Fire risk 1/10 · Minimal
- Est. fire insurance / yr
- $691 – $1,283
Heat risk 5/10 · Moderate
- Hot days now (above 98°F)
- 7 days/yr
- Hot days in 30 yrs
- 15 days/yr
Wind risk 8/10 · Major
- Chance of severe wind over 30 yrs
- 80.0%
Air-quality risk 4/10 · Minor
- Unhealthy air days now
- 4 days/yr
- Unhealthy air days in 30 yrs
- 5 days/yr
Risk factors via First Street. Map © Google.
Why this score? — see what drove the D grade
The composite is a weighted blend of 9 inputs, each scored 0–100. Each bar is that input's sub-score; the figure is the points it added to the 100-point composite (weight × sub-score).
- Cash flow +11.8/30.0
- ARV discount +7.5/15.0
- Schools +6.2/10.0
- Rent growth +4.0/5.0
- DSCR +3.5/10.0
- Livability +3.5/5.0
- 1% rule +3.2/10.0
- Condition / age +2.5/5.0
- Appreciation +0.0/10.0
$425,000
🖨 Deal sheet (PDF) 📄 Offer letter ✓ Due diligence
Listing remarks
Welcome to this charming 2-bedroom, 1-bath In-Line Ranch situated on a . 18-acre lot in the Elwood School District. Built in 1955, this well-maintained home offers comfortable single-level living with an enclosed front porch, inviting living room, functional kitchen, two bedrooms, and a full bath. Additional features include oil heat with radiators, an updated boiler approximately five years old, attic storage, and a partial unfinished basement with utilities, storage space, and Bilco doors. The detached two-car garage provides ample parking and storage options. Conveniently located near shopping, restaurants, parks, transportation, and major roadways, this property presents an excellent op
Key facts
- 7,841 sq ft lot
- 2 garage spots
- Built 1955
Property features AI
Exterior
- Parking: Detached garage; 2-car garage
- Utilities: Cesspool sewer; Electricity connected; Natural gas connected
- Home design: Single family residence
- Construction: Frame construction; Shingle siding
- Exterior features: Frame construction; Shingle siding; Not waterfront
Interior
- Kitchen: Gas oven; Gas range; Refrigerator
- Bedrooms: Total of 3 rooms
- Bathrooms: 1 full bathroom
- Heating & cooling: Oil heating; Wall/window air conditioning units
- Interior features: Ceiling fans; Primary bathroom; Storage; Partial unfinished basement; Partial attic
Neighborhood map
What this means for you Summary
Snapshot
- This is a 2-bed/1.0-bath single-family listed at $425k.
Deal economics
- At list price, monthly cash flow is $-115 ($-1k/yr) — negative.
- To cash-flow at today's rent, offer at most $405k (4.8% below list).
- To meet the 1% rule (rent ≥ 1% of price), the offer needs to be $350k (17.6% below list).
- Recommended offer: $350k (17.6% below list) — sets the bar for 1% rule.
- Cap rate 6.0% vs local median 2.7% in Elwood — top-decile yield for the area; either an underpriced asset or a hidden risk that comps aren't pricing in. Stress-test before assuming the spread holds.
Location & tenants
- Location reads 70/100 on livability (#445 in NY) — a middle-class / working-renter tenant base. Strengths: crime A+, employment A+, housing A+; Watch: amenities F, commute F, cost of living F.
- Elwood Union Free School District (suburban): math 68% / reading 67% proficiency, ranked #121 of 590 in NY (top 20%) — acceptable for families but not a draw, mixed tenant base, ~2y average lease; only 15% free/reduced lunch — higher-income household profile.
- Zoned schools: James H Boyd Elementary School (math 69% / reading 73%, grade A-, #434 of 2,108 statewide, top 21%, 434 students, 18% FRL); Elwood Middle School (math 50% / reading 62%, grade B-, #205 of 729 statewide, top 29%, 461 students, 22% FRL); Elwood/John Glenn High School (math 98% / reading 54%, grade A-, #616 of 1,100 statewide, top 57%, 681 students, 21% FRL) — zoned schools at 20% FRL track the district average.
- Market conditions: Rents rising fast (+6.1%/yr); 268 active listings in the ZIP; high-income renter base; 1,366 units permitted in Suffolk County in 2024 (216 in 5+ unit buildings).
Forward outlook
- Local home prices are declining (-3.0%/yr); year-one equity from $3k of loan paydown is wiped out by about $13k of value loss. Plan a longer hold.
- Suffolk County population projected to shrink 5% by 2050 — rents likely to lag national; underwrite the cash flow, not the appreciation.
Negotiation context
- Only 2 days on market — expect competitive offers; lowballing is unlikely to land.
Risks & watch-outs
- Watch-outs: built in 1955 — expect roof / HVAC / electrical / plumbing capex.
- Climate carrying-cost: severe wind risk, 80% chance of damaging wind over 30y; extreme-heat days projected 7→15/yr by 2055 (HVAC capex compounding) — expect insurance premiums to compound above CPI over the hold.
Questions for the listing agent
- What do current leases actually rent for vs. the listed asking? Can we see a recent rent roll and the last 12 months of T-12 income?
- Built in 1955 — when were the roof, HVAC, electrical panel, plumbing, and water heater last replaced?
- Is there a deadline driving the sale (1031 exchange, divorce, estate, relocation)? That informs how much negotiation room exists.
- Schools are A-rated — typically a magnet for longer-tenancy family renters. What's the average tenant stay here, and is there a school-zone premium baked into asking?
- The area grade is low — what's the realistic commute time and amenity access for the typical tenant pool here? Any planned neighborhood developments (good or bad) we should know about?
- What's the average days-on-market for RENTAL listings here right now (not sales)? A rising rental-DOM trend means longer vacancies and softer asking-rent achievability than the comps imply.
- What's the recent tenant-quality profile in this submarket — average credit score on applications, eviction rate, late-payment / NSF rate, and stable-employment percentage? A property-management company in the area should have these aggregated.
- How much new for-sale + rental construction is in the pipeline within 1–3 miles? Heavy new supply typically softens prices + rents 12–24 months out; constrained supply supports both.
Investment metrics
- 1% rule
- 0.82% ✗
- Cap rate
- 5.97%
- Cash-on-cash
- -1.16%
- DSCR
- 0.95
- GRM
- 10.1
CMA / ARV
No comps found within radius.
Projected returns pro-forma
-3.0% appreciation · 6.14% rent growth · sell at horizon
- IRR
- -14.8%
- Equity multiple
- 0.46×
- Total profit
- $-64,777
- Equity at exit
- $63,369
- IRR
- -1.7%
- Equity multiple
- 0.87×
- Total profit
- $-15,849
- Equity at exit
- $36,746
Cash invested: $119,000 (down + closing). Projections, not guarantees.
Landlord ↔ Tenant lean methodology
- Overall (STATE)
- 15 Strongly Tenant-Friendly
- State New York
- 15 Strongly Tenant-Friendly · D+10
- County
- — inherits STATE
- City
- — inherits STATE
ZIP-level market 11743
- Rents YoY
- 6.1%
- Active inventory
- 268
- Price-to-rent
- 10.1×
Monthly cashflow live
- Estimated rent
- $3,500 medium interval (Pro) →
- Mortgage (P&I)
- −$2,229
- Tax from tax record
- −$475 /mo · $5,694/yr
- Insurance
- −$177
- HOA
- −$0
- Vacancy / Maint / Mgmt
- −$735
- Net cashflow
- $-115
Break-even live
Sensitivity live
| Price | -10% $125 | -5% $5 | +0% $-115 | +5% $-235 | +10% $-356 |
|---|---|---|---|---|---|
| Rent | -10% $-392 | -5% $-253 | +0% $-115 | +5% $23 | +10% $161 |
| Rate | -1.0pp $99 | -0.5pp $-7 | base $-115 | +0.5pp $-225 | +1.0pp $-337 |
UW: 25.0% down · 7.5% · 30yr · 1.5% tax · 5.0% vac · 8.0% maint · 8.0% mgmt
Financing live
Cash to close
- Down payment
- $106,250
- Closing costs
- $12,750
- Reserves months
- —
- Total cash needed
- —
Loan-product check · same deal, 3 products live
Conventional
25% down · 7.5% · 30yr
- Down + closing
- —
- Monthly P&I
- —
- Monthly cashflow
- —
- DSCR
- —
- Eligible?
- —
Personal DTI + credit; lowest rate.
DSCR
20% down · 8.5% · 30yr
- Down + closing
- —
- Monthly P&I
- —
- Monthly cashflow
- —
- DSCR
- —
- Eligible?
- —
No personal income docs; deal must DSCR.
Hard money
10% down · 12.0% · 12mo
- Down + closing
- —
- Monthly P&I
- —
- Monthly cashflow
- —
- DSCR
- —
- Eligible?
- —
Short-term bridge; refi at stabilization.
Listing history 9 events
-
2026-06-21statusdays on market $425,000 Active 2 DOM
-
2026-06-18days on market $425,000 Coming Soon 10 DOM
-
2026-06-17days on market $425,000 Coming Soon 9 DOM
-
2026-06-16days on market $425,000 Coming Soon 8 DOM
-
2026-06-15days on market $425,000 Coming Soon 7 DOM
-
2026-06-13days on market $425,000 Coming Soon 5 DOM
-
2026-06-13days on market $425,000 Coming Soon 4 DOM
-
2026-06-09remarks 699-char remark
-
2026-06-09$425,000 Coming Soon 1 DOM
ⓘ Source: listings_history table (triggers on properties + properties_extension) + one-shot
backfill from property_details.listing_events for pre-trigger history.
Tax reassessment forecast NY · Partial reset (capped growth)
- Current annual tax
- $5,694 · $475/mo
- Projected year-2 tax
- $6,438 · $537/mo
- Expected delta
- +$744/yr (+$62/mo · 13.1%)
ⓘ Screening estimate from a state-policy table — verify with the county assessor before closing.
Climate risk First Street
- Flood 1/10 Low FEMA zone X (unshaded) · 0% chance over 30 yrs
- Wildfire 1/10 Low
- Heat 5/10 Major 7 d/yr ≥98°F today · 15 d/yr by 30 yrs out
- Wind 8/10 Severe 80% chance of damaging wind over 30 yrs
- Air quality 4/10 Moderate 4 unhealthy d/yr today · 5 by 30 yrs out
Nearby sold comps map
Loading sold comps map…
Walkable amenities ~0.75 mi
Loading nearby amenities…
Taxation est. · year 1
- Rental income
- $42,003
- − Mortgage interest
- −$23,807
- − Property taxes
- −$5,694
- − Insurance
- −$2,125
- − Repairs & maintenance
- −$3,360
- − Management
- −$3,360
- − Depreciation
- −$12,364
- Taxable loss
- −$8,707
- Est. tax savings @ 24.0%
- +$2,090
- After-tax cash flow
- $708/yr
For passive investors: Depreciation is non-cash, so a rental often shows a tax loss while cash-flowing — sheltering income. Rental losses are passive: they offset passive income freely, and up to $25,000/yr can offset ordinary (W-2) income if you actively participate and your MAGI is under $100k (phasing out to $0 by $150k); unused losses carry forward. On sale, claimed depreciation is recaptured at up to 25%, and gains may owe capital-gains tax (a 1031 exchange can defer both). Figures are a year-1 estimate at your 24.0% rate — not tax advice; consult a CPA.
Schools (NCES district)
- District
- Elwood Union Free School District
- NCES district ID
- 3610680
- Math proficiency
- 68% ▼ -5.00%
- Reading proficiency
- 67% ▼ -3.00%
- Median HH income
- $99,849
- Composite
- 62.07/100
- National rank
- #714
- State rank
- #121 of 590 in NY
Livability — Elwood
- Score
- 70/100
- State rank
- #445
- US rank
- #7840
Category grades
Schools grade is shown separately in the Schools card above.
Census & demographics
- Census place
- Elwood, NY
- County
- Suffolk County · 679,920 people
- Metro
- New York-Newark-Jersey City, NY-NJ-PA
- Population (ZIP)
- 43,490
- Household income
- $183,187
- Rent vs Own
- Severe rent burden
- 479.0
Population outlook (Suffolk County) Hauer SSP2
- Today (2025)
- 1,505,262 people
- By 2030
- 1,498,318 · -0.5%
- By 2040
- 1,471,101 · -2.3%
- By 2050
- 1,424,848 · -5.3%
- By 2075
- 1,337,157 · -11.2%
- By 2100
- 1,217,720 · -19.1%
Race, ethnicity, and origin ACS 2023
- Neighborhood character
- Predominantly White (75%)
- Race & ethnicity
- White 75% Hispanic / Latino 12% Two or more races 10% Asian 5% Black 4%
- Hispanic origin (detail)
- Puerto Rican 4%
- Common ancestry
- Romanian 6% Scotch-Irish 3% Slovak 2%
- Foreign-born
- 11% · Canada, China, Jamaica
- Languages at home
- 83% English-only · Spanish 9% Other Indo-European 3% Chinese 1%
Political lean MEDSL · Suffolk
- 2024 margin
- Lean R (+10.0) · D 45.0% · R 55.0%
- 2008→2024 swing
- -16.0pp toward R · 2008: 6.0pp · 2024: -10.0pp
- All cycles
- 2024: R+10.0 2020: R+0.0 2016: R+8.2 2012: D+2.9 2008: D+6.0
Not yet ingested
- Civics
- —
Market trends
- HPI YoY
- ▼ -659.59%
- Current HPI
- 279.0693
- Rent YoY
- ▲ 6.14%
- Metro
- New York-Newark-Jersey City, NY-NJ-PA
- State GDP YoY
- ▲ 2.60%
- F500 in state
- 92
Industry mix (Fortune 500 HQ in NY)
| Industry | F500 HQs | Revenue |
|---|---|---|
| Financial Services | 10 | $950B |
|
||
| Consumer Goods | 9 | $162B |
|
||
| Insurance | 4 | $225B |
|
||
| Telecommunications | 2 | $144B |
|
||
| Pharmaceuticals | 2 | $112B |
|
||
| Media / Entertainment | 2 | $69B |
|
||
Price history
1 event — show timeline
- 2026-06-08 Coming Soon $425,000 OneKey® MLS as Distributed by MLS Grid
Property tax history
+3.1%/yrLatest (2025): $5,694 · +0.0% YoY. Source: county tax records.
Cash-flow waterfall
monthlySold comps — $/sqft
last 12 mo · ≤1 miLoading sold comps…