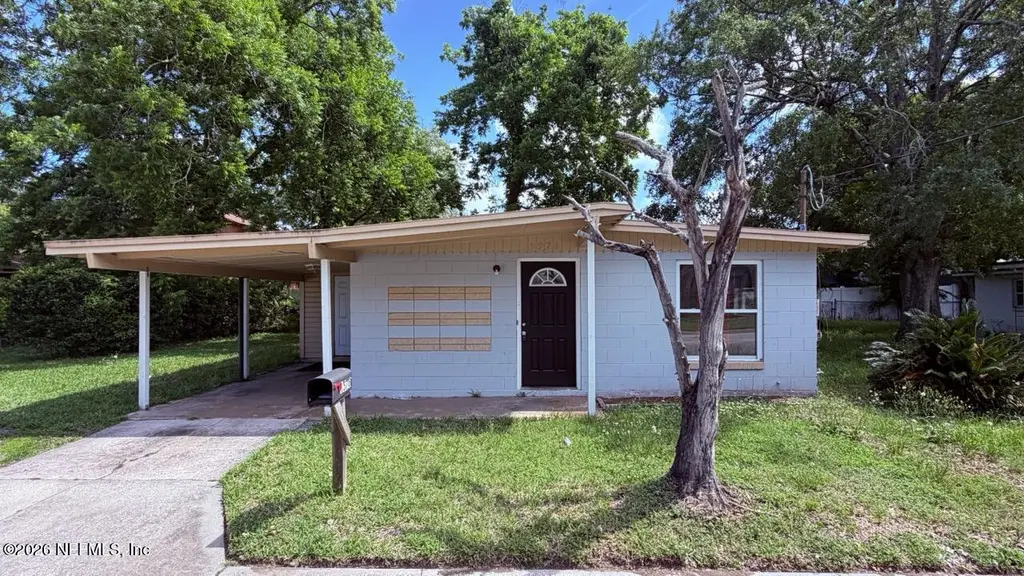
1576 W 13th St · Jacksonville, FL
Flood risk 6/10 · Moderate
- FEMA flood zone
- X (unshaded)
- Chance of flooding over 30 yrs
- 0.73%
- Est. flood insurance / yr
- $507 – $1,088
Fire risk 1/10 · Minimal
- Est. fire insurance / yr
- $947 – $1,759
Heat risk 9/10 · Severe
- Hot days now (above 107°F)
- 7 days/yr
- Hot days in 30 yrs
- 20 days/yr
Wind risk 9/10 · Severe
- Chance of severe wind over 30 yrs
- 99.0%
Air-quality risk 4/10 · Minor
- Unhealthy air days now
- 6 days/yr
- Unhealthy air days in 30 yrs
- 6 days/yr
Risk factors via First Street. Map © Google.
Why this score? — see what drove the C+ grade
The composite is a weighted blend of 9 inputs, each scored 0–100. Each bar is that input's sub-score; the figure is the points it added to the 100-point composite (weight × sub-score).
- Cash flow +26.3/30.0
- DSCR +8.9/10.0
- 1% rule +6.9/10.0
- ARV discount +5.1/15.0
- Livability +4.2/5.0
- Schools +3.9/10.0
- Rent growth +3.0/5.0
- Condition / age +2.5/5.0
- Appreciation +0.0/10.0
$92,000
🖨 Deal sheet 📄 Offer letter ✓ Due diligence
Listing remarks
Charming 3-bedroom, 1-bath home just minutes from downtown Jacksonville! This well-maintained property features concrete block construction, and a 2021 water heater for added peace of mind. Rental-ready with strong income potential or ideal for an owner-occupant. Conveniently located near shopping, dining, entertainment, and major commuter routes. Seller is not offering seller financing. Cash or hard money preferred. No assignable contracts. Don't miss this great opportunity!
Key facts
- Rental ready
- 2021 water heater
- 4,356 sq ft lot
Tags
Property features AI
Finance
- HOA & community: Not a senior community
Exterior
- Parking: Carport (1 space)
- Utilities: Sewer connected; Water connected
- Home design: Single-family residence; Used as single-family residential
- Exterior features: Lot approximately 0.1 acres; No private pool
Interior
- Kitchen: Electric oven; Electric range
- Bedrooms: 3 bedrooms
- Bathrooms: 1 full bathroom
- Heating & cooling: Central heating; Central air conditioning
- Interior features: Electric oven; Electric range
Neighborhood map
What this means for you Summary
Snapshot
- This is a 3-bed/1.0-bath single-family listed at $92k.
Deal economics
- At list price, monthly cash flow is $237 ($3k/yr) — positive.
- The deal already cash-flows at list — no discount required.
- Meets the 1% rule at list price ($1k rent vs $92k).
- Recommended offer: $91k (1.5% below list) — sets the bar for market timing.
- Cap rate 9.4% vs local median 4.0% in Jacksonville — top-decile yield for the area; either an underpriced asset or a hidden risk that comps aren't pricing in. Stress-test before assuming the spread holds.
Location & tenants
- Location reads 83/100 on livability (#50 in FL, #911 nationally) — a professional / high-income tenant draw. Strengths: amenities A+, commute A+, housing A+.
- Duval (urban): math 46% / reading 45% proficiency, ranked #48 of 73 in FL (top 66%) — families likely to look elsewhere, expect single-tenant / working-renter base with shorter leases.
- Market conditions: Rents rising (+1.8%/yr); 394 active listings in the ZIP; 40 comparable units currently listed for rent nearby; rentals at typical pace (median 24d on market — plan ~3-4 weeks tenant-placement turnaround); lower-income renter base — watch delinquency; 6,503 units permitted in Duval County in 2024 (1,131 in 5+ unit buildings).
- This rent runs 43% of the median local income ($31k/yr) — at the standard rent-burdened threshold; future hikes will face affordability resistance.
Forward outlook
- Local home prices are declining (-3.0%/yr); year-one equity from $636 of loan paydown is wiped out by about $3k of value loss. Plan a longer hold.
- Duval County population projected at +19% by 2050 — long-run rental-demand tailwind backs the buy-and-hold thesis.
Negotiation context
- It's been on market 17 days — a 2% lower offer ($91k) is reasonable based on typical stale-listing flexibility.
- 2 sale attempts since 2y ago; this cycle's ask has dropped $6k (6%) from the opening price — seller is motivated, your offer sets the floor, not the list.
- Current owner paid $44k; list at $92k implies a 109% gain — meaningful room to come down on a strong offer.
Risks & watch-outs
- Watch-outs: built in 1959 — expect roof / HVAC / electrical / plumbing capex.
- Climate carrying-cost: major flood risk; severe wind risk, 99% chance of damaging wind over 30y; extreme-heat days projected 7→20/yr by 2055 (HVAC capex compounding) — expect insurance premiums to compound above CPI over the hold.
Questions for the listing agent
- Built in 1959 — when were the roof, HVAC, electrical panel, plumbing, and water heater last replaced?
- Is there a deadline driving the sale (1031 exchange, divorce, estate, relocation)? That informs how much negotiation room exists.
- Schools are B-rated — typically a magnet for longer-tenancy family renters. What's the average tenant stay here, and is there a school-zone premium baked into asking?
- What's the average days-on-market for RENTAL listings here right now (not sales)? A rising rental-DOM trend means longer vacancies and softer asking-rent achievability than the comps imply.
- What's the recent tenant-quality profile in this submarket — average credit score on applications, eviction rate, late-payment / NSF rate, and stable-employment percentage? A property-management company in the area should have these aggregated.
- How much new for-sale + rental construction is in the pipeline within 1–3 miles? Heavy new supply typically softens prices + rents 12–24 months out; constrained supply supports both.
Investment metrics
- 1% rule
- 1.19% ✓
- Cap rate
- 9.39%
- Cash-on-cash
- 11.06%
- DSCR
- 1.49
- GRM
- 7.0
CMA / ARV
- ARV (on-the-fly)
- $87,264
- Comps found
- 12
Show comp detail 12 sales within ~0.75 mi
| Address | Dist | Beds/Ba | Sqft | Sold | Price | $/sf | Match |
|---|---|---|---|---|---|---|---|
| 1526 W 14th St | 0.08mi | 3/1.0 | 916 (+6%) | 3mo | $95,000 | $104 | 84 |
| 1753 W 12th St | 0.22mi | 3/1.0 | 827 (-4%) | 4mo | $45,000 | $54 | 79 |
| 1593 W 11th St | 0.10mi | 2/1.0 (-1) | 920 (+6%) | 6mo | $125,000 | $136 | 74 |
| 1751 W 20th St | 0.42mi | 2/1.0 (-1) | 880 (+2%) | 2mo | $27,500 | $31 | 71 |
| 2715 Myrtle Ave N | 0.43mi | 2/1.0 (-1) | 900 (+4%) | 3mo | $98,000 | $109 | 66 |
| 2031 Danson St | 0.73mi | 2/1.0 (-1) | 864 (0%) | 6mo | $72,000 | $83 | 56 |
| 1901 Pullman Ct | 0.44mi | 2/1.0 (-1) | 969 (+12%) | 0mo | $98,000 | $101 | 54 |
| 1480 N Myrtle Ave N | 0.65mi | 2/1.0 (-1) | 916 (+6%) | 2mo | $60,000 | $66 | 53 |
| 1279 W 20th St | 0.53mi | 2/1.0 (-1) | 962 (+11%) | 1mo | $87,500 | $91 | 50 |
| 1339 Hart St | 0.68mi | 2/2.0 (-1) | 818 (-5%) | 4mo | $199,017 | $243 | 46 |
| 1536 W 3rd St | 0.71mi | 2/1.0 (-1) | 776 (-10%) | 1mo | $107,000 | $138 | 44 |
| 1149 W 20th St | 0.67mi | 2/1.0 (-1) | 768 (-11%) | 4mo | $60,000 | $78 | 42 |
Match score weights: distance 35% · size 25% · config 20% · recency 20%. Top-matched comps best support the ARV.
Projected returns pro-forma
-3.0% appreciation · 1.81% rent growth · sell at horizon
- IRR
- -1.1%
- Equity multiple
- 0.96×
- Total profit
- $-1,073
- Equity at exit
- $13,717
- IRR
- 7.3%
- Equity multiple
- 1.52×
- Total profit
- $13,396
- Equity at exit
- $7,954
Cash invested: $25,760 (down + closing). Projections, not guarantees.
Landlord ↔ Tenant lean methodology
- Overall (STATE)
- 87 Strongly Landlord-Friendly
- State Florida
- 87 Strongly Landlord-Friendly · R+3
- County
- — inherits STATE
- City
- — inherits STATE
ZIP-level market 32209
- Home prices YoY
- -22.1%
- Rents YoY
- 1.8%
- Active inventory
- 394
- Price-to-rent
- 7.0×
Monthly cashflow live
- Estimated rent
- $1,092 high interval (Pro) →
- Mortgage (P&I)
- −$482
- Tax from tax record
- −$104 /mo · $1,250/yr
- Insurance
- −$38
- HOA
- −$0
- Vacancy / Maint / Mgmt
- −$229
- Net cashflow
- $237
Break-even live
UW: 25.0% down · 7.5% · 30yr · 1.5% tax · 5.0% vac · 8.0% maint · 8.0% mgmt
Financing live
Cash to close
- Down payment
- $23,000
- Closing costs
- $2,760
- Reserves months
- —
- Total cash needed
- —
Loan-product check · same deal, 3 products live
Conventional
25% down · 7.5% · 30yr
- Down + closing
- —
- Monthly P&I
- —
- Monthly cashflow
- —
- DSCR
- —
- Eligible?
- —
Personal DTI + credit; lowest rate.
DSCR
20% down · 8.5% · 30yr
- Down + closing
- —
- Monthly P&I
- —
- Monthly cashflow
- —
- DSCR
- —
- Eligible?
- —
No personal income docs; deal must DSCR.
Hard money
10% down · 12.0% · 12mo
- Down + closing
- —
- Monthly P&I
- —
- Monthly cashflow
- —
- DSCR
- —
- Eligible?
- —
Short-term bridge; refi at stabilization.
Rent comps 40 comps
| Address | Beds | Baths | Sqft | Rent | $/sqft | DOM | Units | Dist |
|---|---|---|---|---|---|---|---|---|
| 1525 W 15th St Jacksonville, FL | 3.0 | 1.0 | 1100 | $1,245 | $1.13 | 24d | 1 | 0.15mi |
| 1538 Ella St Unit 1 Jacksonville, FL | 2.0 | 1.0 | 700 | $1,100 | $1.57 | 24d | 1 | 0.25mi |
| 2310 Fairfax St Jacksonville, FL | 2.0 | 1.0 | 726 | $600 | $0.83 | 24d | 1 | 0.27mi |
| 2306 Fairfax St Unit 1 Jacksonville, FL | 3.0 | 1.0 | 900 | $700 | $0.78 | 24d | 1 | 0.27mi |
| 2306 Fairfax St Unit 3 Jacksonville, FL | 2.0 | 1.0 | 700 | $650 | $0.93 | 24d | 1 | 0.27mi |
| 2312 Fairfax St Jacksonville, FL | 3.0 | 1.0 | 726 | $650 | $0.90 | 17d | 1 | 0.27mi |
| 1923 Fairfax St Jacksonville, FL | 2.0 | 1.0 | 616 | $835 | $1.36 | 15d | 1 | 0.29mi |
| 1824 W 14th St Unit 3 Jacksonville, FL | 2.0 | 1.0 | 674 | $775 | $1.15 | 24d | 1 | 0.30mi |
| 1845 W 13th St Unit 1 Jacksonville, FL | 2.0 | 1.0 | 800 | $850 | $1.06 | 24d | 1 | 0.32mi |
| 1570 Mc Conihe St Unit B Jacksonville, FL | 2.0 | 1.0 | 714 | $875 | $1.23 | 24d | 1 | 0.33mi |
| 1537 W 7th St Jacksonville, FL | 3.0 | 1.0 | 950 | $1,050 | $1.11 | 8d | 1 | 0.36mi |
| 1537 7th St W Unit B Jacksonville, FL | 3.0 | 1.0 | 950 | $1,050 | $1.11 | 24d | 1 | 0.37mi |
| 1593 W 21st St Jacksonville, FL | 2.0 | 1.0 | 805 | $922 | $1.15 | 24d | 1 | 0.40mi |
| 1526 W 22nd St Jacksonville, FL | 2.0 | 1.0 | 624 | $900 | $1.44 | 16d | 1 | 0.43mi |
| 1901 Pullman Ct Jacksonville, FL | 2.0 | 1.0 | 969 | $1,295 | $1.34 | 8d | 1 | 0.44mi |
| 1359 W 20th St Jacksonville, FL | 2.0 | 1.0 | 901 | $1,134 | $1.26 | 17d | 1 | 0.45mi |
| 2811 N Myrtle Ave #1 Jacksonville, FL | 2.0 | 2.0 | 855 | $1,121 | $1.31 | 4d | 1 | 0.45mi |
| 1776 Spires Ave Unit 2 Jacksonville, FL | 2.0 | 1.0 | 800 | $1,125 | $1.41 | 4d | 1 | 0.47mi |
| 2210 Pullman Ave Jacksonville, FL | 3.0 | 1.0 | 940 | $1,050 | $1.12 | 3d | 1 | 0.48mi |
| 1645 W 23rd St Unit 2 Jacksonville, FL | 3.0 | 1.0 | 912 | $1,275 | $1.40 | 24d | 1 | 0.51mi |
| 1934 Ella St Jacksonville, FL | 3.0 | 1.0 | 1045 | $1,095 | $1.05 | 20d | 1 | 0.52mi |
| 1666 Myrtle Ave N Unit 1666 Jacksonville, FL | 2.0 | 1.0 | 700 | $925 | $1.32 | 24d | 1 | 0.52mi |
| 1478 W 5th St Jacksonville, FL | 3.0 | 1.0 | 960 | $1,225 | $1.28 | 24d | 1 | 0.56mi |
| 1478 W 5th St Jacksonville, FL | 3.0 | 1.0 | 960 | $1,225 | $1.28 | 4d | 1 | 0.56mi |
| 1460 W 5th St Jacksonville, FL | 2.0 | 1.0 | 675 | $875 | $1.30 | 12d | 1 | 0.57mi |
| 1460 W 5th St Unit 1 Jacksonville, FL | 2.0 | 1.0 | 700 | $850 | $1.21 | 12d | 1 | 0.57mi |
| 2116 McMillan St Jacksonville, FL | 3.0 | 1.5 | 1120 | $1,425 | $1.27 | 21d | 1 | 0.58mi |
| 2016 McMillan St Jacksonville, FL | 2.0 | 1.0 | 812 | $650 | $0.80 | 24d | 1 | 0.59mi |
| 2904 Moncrief Rd Jacksonville, FL | 3.0 | 1.0 | 952 | $1,100 | $1.16 | 24d | 1 | 0.60mi |
| 1640 W 4th St Unit 1 Jacksonville, FL | 4.0 | 2.0 | 1119 | $1,675 | $1.50 | 20d | 1 | 0.61mi |
| 2604 McMillan St Jacksonville, FL | 3.0 | 1.0 | 912 | $1,100 | $1.21 | 21d | 1 | 0.61mi |
| 1788 W 5th St Jacksonville, FL | 3.0 | 2.0 | 948 | $1,295 | $1.37 | 24d | 1 | 0.61mi |
| 1363 W 24th St Jacksonville, FL | 2.0 | 1.0 | 660 | $995 | $1.51 | 4d | 1 | 0.61mi |
| 2036 W 11th St Jacksonville, FL | 2.0 | 2.5 | 698 | $1,250 | $1.79 | 21d | 1 | 0.64mi |
| 1971 W 22nd St Jacksonville, FL | 3.0 | 1.0 | 1094 | $1,095 | $1.00 | 8d | 1 | 0.64mi |
| 2040 W 15th St Jacksonville, FL | 2.0 | 1.0 | 1036 | $1,050 | $1.01 | 24d | 1 | 0.65mi |
| 1625 W 26th St Jacksonville, FL | 2.0 | 1.0 | 750 | $800 | $1.07 | 2d | 1 | 0.65mi |
| 1625 W 26th St Unit 4 Jacksonville, FL | 2.0 | 1.0 | 750 | $900 | $1.20 | 24d | 1 | 0.65mi |
| 1625 W 26th St Unit 2 Jacksonville, FL | 2.0 | 1.0 | 750 | $800 | $1.07 | 24d | 1 | 0.65mi |
| 2532 Moncrief Rd Jacksonville, FL | 2.0 | 1.0 | 700 | $900 | $1.29 | 24d | 1 | 0.65mi |
Listing history 15 events
-
2026-06-05statusdays on market $92,000 Pending 17 DOM
-
2026-06-03days on market $92,000 Active 16 DOM
-
2026-06-02days on market $92,000 Active 15 DOM
-
2026-06-01days on market $92,000 Active 14 DOM
-
2026-05-31days on market $92,000 Active 13 DOM
-
2026-05-18$98,000 Active
-
2024-04-12historical $1,011
-
2024-03-20price $1,011
-
2024-02-22price $1,022
-
2024-02-06price $1,032
-
2024-01-25price $1,098
-
2024-01-18price $1,246
-
2024-01-11$1,283
-
2021-09-14soldstatus $44,000
-
1972-07-03soldstatus $11,500
ⓘ Source: listings_history table (triggers on properties + properties_extension) + one-shot
backfill from property_details.listing_events for pre-trigger history.
Tax reassessment forecast FL · Resets to sale price
- Current annual tax
- $1,250 · $104/mo
- Projected year-2 tax
- $1,250 · $104/mo
- Expected delta
- $0/yr ($0/mo · 0.0%)
ⓘ Screening estimate from a state-policy table — verify with the county assessor before closing.
Climate risk First Street
- Flood 6/10 Major FEMA zone X (unshaded) · 73% chance over 30 yrs
- Wildfire 1/10 Low
- Heat 9/10 Extreme 7 d/yr ≥107°F today · 20 d/yr by 30 yrs out
- Wind 9/10 Extreme 99% chance of damaging wind over 30 yrs
- Air quality 4/10 Moderate 6 unhealthy d/yr today · 6 by 30 yrs out
Nearby sold comps map
Loading sold comps map…
Walkable amenities ~0.75 mi
Loading nearby amenities…
Taxation est. · year 1
- Rental income
- $13,099
- − Mortgage interest
- −$5,153
- − Property taxes
- −$1,250
- − Insurance
- −$460
- − Repairs & maintenance
- −$1,048
- − Management
- −$1,048
- − Depreciation
- −$2,676
- Taxable income
- $1,463
- Est. tax owed @ 24.0%
- −$351
- After-tax cash flow
- $2,497/yr
For passive investors: Depreciation is non-cash, so a rental often shows a tax loss while cash-flowing — sheltering income. Rental losses are passive: they offset passive income freely, and up to $25,000/yr can offset ordinary (W-2) income if you actively participate and your MAGI is under $100k (phasing out to $0 by $150k); unused losses carry forward. On sale, claimed depreciation is recaptured at up to 25%, and gains may owe capital-gains tax (a 1031 exchange can defer both). Figures are a year-1 estimate at your 24.0% rate — not tax advice; consult a CPA.
Schools (NCES district)
- District
- Duval
- NCES district ID
- 1200480
- Math proficiency
- 46% ▼ -11.00%
- Reading proficiency
- 45% ▼ -4.00%
- Median HH income
- $48,987
- Composite
- 38.97/100
- National rank
- #4076
- State rank
- #48 of 73 in FL
Livability — Jacksonville
- Score
- 83/100
- State rank
- #50
- US rank
- #911
Category grades
Schools grade is shown separately in the Schools card above.
Census & demographics
- Census place
- Jacksonville, FL
- County
- Duval County · 1,015,274 people
- City population
- 979,034
- Metro
- Jacksonville, FL
- Population (ZIP)
- 34,657
- Household income
- $30,514
- Rent vs Own
- Severe rent burden
- 2921.0
Population outlook (Duval County) Hauer SSP2
- Today (2025)
- 1,013,010 people
- By 2030
- 1,059,228 · +4.6%
- By 2040
- 1,141,439 · +12.7%
- By 2050
- 1,205,258 · +19.0%
- By 2075
- 1,324,282 · +30.7%
- By 2100
- 1,319,620 · +30.3%
Race, ethnicity, and origin ACS 2023
- Neighborhood character
- Predominantly Black (88%)
- Race & ethnicity
- Black 88% White 5% Hispanic / Latino 5% Two or more races 2%
- Hispanic origin (detail)
- Puerto Rican 3%
- Common ancestry
- Hispanic 1% Romanian 1%
- Foreign-born
- 3% · Canada
- Languages at home
- 95% English-only · Spanish 4% French/Haitian/Cajun 1%
Political lean MEDSL · Duval
- 2024 margin
- Toss-up / Even · D 48.7% · R 50.1% · Other 1.2%
- 2008→2024 swing
- +0.4pp no change · 2008: -1.9pp · 2024: -1.5pp
- All cycles
- 2024: R+1.5 2020: D+3.8 2016: R+1.5 2012: R+3.6 2008: R+1.9
Not yet ingested
- Civics
- —
Market trends
- HPI YoY
- ▼ -53.92%
- Current HPI
- 189.5977
- Rent YoY
- ▲ 1.81%
- Metro
- Jacksonville, FL
- State GDP YoY
- ▲ 3.28%
- F500 in state
- 36
Industry mix (Fortune 500 HQ in FL)
| Industry | F500 HQs | Revenue |
|---|---|---|
| Industrial Technology | 2 | $29B |
|
||
| Insurance | 2 | $17B |
|
||
| Retail | 1 | $60B |
|
||
| Technology Distribution | 1 | $58B |
|
||
| Homebuilding | 1 | $35B |
|
||
| Technology Manufacturing | 1 | $35B |
|
||
Price history
+752.2% since first listed10 events — show timeline
- 2026-05-18 Listed $98,000 realMLS
- 2024-04-12 Rental Removed $1,011 RENT.
- 2024-03-20 Price Changed $1,011 RENT.
- 2024-02-22 Price Changed $1,022 RENT.
- 2024-02-06 Price Changed $1,032 RENT.
- 2024-01-25 Price Changed $1,098 RENT.
- 2024-01-18 Price Changed $1,246 RENT.
- 2024-01-11 Listed for Rent $1,283 RENT.
- 2021-09-14 Sold (Public Records) $44,000 Public Records
- 1972-07-03 Sold (Public Records) $11,500 Public Records
Property tax history
+5.1%/yrLatest (2025): $1,250 · +30.0% YoY. Source: county tax records.
Cash-flow waterfall
monthlySold comps — $/sqft
last 12 mo · ≤1 miLoading sold comps…