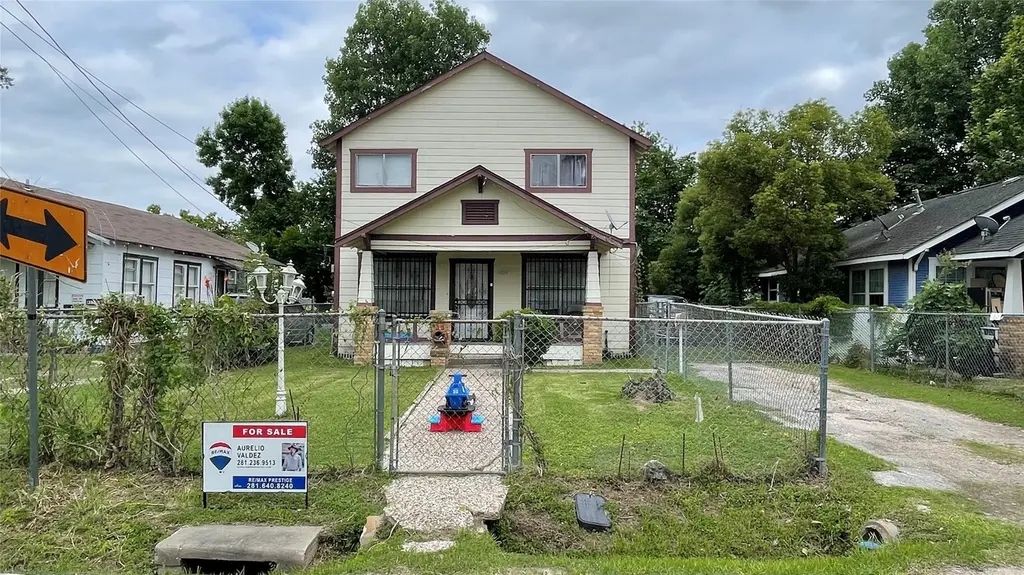
4010 Beggs St · Houston, TX
Flood risk 6/10 · Moderate
- FEMA flood zone
- X (unshaded)
- Chance of flooding over 30 yrs
- 0.69%
- Est. flood insurance / yr
- $507 – $1,088
Fire risk 1/10 · Minimal
- Est. fire insurance / yr
- $1,222 – $2,270
Heat risk 9/10 · Severe
- Hot days now (above 109°F)
- 7 days/yr
- Hot days in 30 yrs
- 24 days/yr
Wind risk 9/10 · Severe
- Chance of severe wind over 30 yrs
- 99.0%
Air-quality risk 3/10 · Minor
- Unhealthy air days now
- 2 days/yr
- Unhealthy air days in 30 yrs
- 3 days/yr
Risk factors via First Street. Map © Google.
Why this score? — see what drove the D grade
The composite is a weighted blend of 9 inputs, each scored 0–100. Each bar is that input's sub-score; the figure is the points it added to the 100-point composite (weight × sub-score).
- ARV discount +15.0/15.0
- Cash flow +9.7/30.0
- Livability +3.7/5.0
- 1% rule +3.4/10.0
- DSCR +2.7/10.0
- Rent growth +2.7/5.0
- Schools +2.7/10.0
- Condition / age +2.5/5.0
- Appreciation +0.0/10.0
$290,000
🖨 Deal sheet (PDF) 📄 Offer letter ✓ Due diligence
Listing remarks
Come check out this 3-bedroom 2-bathroom home located just 10 minutes away from Downtown! This home is ready for renovations to truly add your own personal touches. Primary bedroom and bathroom are located on the first floor along with the living room and the kitchen/dining area. The other two bedrooms are located on the 2nd floor along with a secondary bathroom. Take advantage of the location, where you are just minutes away from EaDo, Downtown, Heights area, Midtown, and Montrose.
Key facts
- Heights area
- Living room
- Eado
Tags
Property features AI
Exterior
- Utilities: Public water
- Home design: Residential property; Built in 1950
- Construction: Wood siding; Block foundation; Composition roof
- Exterior features: Cleared lot
Interior
- Bedrooms: Primary bedroom (first level); Two additional bedrooms (second level)
- Bathrooms: 2 full bathrooms
- Heating & cooling: Central heating (electric); Central air conditioning (electric)
- Interior features: Den; Living room; Dining room
Neighborhood map
What this means for you Summary
Snapshot
- This is a 3-bed/1.0-bath single-family listed at $290k.
Deal economics
- At list price, monthly cash flow is $-191 ($-2k/yr) — negative.
- To cash-flow at today's rent, offer at most $256k (11.6% below list).
- To meet the 1% rule (rent ≥ 1% of price), the offer needs to be $244k (15.9% below list).
- Recommended offer: $244k (15.9% below list) — sets the bar for 1% rule.
- Cap rate 5.5% vs local median 3.2% in Houston — top-decile yield for the area; either an underpriced asset or a hidden risk that comps aren't pricing in. Stress-test before assuming the spread holds.
Location & tenants
- Location reads 74/100 on livability (#184 in TX, #4,771 nationally) — a middle-class / working-renter tenant base. Strengths: amenities A+, cost of living A+, housing A+; Watch: crime F.
- Houston ISD (urban): math 27% / reading 35% proficiency, ranked #593 of 826 in TX (top 72%) — families likely to look elsewhere, expect single-tenant / working-renter base with shorter leases; 71% free/reduced lunch — lower-income household profile, screen leases tightly.
- Zoned schools: Looscan El (math 22% / reading 27%, grade F, #3,052 of 4,322 statewide, top 74%, 262 students, 98% FRL); Marshall Middle (math 14% / reading 22%, grade F, #1,491 of 1,662 statewide, top 91%, 607 students, 97% FRL); Northside H S (math 15% / reading 26%, grade F, #1,389 of 1,632 statewide, top 86%, 1,168 students, 94% FRL) — zoned schools average 96% FRL vs 71% district-wide (25 pts higher); higher-poverty schools than district average — tighter screening recommended.
- Market conditions: Rents flat; 605 active listings in the ZIP; 27 comparable units currently listed for rent nearby; rentals at typical pace (median 19d on market — plan ~3-4 weeks tenant-placement turnaround); 41% of comp listings sitting > 30 days — soft ceiling on asking rent; solid renter incomes; 29,883 units permitted in Harris County in 2024 (8,621 in 5+ unit buildings).
- This rent runs 35% of the median local income ($83k/yr) — at the standard rent-burdened threshold; future hikes will face affordability resistance.
Forward outlook
- Local home prices are declining (-3.0%/yr); year-one equity from $2k of loan paydown is wiped out by about $9k of value loss. Plan a longer hold.
- Harris County population projected at +47% by 2050 — long-run rental-demand tailwind backs the buy-and-hold thesis.
Negotiation context
- It's been on market 48 days — a 3% lower offer ($281k) is reasonable based on typical stale-listing flexibility.
Risks & watch-outs
- Watch-outs: built in 1950 — expect roof / HVAC / electrical / plumbing capex.
- Climate carrying-cost: major flood risk; severe wind risk, 99% chance of damaging wind over 30y; extreme-heat days projected 7→24/yr by 2055 (HVAC capex compounding) — expect insurance premiums to compound above CPI over the hold.
Questions for the listing agent
- What do current leases actually rent for vs. the listed asking? Can we see a recent rent roll and the last 12 months of T-12 income?
- It's been on market 48 days. Have you received any prior offers? Is the seller open to a 16% concession, seller financing, or rate buy-down credit?
- Built in 1950 — when were the roof, HVAC, electrical panel, plumbing, and water heater last replaced?
- Is there a deadline driving the sale (1031 exchange, divorce, estate, relocation)? That informs how much negotiation room exists.
- Schools are D-rated, which usually means shorter tenancies and higher turnover. Who's the typical renter profile here, and what's been the actual vacancy rate?
- Crime grade is F in this area — have there been break-ins, vandalism, or insurance claims at this property in the last 3 years? What carrier currently insures it and at what premium?
- The area grade is low — what's the realistic commute time and amenity access for the typical tenant pool here? Any planned neighborhood developments (good or bad) we should know about?
- What's the average days-on-market for RENTAL listings here right now (not sales)? A rising rental-DOM trend means longer vacancies and softer asking-rent achievability than the comps imply.
- What's the recent tenant-quality profile in this submarket — average credit score on applications, eviction rate, late-payment / NSF rate, and stable-employment percentage? A property-management company in the area should have these aggregated.
- How much new for-sale + rental construction is in the pipeline within 1–3 miles? Heavy new supply typically softens prices + rents 12–24 months out; constrained supply supports both.
Investment metrics
- 1% rule
- 0.84% ✗
- Cap rate
- 5.50%
- Cash-on-cash
- -2.83%
- DSCR
- 0.87
- GRM
- 9.9
CMA / ARV
- ARV (median comp)
- $412,326
- List price
- $290,000
- Delta
- -29.67%
- Verdict
- UNDERPRICED
- Comps
- 20 within 1.0 mi
Show comp detail 12 sales within ~0.75 mi
| Address | Dist | Beds/Ba | Sqft | Sold | Price | $/sf | Match |
|---|---|---|---|---|---|---|---|
| 3606 Billingsley St | 0.32mi | 3/2.5 | 1,640 (-1%) | 2mo | $419,000 | $255 | 75 |
| 3605 Billingsley St Unit A | 0.30mi | 3/2.5 | 1,596 (-4%) | 1mo | $340,000 | $213 | 72 |
| 4709 Edison St | 0.41mi | 3/2.0 | 1,699 (+2%) | 2mo | $275,000 | $162 | 72 |
| 3424 Elser St | 0.56mi | 3/2.5 | 1,599 (-4%) | 1mo | $349,000 | $218 | 60 |
| 3420 Elser St | 0.56mi | 3/2.5 | 1,599 (-4%) | 1mo | $349,000 | $218 | 60 |
| 4607 Cetti St | 0.50mi | 4/1.0 (+1) | 1,817 (+9%) | 1mo | $399,900 | $220 | 55 |
| 804 Enid St Unit A | 0.60mi | 3/2.5 | 1,784 (+7%) | 1mo | $479,900 | $269 | 53 |
| 406 Gale St | 0.58mi | 4/2.0 (+1) | 1,511 (-9%) | 4mo | $349,900 | $232 | 45 |
| 509 Vincent St | 0.48mi | 4/3.0 (+1) | 1,859 (+12%) | 2mo | $549,000 | $295 | 44 |
| 709 Walton St | 0.67mi | 3/2.0 | 1,428 (-14%) | 4mo | $539,000 | $377 | 38 |
| 1305 Amundsen St N | 0.68mi | 3/2.5 | 1,882 (+13%) | 4mo | $389,999 | $207 | 38 |
| 1206 Moody St | 0.74mi | 3/3.5 | 1,839 (+10%) | 3mo | $389,000 | $212 | 36 |
Match score weights: distance 35% · size 25% · config 20% · recency 20%. Top-matched comps best support the ARV.
Projected returns pro-forma
-3.0% appreciation · 0.84% rent growth · sell at horizon
- IRR
- -23.6%
- Equity multiple
- 0.21×
- Total profit
- $-64,251
- Equity at exit
- $43,240
- IRR
- -26.0%
- Equity multiple
- -0.13×
- Total profit
- $-91,585
- Equity at exit
- $25,074
Cash invested: $81,200 (down + closing). Projections, not guarantees.
Landlord ↔ Tenant lean methodology
- Overall (STATE)
- 87 Strongly Landlord-Friendly
- State Texas
- 87 Strongly Landlord-Friendly · R+5
- County
- — inherits STATE
- City
- — inherits STATE
ZIP-level market 77009
- Rents YoY
- 0.8%
- Active inventory
- 605
- Price-to-rent
- 9.9×
Monthly cashflow live
- Estimated rent
- $2,439 high interval (Pro) →
- Mortgage (P&I)
- −$1,521
- Tax from tax record
- −$477 /mo · $5,721/yr
- Insurance
- −$121
- HOA
- −$0
- Vacancy / Maint / Mgmt
- −$512
- Net cashflow
- $-191
Break-even live
Sensitivity live
| Price | -10% $-27 | -5% $-109 | +0% $-191 | +5% $-273 | +10% $-355 |
|---|---|---|---|---|---|
| Rent | -10% $-384 | -5% $-288 | +0% $-191 | +5% $-95 | +10% $2 |
| Rate | -1.0pp $-45 | -0.5pp $-117 | base $-191 | +0.5pp $-266 | +1.0pp $-343 |
UW: 25.0% down · 7.5% · 30yr · 1.5% tax · 5.0% vac · 8.0% maint · 8.0% mgmt
Financing live
Cash to close
- Down payment
- $72,500
- Closing costs
- $8,700
- Reserves months
- —
- Total cash needed
- —
Loan-product check · same deal, 3 products live
Conventional
25% down · 7.5% · 30yr
- Down + closing
- —
- Monthly P&I
- —
- Monthly cashflow
- —
- DSCR
- —
- Eligible?
- —
Personal DTI + credit; lowest rate.
DSCR
20% down · 8.5% · 30yr
- Down + closing
- —
- Monthly P&I
- —
- Monthly cashflow
- —
- DSCR
- —
- Eligible?
- —
No personal income docs; deal must DSCR.
Hard money
10% down · 12.0% · 12mo
- Down + closing
- —
- Monthly P&I
- —
- Monthly cashflow
- —
- DSCR
- —
- Eligible?
- —
Short-term bridge; refi at stabilization.
Rent comps 27 comps
| Address | Beds | Baths | Sqft | Rent | $/sqft | DOM | Units | Dist |
|---|---|---|---|---|---|---|---|---|
| 1039 Hillstar St Houston, TX | 3.0 | 2.5 | 1780 | $2,750 | $1.54 | 14d | 1 | 0.44mi |
| 914 Bunton St Houston, TX | 3.0 | 2.0 | 1389 | $1,950 | $1.40 | 45d | 1 | 0.46mi |
| 4605 Fisk St Houston, TX | 3.0 | 2.0 | 1628 | $3,000 | $1.84 | 45d | 1 | 0.48mi |
| 401 Walton St Houston, TX | 3.0 | 2.0 | 2112 | $2,500 | $1.18 | 17d | 1 | 0.72mi |
| 1524 Evelyn St Houston, TX | 3.0 | 2.5 | 1804 | $2,800 | $1.55 | 45d | 1 | 0.83mi |
| 1617 Enid St Houston, TX | 1.0–2.0 | 1.0–2.0 | 974 | $2,417 | $2.48 | 0d | 53 | 0.92mi |
| 2706 Cochran St Houston, TX | 3.0 | 3.5 | 1791 | $2,700 | $1.51 | 21d | 1 | 0.93mi |
| 2623 Keene St Houston, TX | 2.0 | 1.0–2.0 | 965 | $3,280 | $3.40 | 18d | 44 | 0.95mi |
| 4601 N Main St Houston, TX | 2.0 | 2.0 | 1058 | $2,095 | $1.98 | 26d | 1 | 0.97mi |
| 2403 Everett St Unit A Houston, TX | 3.0 | 3.5 | 2093 | $2,800 | $1.34 | 45d | 1 | 0.99mi |
| 207 Carl St Houston, TX | 2.0 | 2.0 | 1230 | $2,250 | $1.83 | 45d | 1 | 1.06mi |
| 1416 Fairbanks St Houston, TX | 4.0 | 3.5 | 1888 | $1,899 | $1.01 | 9d | 1 | 1.12mi |
| 705 Link Rd Houston, TX | 3.0 | 3.5 | 1850 | $2,600 | $1.41 | 9d | 1 | 1.16mi |
| 705 Link Rd Houston, TX | 3.0 | 3.5 | 1850 | $2,600 | $1.41 | 1d | 1 | 1.16mi |
| 770 Strawberry Pines Ct Houston, TX | 2.0–3.0 | 2.5 | 1422 | $2,735 | $1.92 | 3d | 12 | 1.20mi |
| 2013 Cochran St Houston, TX | 3.0 | 4.0 | 1888 | $2,600 | $1.38 | 0d | 1 | 1.27mi |
| 5124 Gold St Unit B Houston, TX | 3.0 | 2.5 | 1650 | $1,895 | $1.15 | 45d | 1 | 1.29mi |
| 1690 North Loop Houston, TX | 1.0–2.0 | 1.0–2.0 | 876 | $2,269 | $2.59 | 0d | 40 | 1.30mi |
| 2516 Ivy St Houston, TX | 3.0 | 1.0 | 1200 | $1,500 | $1.25 | 45d | 1 | 1.31mi |
| 2016 N Main St Houston, TX | 2.0 | 2.0 | 1169 | $2,200 | $1.88 | 45d | 1 | 1.32mi |
| 412 Paschall St Unit 1316398P Houston, TX | 3.0 | 2.0 | 1130 | $4,840 | $4.28 | 14d | 1 | 1.32mi |
| 1127 Walling St Unit R Houston, TX | 2.0 | 2.0 | 1400 | $2,295 | $1.64 | 45d | 1 | 1.37mi |
| 410 James St Houston, TX | 3.0 | 2.0 | 1602 | $6,750 | $4.21 | 45d | 1 | 1.40mi |
| 410 James St Unit 1031793P Houston, TX | 3.0 | 2.0 | 1593 | $5,668 | $3.56 | 1d | 1 | 1.40mi |
| 1111 Studewood St Houston, TX | 2.0 | 2.0 | 1240 | $2,075 | $1.67 | 17d | 1 | 1.45mi |
| 1141 Louise St Houston, TX | 4.0 | 4.0 | 2228 | $4,000 | $1.80 | 45d | 1 | 1.48mi |
| 207 Lindale St Unit 1316403P Houston, TX | 2.0 | 1.0 | 1119 | $3,187 | $2.85 | 1d | 1 | 1.49mi |
Listing history 14 events
-
2026-06-21days on market $290,000 Active 48 DOM
-
2026-06-18days on market $290,000 Active 45 DOM
-
2026-06-17days on market $290,000 Active 44 DOM
-
2026-06-16days on market $290,000 Active 43 DOM
-
2026-06-15days on market $290,000 Active 42 DOM
-
2026-06-13days on market $290,000 Active 40 DOM
-
2026-06-10days on market $290,000 Active 36 DOM
-
2026-06-08days on market $290,000 Active 35 DOM
-
2026-06-07days on market $290,000 Active 34 DOM
-
2026-06-04days on market $290,000 Active 31 DOM
-
2026-06-01days on market $290,000 Active 28 DOM
-
2026-05-31days on market $290,000 Active 27 DOM
-
2026-05-04$290,000 Active 487-char remark
-
1988-01-02soldstatus
ⓘ Source: listings_history table (triggers on properties + properties_extension) + one-shot
backfill from property_details.listing_events for pre-trigger history.
Tax reassessment forecast TX · Resets to sale price
- Current annual tax
- $5,721 · $477/mo
- Projected year-2 tax
- $5,721 · $477/mo
- Expected delta
- $0/yr ($0/mo · 0.0%)
ⓘ Screening estimate from a state-policy table — verify with the county assessor before closing.
Climate risk First Street
- Flood 6/10 Major FEMA zone X (unshaded) · 69% chance over 30 yrs
- Wildfire 1/10 Low
- Heat 9/10 Extreme 7 d/yr ≥109°F today · 24 d/yr by 30 yrs out
- Wind 9/10 Extreme 99% chance of damaging wind over 30 yrs
- Air quality 3/10 Moderate 2 unhealthy d/yr today · 3 by 30 yrs out
Nearby sold comps map
Loading sold comps map…
Walkable amenities ~0.75 mi
Loading nearby amenities…
Taxation est. · year 1
- Rental income
- $29,274
- − Mortgage interest
- −$16,245
- − Property taxes
- −$5,721
- − Insurance
- −$1,450
- − Repairs & maintenance
- −$2,342
- − Management
- −$2,342
- − Depreciation
- −$8,436
- Taxable loss
- −$7,262
- Est. tax savings @ 24.0%
- +$1,743
- After-tax cash flow
- $-551/yr
For passive investors: Depreciation is non-cash, so a rental often shows a tax loss while cash-flowing — sheltering income. Rental losses are passive: they offset passive income freely, and up to $25,000/yr can offset ordinary (W-2) income if you actively participate and your MAGI is under $100k (phasing out to $0 by $150k); unused losses carry forward. On sale, claimed depreciation is recaptured at up to 25%, and gains may owe capital-gains tax (a 1031 exchange can defer both). Figures are a year-1 estimate at your 24.0% rate — not tax advice; consult a CPA.
Schools (NCES district)
- District
- Houston ISD
- NCES district ID
- 4823640
- Math proficiency
- 27% ▼ -18.00%
- Reading proficiency
- 35% ▼ -6.00%
- Median HH income
- $46,054
- Composite
- 26.63/100
- National rank
- #7173
- State rank
- #593 of 826 in TX
Livability — Houston
- Score
- 74/100
- State rank
- #184
- US rank
- #4771
Category grades
Schools grade is shown separately in the Schools card above.
Census & demographics
- Census place
- Houston, TX
- County
- Harris County · 4,702,590 people
- City population
- 3,226,434
- Metro
- Houston-The Woodlands-Sugar Land, TX
- Population (ZIP)
- 35,769
- Household income
- $83,148
- Rent vs Own
- Severe rent burden
- 994.0
Population outlook (Harris County) Hauer SSP2
- Today (2025)
- 5,571,493 people
- By 2030
- 6,089,821 · +9.3%
- By 2040
- 7,142,806 · +28.2%
- By 2050
- 8,185,864 · +46.9%
- By 2075
- 10,574,329 · +89.8%
- By 2100
- 12,109,958 · +117.4%
Race, ethnicity, and origin ACS 2023
- Neighborhood character
- Diverse neighborhood (Simpson 0.60)
- Race & ethnicity
- Hispanic / Latino 53% White 33% Two or more races 22% Black 8% Asian 3%
- Hispanic origin (detail)
- Mexican 46%
- Common ancestry
- Italian 2% Lithuanian 2% Slovak 1%
- Foreign-born
- 20% · Canada
- Languages at home
- 55% English-only · Spanish 40% Other Indo-European 2% Other Asian/Pacific 1%
Political lean MEDSL · Harris
- 2024 margin
- Lean D (+5.5) · D 52.0% · R 46.4% · Other 1.6%
- 2008→2024 swing
- +3.9pp toward D · 2008: 1.6pp · 2024: 5.5pp
- All cycles
- 2024: D+5.5 2020: D+13.3 2016: D+12.4 2012: D+0.1 2008: D+1.6
Not yet ingested
- Civics
- —
Market trends
- HPI YoY
- ▼ -533.57%
- Current HPI
- 219.5037
- Rent YoY
- ▲ 0.84%
- Metro
- Houston-The Woodlands-Sugar Land, TX
- State GDP YoY
- ▲ 3.95%
- F500 in state
- 110
Industry mix (Fortune 500 HQ in TX)
| Industry | F500 HQs | Revenue |
|---|---|---|
| Energy | 16 | $1,198B |
|
||
| Technology | 5 | $198B |
|
||
| Engineering / Construction | 4 | $72B |
|
||
| Energy Services | 3 | $60B |
|
||
| Utilities | 3 | $41B |
|
||
| Healthcare | 2 | $330B |
|
||
Price history
2 events — show timeline
- 2026-05-04 Listed $290,000 HARMLS
- 1988-01-02 Sold (Public Records) — Public Records
Property tax history
+10.5%/yrLatest (2025): $5,721 · +11.7% YoY. Source: county tax records.
Cash-flow waterfall
monthlySold comps — $/sqft
last 12 mo · ≤1 miLoading sold comps…