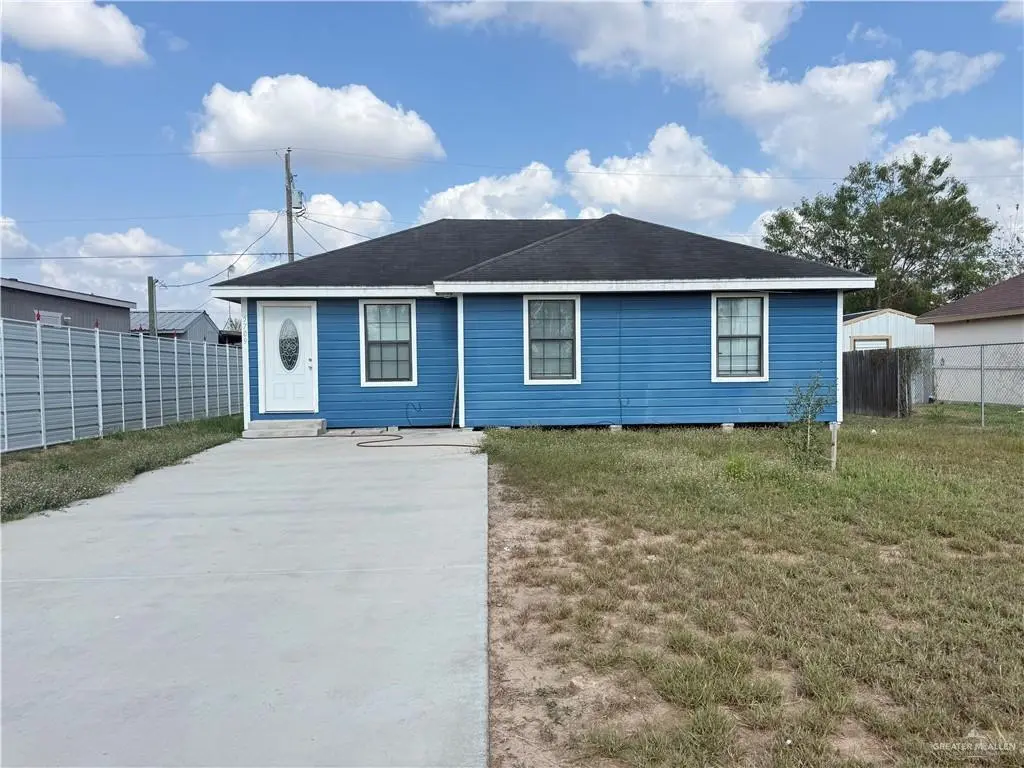
5709 Barry Dr · Edinburg, TX
Flood risk 1/10 · Minimal
- FEMA flood zone
- X
- Chance of flooding over 30 yrs
- 0.0%
- Est. flood insurance / yr
- $507 – $1,088
Fire risk 8/10 · Major
- Est. fire insurance / yr
- $1,222 – $2,270
Heat risk 9/10 · Severe
- Hot days now (above 112°F)
- 7 days/yr
- Hot days in 30 yrs
- 22 days/yr
Wind risk 9/10 · Severe
- Chance of severe wind over 30 yrs
- 99.0%
Air-quality risk 1/10 · Minimal
- Unhealthy air days now
- 0 days/yr
- Unhealthy air days in 30 yrs
- 0 days/yr
Risk factors via First Street. Map © Google.
Why this score? — see what drove the B grade
The composite is a weighted blend of 9 inputs, each scored 0–100. Each bar is that input's sub-score; the figure is the points it added to the 100-point composite (weight × sub-score).
- Cash flow +28.0/30.0
- ARV discount +15.0/15.0
- DSCR +9.9/10.0
- 1% rule +7.7/10.0
- Livability +3.2/5.0
- Condition / age +2.5/5.0
- Rent growth +2.2/5.0
- Schools +2.2/10.0
- Appreciation +0.0/10.0
$98,000
🖨 Deal sheet (PDF) 📄 Offer letter ✓ Due diligence
Listing remarks
Welcome to this cozy 3-bedroom, 1-bath home featuring decorative ceilings, abundant natural light, and a fully fenced spacious yard offering both privacy and room for outdoor enjoyment. With a little TLC and cosmetic updating, this property presents a great opportunity for investors, first-time buyers, or anyone looking to add their personal touch. Conveniently located just minutes from Expressway 281 and directly across from Carmen Avila Elementary, this home offers comfort, accessibility, and potential all in one. Schedule your showing today!
Key facts
- Decorative ceilings
- Accessibility
- Natural light
Tags
Property features AI
Finance
- Other: Lot approximately 6,000 sq ft (0.1377 acres)
- HOA & community: Mandatory POA; Homeowners association: Pueblo de Palmas Ph 12 Homeowners Association, Inc; HOA fee $50 annually; No POA transfer fee
Exterior
- Parking: No garage or carport
- Utilities: City sewer
- Home design: Single-story property; Siding construction
- Construction: Composition shingle roof; Pillar/post/pier foundation; Siding exterior
- Exterior features: Chain link and privacy fencing; Paved road access
Interior
- Kitchen: No conveying appliances
- Flooring: Laminate flooring
- Bathrooms: 1 full bathroom
- Interior features: Laminate countertops; Ceiling fan(s); Decorative / high ceilings; Vertical blinds
- Laundry & utility: Laundry area with washer/dryer connection; Water heater located in laundry room
Neighborhood map
What this means for you Summary
Snapshot
- This is a 3-bed/1.0-bath single-family listed at $98k.
Deal economics
- At list price, monthly cash flow is $305 ($4k/yr) — positive.
- The deal already cash-flows at list — no discount required.
- Meets the 1% rule at list price ($1k rent vs $98k).
- Recommended offer: $95k (3.0% below list) — sets the bar for market timing.
- Cap rate 10.0% vs local median 2.4% in Edinburg — top-decile yield for the area; either an underpriced asset or a hidden risk that comps aren't pricing in. Stress-test before assuming the spread holds.
Location & tenants
- Location reads 64/100 on livability (#784 in TX) — a middle-class / working-renter tenant base. Strengths: cost of living A+, housing A+; Watch: employment D, amenities F, commute F.
- Edinburg CISD (urban): math 20% / reading 34% proficiency, ranked #699 of 826 in TX (top 85%) — low school quality limits family demand, transient renter base, plan for 1-2y turnover; 62% free/reduced lunch — lower-income household profile, screen leases tightly.
- Zoned schools: Carmen V Avila El (math 17% / reading 21%, grade F, #3,739 of 4,322 statewide, top 87%, 728 students, 94% FRL); Betty Harwell Middle (math 11% / reading 26%, grade F, #1,478 of 1,662 statewide, top 90%, 1,453 students, 96% FRL); Economedes H S (math 19% / reading 24%, grade F, #1,377 of 1,632 statewide, top 85%, 2,762 students, 92% FRL) — zoned schools average 94% FRL vs 62% district-wide (33 pts higher); higher-poverty schools than district average — tighter screening recommended.
- Market conditions: Rents soft (-1.1%/yr); 1014 active listings in the ZIP; 7,378 units permitted in Hidalgo County in 2024 (641 in 5+ unit buildings).
Forward outlook
- Local home prices are declining (-3.0%/yr); year-one equity from $678 of loan paydown is wiped out by about $3k of value loss. Plan a longer hold.
- Hidalgo County population projected at +28% by 2050 — long-run rental-demand tailwind backs the buy-and-hold thesis.
Negotiation context
- It's been on market 31 days — a 3% lower offer ($95k) is reasonable based on typical stale-listing flexibility.
- 5 sale attempts since 7y ago with the ask held roughly flat each time — persistent listings suggest the price (not the market) is what's stuck; bring a comps-based counter.
Risks & watch-outs
- Climate carrying-cost: severe wind risk, 99% chance of damaging wind over 30y; severe wildfire risk; extreme-heat days projected 7→22/yr by 2055 (HVAC capex compounding) — expect insurance premiums to compound above CPI over the hold.
Questions for the listing agent
- It's been on market 31 days. Have you received any prior offers? Is the seller open to a 3% concession, seller financing, or rate buy-down credit?
- What does the HOA fee cover, when was the last increase, and are there any pending special assessments or reserve-fund shortfalls?
- Is there a deadline driving the sale (1031 exchange, divorce, estate, relocation)? That informs how much negotiation room exists.
- Schools are D-rated, which usually means shorter tenancies and higher turnover. Who's the typical renter profile here, and what's been the actual vacancy rate?
- What's the average days-on-market for RENTAL listings here right now (not sales)? A rising rental-DOM trend means longer vacancies and softer asking-rent achievability than the comps imply.
- What's the recent tenant-quality profile in this submarket — average credit score on applications, eviction rate, late-payment / NSF rate, and stable-employment percentage? A property-management company in the area should have these aggregated.
- How much new for-sale + rental construction is in the pipeline within 1–3 miles? Heavy new supply typically softens prices + rents 12–24 months out; constrained supply supports both.
Investment metrics
- 1% rule
- 1.27% ✓
- Cap rate
- 10.02%
- Cash-on-cash
- 13.33%
- DSCR
- 1.59
- GRM
- 6.5
CMA / ARV
- ARV (on-the-fly)
- $141,960
- Comps found
- 3
Show comp detail 3 sales within ~0.75 mi
| Address | Dist | Beds/Ba | Sqft | Sold | Price | $/sf | Match |
|---|---|---|---|---|---|---|---|
| 5046 Frisco Rd | 0.31mi | 2/2.0 (-1) | 900 (-1%) | 3mo | $140,000 | $156 | 73 |
| 5710 Visha St | 0.34mi | 2/2.0 (-1) | 864 (-5%) | 2mo | $167,500 | $194 | 65 |
| 5514 Mae St | 0.72mi | 2/1.0 (-1) | 784 (-14%) | 15mo | $120,000 | $153 | 26 |
Match score weights: distance 35% · size 25% · config 20% · recency 20%. Top-matched comps best support the ARV.
Projected returns pro-forma
-3.0% appreciation · 0.0% rent growth · sell at horizon
- IRR
- -0.1%
- Equity multiple
- 1.00×
- Total profit
- $-110
- Equity at exit
- $14,612
- IRR
- 6.1%
- Equity multiple
- 1.40×
- Total profit
- $10,845
- Equity at exit
- $8,473
Cash invested: $27,440 (down + closing). Projections, not guarantees.
Landlord ↔ Tenant lean methodology
- Overall (STATE)
- 87 Strongly Landlord-Friendly
- State Texas
- 87 Strongly Landlord-Friendly · R+5
- County
- — inherits STATE
- City
- — inherits STATE
ZIP-level market 78542
- Home prices YoY
- -13.4%
- Rents YoY
- -1.1%
- Active inventory
- 1014
- Price-to-rent
- 6.5×
Monthly cashflow live
- Estimated rent
- $1,248 medium interval (Pro) →
- Mortgage (P&I)
- −$514
- Tax est. 1.5%
- −$122 /mo · $1,470/yr
- Insurance
- −$41
- HOA
- −$4
- Lot rent
- −$0
- Vacancy / Maint / Mgmt
- −$262
- Net cashflow
- $305
Break-even live
Sensitivity live
| Price | -10% $372 | -5% $339 | +0% $305 | +5% $271 | +10% $237 |
|---|---|---|---|---|---|
| Rent | -10% $206 | -5% $255 | +0% $305 | +5% $354 | +10% $403 |
| Rate | -1.0pp $354 | -0.5pp $330 | base $305 | +0.5pp $279 | +1.0pp $253 |
UW: 25.0% down · 7.5% · 30yr · 1.5% tax · 5.0% vac · 8.0% maint · 8.0% mgmt
Financing live
Cash to close
- Down payment
- $24,500
- Closing costs
- $2,940
- Reserves months
- —
- Total cash needed
- —
Loan-product check · same deal, 3 products live
Conventional
25% down · 7.5% · 30yr
- Down + closing
- —
- Monthly P&I
- —
- Monthly cashflow
- —
- DSCR
- —
- Eligible?
- —
Personal DTI + credit; lowest rate.
DSCR
20% down · 8.5% · 30yr
- Down + closing
- —
- Monthly P&I
- —
- Monthly cashflow
- —
- DSCR
- —
- Eligible?
- —
No personal income docs; deal must DSCR.
Hard money
10% down · 12.0% · 12mo
- Down + closing
- —
- Monthly P&I
- —
- Monthly cashflow
- —
- DSCR
- —
- Eligible?
- —
Short-term bridge; refi at stabilization.
HOA detail
- Monthly dues
- $4 · $48/yr
Listing history 26 events
-
2026-06-23days on market $98,000 Active 31 DOM
-
2026-06-21days on market $98,000 Active 30 DOM
-
2026-06-18days on market $98,000 Active 27 DOM
-
2026-06-17days on market $98,000 Active 26 DOM
-
2026-06-16days on market $98,000 Active 25 DOM
-
2026-06-15days on market $98,000 Active 24 DOM
-
2026-06-14days on market $98,000 Active 22 DOM
-
2026-06-13days on market $98,000 Active 21 DOM
-
2026-06-10days on market $98,000 Active 19 DOM
-
2026-06-09days on market $98,000 Active 18 DOM
-
2026-06-08days on market $98,000 Active 17 DOM
-
2026-06-07days on market $98,000 Active 16 DOM
-
2026-06-03days on market $98,000 Active 12 DOM
-
2026-06-02days on market $98,000 Active 11 DOM
-
2026-06-01days on market $98,000 Active 10 DOM
-
2026-05-31days on market $98,000 Active 9 DOM
-
2026-05-31days on market $98,000 Active 8 DOM
-
2026-04-09$108,000 Active 422-char remark
-
2026-03-14price $108,000
-
2026-01-04$115,000 Active
-
2025-11-24$125,000 Active
-
2019-08-14price $38,750
-
2019-08-14soldstatus Sold
-
2019-07-29status Pending
-
2019-07-29price $55,000
-
2019-06-14$55,000 Active
ⓘ Source: listings_history table (triggers on properties + properties_extension) + one-shot
backfill from property_details.listing_events for pre-trigger history.
Climate risk First Street
- Flood 1/10 Low FEMA zone X · 0% chance over 30 yrs
- Wildfire 8/10 Severe
- Heat 9/10 Extreme 7 d/yr ≥112°F today · 22 d/yr by 30 yrs out
- Wind 9/10 Extreme 99% chance of damaging wind over 30 yrs
- Air quality 1/10 Low 0 unhealthy d/yr today · 0 by 30 yrs out
Nearby sold comps map
Loading sold comps map…
Walkable amenities ~0.75 mi
Loading nearby amenities…
Taxation est. · year 1
- Rental income
- $14,977
- − Mortgage interest
- −$5,490
- − Property taxes
- −$1,470
- − Insurance
- −$490
- − Repairs & maintenance
- −$1,198
- − Management
- −$1,198
- − HOA
- −$48
- − Depreciation
- −$2,851
- Taxable income
- $2,232
- Est. tax owed @ 24.0%
- −$536
- After-tax cash flow
- $3,121/yr
For passive investors: Depreciation is non-cash, so a rental often shows a tax loss while cash-flowing — sheltering income. Rental losses are passive: they offset passive income freely, and up to $25,000/yr can offset ordinary (W-2) income if you actively participate and your MAGI is under $100k (phasing out to $0 by $150k); unused losses carry forward. On sale, claimed depreciation is recaptured at up to 25%, and gains may owe capital-gains tax (a 1031 exchange can defer both). Figures are a year-1 estimate at your 24.0% rate — not tax advice; consult a CPA.
Schools (NCES district)
- District
- Edinburg CISD
- NCES district ID
- 4818180
- Math proficiency
- 20% ▼ -34.00%
- Reading proficiency
- 34% ▼ -11.00%
- Median HH income
- $36,985
- Composite
- 22.42/100
- National rank
- #8114
- State rank
- #699 of 826 in TX
Livability — Edinburg
- Score
- 64/100
- State rank
- #784
- US rank
- #14319
Category grades
Schools grade is shown separately in the Schools card above.
Census & demographics
- County
- Hidalgo County · 623,128 people
- City population
- 178,279
- Metro
- McAllen-Edinburg-Mission, TX
- Population (ZIP)
- 89,401
- Household income
- $55,243
- Rent vs Own
- Severe rent burden
- 1240.0
Population outlook (Hidalgo County) Hauer SSP2
- Today (2025)
- 955,232 people
- By 2030
- 1,009,774 · +5.7%
- By 2040
- 1,120,332 · +17.3%
- By 2050
- 1,225,036 · +28.2%
- By 2075
- 1,439,189 · +50.7%
- By 2100
- 1,533,429 · +60.5%
Race, ethnicity, and origin ACS 2023
- Neighborhood character
- Predominantly Hispanic (95%)
- Race & ethnicity
- Hispanic / Latino 95% Two or more races 59% White 4%
- Hispanic origin (detail)
- Mexican 91%
- Foreign-born
- 25% · Canada
- Languages at home
- 15% English-only · Spanish 84%
Political lean MEDSL · Hidalgo
- 2024 margin
- Toss-up / Even · D 48.1% · R 51.0%
- 2008→2024 swing
- -41.6pp toward R · 2008: 38.7pp · 2024: -2.9pp
- All cycles
- 2024: R+2.9 2020: D+17.1 2016: D+40.5 2012: D+41.8 2008: D+38.7
Not yet ingested
- Civics
- —
Market trends
- HPI YoY
- ▼ -34.17%
- Current HPI
- 220.921
- Rent YoY
- ▼ -1.07%
- Metro
- McAllen-Edinburg-Mission, TX
- State GDP YoY
- ▲ 3.95%
- F500 in state
- 110
Industry mix (Fortune 500 HQ in TX)
| Industry | F500 HQs | Revenue |
|---|---|---|
| Energy | 16 | $1,198B |
|
||
| Technology | 5 | $198B |
|
||
| Engineering / Construction | 4 | $72B |
|
||
| Energy Services | 3 | $60B |
|
||
| Utilities | 3 | $41B |
|
||
| Healthcare | 2 | $330B |
|
||
Price history
+78.2% since first listed10 events — show timeline
- 2026-05-21 Listed $98,000 MCALLENMLS
- 2026-04-09 Listed $108,000 MCALLENMLS
- 2026-03-14 Price Changed $108,000 MCALLENMLS
- 2026-01-04 Listed $115,000 MCALLENMLS
- 2025-11-24 Listed $125,000 MCALLENMLS
- 2019-08-14 Price Changed $38,750 MCALLENMLS
- 2019-08-14 Sold (MLS) — MCALLENMLS
- 2019-07-29 Pending — MCALLENMLS
- 2019-07-29 Price Changed $55,000 MCALLENMLS
- 2019-06-14 Listed $55,000 MCALLENMLS
Cash-flow waterfall
monthlySold comps — $/sqft
last 12 mo · ≤1 miLoading sold comps…