 Multi-family
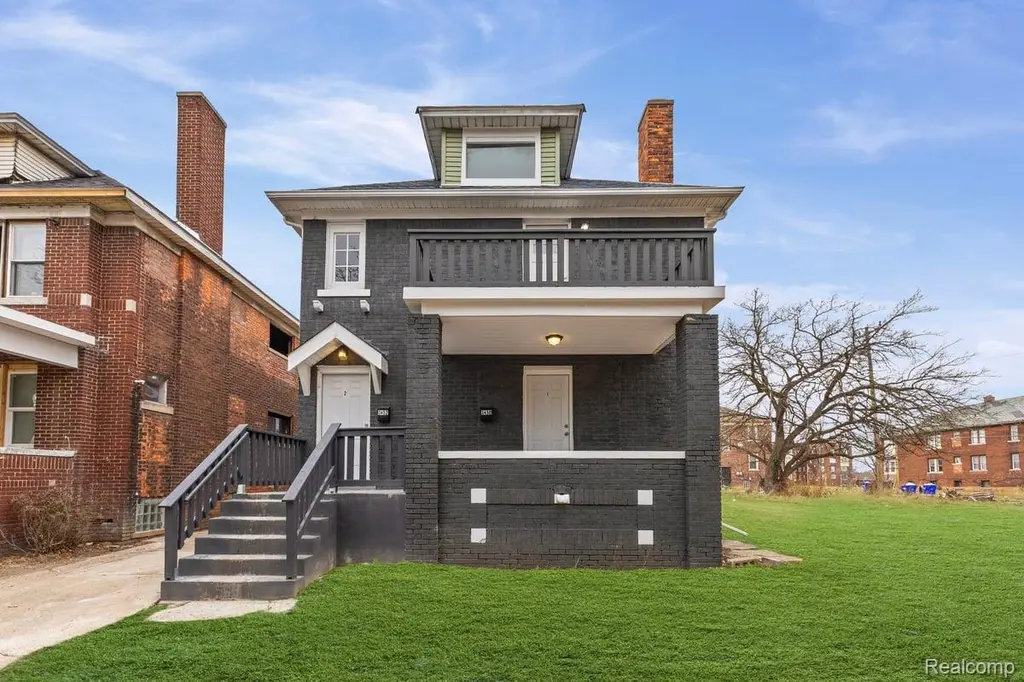
3450 Edison St · Detroit, MI
Flood risk 1/10 · Minimal
- FEMA flood zone
- X (unshaded)
- Chance of flooding over 30 yrs
- 0.0%
- Est. flood insurance / yr
- $473 – $860
Fire risk 1/10 · Minimal
- Est. fire insurance / yr
- $784 – $1,456
Heat risk 3/10 · Minor
- Hot days now (above 97°F)
- 7 days/yr
- Hot days in 30 yrs
- 15 days/yr
Wind risk 2/10 · Minimal
- Chance of severe wind over 30 yrs
- —
Air-quality risk 4/10 · Minor
- Unhealthy air days now
- 4 days/yr
- Unhealthy air days in 30 yrs
- 6 days/yr
Risk factors via First Street. Map © Google.
Why this score? — see what drove the C+ grade
The composite is a weighted blend of 9 inputs, each scored 0–100. Each bar is that input's sub-score; the figure is the points it added to the 100-point composite (weight × sub-score).
- Cash flow +27.6/30.0
- DSCR +9.7/10.0
- ARV discount +7.5/15.0
- 1% rule +6.5/10.0
- Rent growth +3.8/5.0
- Livability +3.7/5.0
- Condition / age +2.5/5.0
- Schools +1.3/10.0
- Appreciation +0.0/10.0
$228,000
🖨 Deal sheet (PDF) 📄 Offer letter ✓ Due diligence
Multi-family units
County records classify this as Multi-Family (2-4 Unit). Listing-text estimate: 1 unit. estimate disagrees with records
Listing remarks MLS
Welcome to 3450 Edison, located in the desirable Nardin Park neighborhood on Detroit's West Side, just outside the historic Boston-Edison district. This brick, fully renovated multi-family property offers the perfect blend of timeless charm and modern living. Each unit features three spacious bedrooms and one full bathroom, completed with high-quality finishes throughout. The open living rooms are filled with natural light from new windows and feature a cozy fireplace, creating a warm and inviting atmosphere. Fully renovated kitchens with new cabinetry. Original hardwood floors have been beautifully refinished, enhancing the home's classic character. The upper unit mirrors the lower level and includes a private balcony off the living room. Beyond the cosmetic upgrades, this property provides peace of mind with extensive mechanical improvements completed in 2025, including new electrical, plumbing, HVAC, roof, windows, and sewer lines. Each unit also includes its own private basement, offering ample storage space and added functionality. The solid brick exterior adds durability and curb appeal. A truly turnkey opportunity ideal for investors or owner-occupants seeking quality, space, and long-term value.
Key facts
- Private basement
- Solid brick exterior
- 3,485 sq ft lot
Tags
Property features AI
Finance
- Financial info: Annual tax listed
Exterior
- Utilities: Water available; Public sewer
- Home design: Residential income, multi-family property; Two units (multi-family)
- Construction: Brick construction with brick/mortar foundation; 2,304 above-grade finished area
- Exterior features: Paved road access; Pets allowed
Interior
- Bedrooms: Two 3-bedroom units
- Bathrooms: Two full bathrooms (one per unit)
- Heating & cooling: Forced air heating with natural gas; No central cooling
- Interior features: Full unfinished basement
Neighborhood map
What this means for you Summary
Snapshot
- This is a 5-bed/1.0-bath multifamily listed at $228k.
Deal economics
- At list price, monthly cash flow is $680 ($8k/yr) — positive.
- The deal already cash-flows at list — no discount required.
- Meets the 1% rule at list price ($3k rent vs $228k).
- Recommended offer: $225k (1.5% below list) — sets the bar for market timing.
Location & tenants
- Location reads 73/100 on livability (#218 in MI) — a middle-class / working-renter tenant base. Strengths: amenities A+, commute A+, cost of living A+; Watch: crime F, employment F.
- Detroit Public Schools Community District (urban): math 10% / reading 24% proficiency, ranked #499 of 540 in MI (top 92%) — low school quality limits family demand, transient renter base, plan for 1-2y turnover; 90% free/reduced lunch — lower-income household profile, screen leases tightly.
- Zoned schools: Durfee Elementarymiddle School (593 students, 91% FRL); Central High School (math 24% / reading 24%, grade F, #481 of 713 statewide, top 81%, 353 students, 89% FRL) — zoned schools at 90% FRL track the district average.
- Market conditions: Rents rising fast (+5.2%/yr); 273 active listings in the ZIP; 12 comparable units currently listed for rent nearby; rentals leasing fast (median 12d on market — plan ~1-2 weeks tenant-placement turnaround); 2,639 units permitted in Wayne County in 2024 (1,216 in 5+ unit buildings).
- At $2,630/mo this rent would consume 70% of the median local household income ($45k/yr) (locally 646% of renters already pay >50% of income on rent) — very limited rent-growth headroom before tenants either downsize or default.
Forward outlook
- Local home prices are declining (-3.0%/yr); year-one equity from $2k of loan paydown is wiped out by about $7k of value loss. Plan a longer hold.
- Wayne County population projected at -17% by 2050 — secular population decline; favor cash flow + early exit over multi-decade hold.
- At projected returns (-3.0% appreciation + 5.2% rent growth), your $64k cash investment doubles in ~8 years — after that, you're playing with house money.
Negotiation context
- It's been on market 29 days — a 2% lower offer ($225k) is reasonable based on typical stale-listing flexibility.
- 11 sale attempts since 21y ago with the ask held roughly flat each time — persistent listings suggest the price (not the market) is what's stuck; bring a comps-based counter.
- Current owner paid $65k; list at $228k implies a 251% gain — meaningful room to come down on a strong offer.
Risks & watch-outs
- Watch-outs: built in 1922 — expect roof / HVAC / electrical / plumbing capex.
Questions for the listing agent
- Built in 1922 — when were the roof, HVAC, electrical panel, plumbing, and water heater last replaced?
- Is there a deadline driving the sale (1031 exchange, divorce, estate, relocation)? That informs how much negotiation room exists.
- Schools are F-rated, which usually means shorter tenancies and higher turnover. Who's the typical renter profile here, and what's been the actual vacancy rate?
- Crime grade is F in this area — have there been break-ins, vandalism, or insurance claims at this property in the last 3 years? What carrier currently insures it and at what premium?
- What's the average days-on-market for RENTAL listings here right now (not sales)? A rising rental-DOM trend means longer vacancies and softer asking-rent achievability than the comps imply.
- What's the recent tenant-quality profile in this submarket — average credit score on applications, eviction rate, late-payment / NSF rate, and stable-employment percentage? A property-management company in the area should have these aggregated.
- How much new apartment / multifamily construction is in the pipeline within 1–3 miles? Heavy new supply (>2% of stock underway) typically softens rents 12–24 months out; light construction supports rent growth.
Investment metrics
- 1% rule
- 1.15% ✓
- Cap rate
- 9.87%
- Cash-on-cash
- 12.79%
- DSCR
- 1.57
- GRM
- 7.2
CMA / ARV
- ARV (on-the-fly)
- $110,592
- Comps found
- 12
Show comp detail 12 sales within ~0.75 mi
| Address | Dist | Beds/Ba | Sqft | Sold | Price | $/sf | Match |
|---|---|---|---|---|---|---|---|
| 4044 Clairmount St | 0.31mi | 4/3.0 (-1) | 2,208 (-4%) | 3mo | $37,000 | $17 | 63 |
| 3785 Blaine St | 0.51mi | 6/2.5 (+1) | 2,330 (+1%) | 1mo | $40,000 | $17 | 62 |
| 3791 Blaine St | 0.51mi | 4/2.0 (-1) | 2,306 (+0%) | 8mo | $55,000 | $24 | 60 |
| 9952 Cascade St | 0.62mi | 4/2.0 (-1) | 2,300 (-0%) | 2mo | $110,000 | $48 | 60 |
| 10053 Quincy St | 0.44mi | 6/2.0 (+1) | 2,200 (-4%) | 5mo | $80,000 | $36 | 59 |
| 3744 Blaine St | 0.48mi | 4/2.5 (-1) | 2,372 (+3%) | 6mo | $50,000 | $21 | 57 |
| 2959 Tuxedo St | 0.65mi | 6/2.0 (+1) | 2,264 (-2%) | 3mo | $181,000 | $80 | 55 |
| 3759 W Euclid St | 0.67mi | 6/2.0 (+1) | 2,346 (+2%) | 2mo | $207,500 | $88 | 55 |
| 3757 Blaine St | 0.51mi | 6/2.5 (+1) | 2,362 (+2%) | 8mo | $205,000 | $87 | 55 |
| 9662 Broadstreet Ave | 0.49mi | 6/2.0 (+1) | 2,502 (+9%) | 2mo | $146,000 | $58 | 52 |
| 2931 Tuxedo St | 0.66mi | 6/2.0 (+1) | 2,510 (+9%) | 3mo | $50,000 | $20 | 42 |
| 3025 Tuxedo St | 0.63mi | 6/2.5 (+1) | 2,548 (+11%) | 5mo | $150,000 | $59 | 38 |
Match score weights: distance 35% · size 25% · config 20% · recency 20%. Top-matched comps best support the ARV.
Projected returns pro-forma
-3.0% appreciation · 5.2% rent growth · sell at horizon
- IRR
- 4.8%
- Equity multiple
- 1.19×
- Total profit
- $12,255
- Equity at exit
- $33,996
- IRR
- 16.1%
- Equity multiple
- 2.44×
- Total profit
- $91,709
- Equity at exit
- $19,713
Cash invested: $63,840 (down + closing). Projections, not guarantees.
Landlord ↔ Tenant lean methodology
- Overall (STATE)
- 62 Landlord-Friendly
- State Michigan
- 62 Landlord-Friendly · EVEN
- County
- — inherits STATE
- City
- — inherits STATE
ZIP-level market 48206
- Rents YoY
- 5.2%
- Active inventory
- 273
- Price-to-rent
- 14.4×
Monthly cashflow live
- Estimated rent
- $2,630 high interval (Pro) →
- Mortgage (P&I)
- −$1,196
- Tax from tax record
- −$107 /mo · $1,282/yr
- Insurance
- −$95
- HOA
- −$0
- Vacancy / Maint / Mgmt
- −$552
- Net cashflow
- $680
Break-even live
Sensitivity live
| Price | -10% $809 | -5% $745 | +0% $680 | +5% $616 | +10% $551 |
|---|---|---|---|---|---|
| Rent | -10% $472 | -5% $576 | +0% $680 | +5% $784 | +10% $888 |
| Rate | -1.0pp $795 | -0.5pp $738 | base $680 | +0.5pp $621 | +1.0pp $561 |
2-unit breakdown (identical units grouped — click to expand)
| Units | Beds | Baths | Est. rent |
|---|---|---|---|
| 2× units | 3 | 1 | $2,630 |
| #1 | 3 | 1 | $1,315 |
| #2 | 3 | 1 | $1,315 |
| Total (2 units) | $2,630 | ||
UW: 25.0% down · 7.5% · 30yr · 1.5% tax · 5.0% vac · 8.0% maint · 8.0% mgmt
Financing live
Cash to close
- Down payment
- $57,000
- Closing costs
- $6,840
- Reserves months
- —
- Total cash needed
- —
Loan-product check · same deal, 3 products live
Conventional
25% down · 7.5% · 30yr
- Down + closing
- —
- Monthly P&I
- —
- Monthly cashflow
- —
- DSCR
- —
- Eligible?
- —
Personal DTI + credit; lowest rate.
DSCR
20% down · 8.5% · 30yr
- Down + closing
- —
- Monthly P&I
- —
- Monthly cashflow
- —
- DSCR
- —
- Eligible?
- —
No personal income docs; deal must DSCR.
Hard money
10% down · 12.0% · 12mo
- Down + closing
- —
- Monthly P&I
- —
- Monthly cashflow
- —
- DSCR
- —
- Eligible?
- —
Short-term bridge; refi at stabilization.
Rent comps 12 comps
| Address | Beds | Baths | Sqft | Rent | $/sqft | DOM | Units | Dist |
|---|---|---|---|---|---|---|---|---|
| 3241 Lawrence St Detroit, MI | 4.0 | 2.0 | 2636 | $1,800 | $0.68 | 18d | 1 | 0.41mi |
| 3031 Lawrence St Detroit, MI | 4.0 | 1.0 | 1700 | $1,600 | $0.94 | 18d | 1 | 0.43mi |
| 2655 Collingwood St Detroit, MI | 4.0 | 1.5 | 1881 | $2,700 | $1.44 | 0d | 1 | 0.51mi |
| 2509 Gladstone St Unit NA Detroit, MI | 6.0 | 3.0 | 3008 | $2,000 | $0.66 | 12d | 1 | 0.64mi |
| 3799 W Philadelphia St Detroit, MI | 5.0 | 2.0 | 2200 | $1,650 | $0.75 | 18d | 1 | 0.65mi |
| 8951 La Salle Blvd Unit NA Detroit, MI | 4.0 | 2.5 | 2440 | $2,500 | $1.02 | 0d | 1 | 0.65mi |
| 8951 La Salle Blvd Detroit, MI | 5.0 | 2.5 | 2440 | $2,500 | $1.02 | 16d | 1 | 0.65mi |
| 8951 La Salle Blvd Detroit, MI | 4.0 | 2.5 | 2440 | $2,500 | $1.02 | 3d | 1 | 0.65mi |
| 2080 Gladstone St #1 Detroit, MI | 4.0 | 2.0 | 2426 | $3,000 | $1.24 | 0d | 1 | 0.86mi |
| 2028 Gladstone St Unit 1 Detroit, MI | 5.0 | 2.0 | 2500 | $2,850 | $1.14 | 5d | 1 | 0.91mi |
| 1699 Glynn Ct Detroit, MI | 5.0 | 3.5 | 2542 | $2,500 | $0.98 | 23d | 1 | 1.04mi |
| 4341 Glendale St Detroit, MI | 4.0 | 2.5 | 1832 | $1,680 | $0.92 | 6d | 1 | 1.19mi |
Listing history 40 events
-
2026-06-21days on market $228,000 Active 29 DOM
-
2026-06-18days on market $228,000 Active 26 DOM
-
2026-06-17days on market $228,000 Active 25 DOM
-
2026-06-15days on market $228,000 Active 23 DOM
-
2026-06-13days on market $228,000 Active 21 DOM
-
2026-06-13days on market $228,000 Active 20 DOM
-
2026-06-09days on market $228,000 Active 17 DOM
-
2026-06-08pricedays on market $228,000 Active 16 DOM
-
2026-06-07days on market $237,000 Active 15 DOM
-
2026-06-04days on market $237,000 Active 12 DOM
-
2026-06-03days on market $237,000 Active 11 DOM
-
2026-06-02days on market $237,000 Active 10 DOM
-
2026-06-01days on market $237,000 Active 9 DOM
-
2026-05-31days on market $237,000 Active 8 DOM
-
2026-05-23$237,000 Active 1222-char remark
Show marketing remark (1222 chars)
Welcome to 3450 Edison, located in the desirable Nardin Park neighborhood on Detroit's West Side, just outside the historic Boston-Edison district. This brick, fully renovated multi-family property offers the perfect blend of timeless charm and modern living. Each unit features three spacious bedrooms and one full bathroom, completed with high-quality finishes throughout. The open living rooms are filled with natural light from new windows and feature a cozy fireplace, creating a warm and inviting atmosphere. Fully renovated kitchens with new cabinetry. Original hardwood floors have been beautifully refinished, enhancing the home's classic character. The upper unit mirrors the lower level and includes a private balcony off the living room. Beyond the cosmetic upgrades, this property provides peace of mind with extensive mechanical improvements completed in 2025, including new electrical, plumbing, HVAC, roof, windows, and sewer lines. Each unit also includes its own private basement, offering ample storage space and added functionality. The solid brick exterior adds durability and curb appeal. A truly turnkey opportunity ideal for investors or owner-occupants seeking quality, space, and long-term value.
-
2026-05-23$237,000 Active
Show marketing remark (1222 chars)
Welcome to 3450 Edison, located in the desirable Nardin Park neighborhood on Detroit's West Side, just outside the historic Boston-Edison district. This brick, fully renovated multi-family property offers the perfect blend of timeless charm and modern living. Each unit features three spacious bedrooms and one full bathroom, completed with high-quality finishes throughout. The open living rooms are filled with natural light from new windows and feature a cozy fireplace, creating a warm and inviting atmosphere. Fully renovated kitchens with new cabinetry. Original hardwood floors have been beautifully refinished, enhancing the home's classic character. The upper unit mirrors the lower level and includes a private balcony off the living room. Beyond the cosmetic upgrades, this property provides peace of mind with extensive mechanical improvements completed in 2025, including new electrical, plumbing, HVAC, roof, windows, and sewer lines. Each unit also includes its own private basement, offering ample storage space and added functionality. The solid brick exterior adds durability and curb appeal. A truly turnkey opportunity ideal for investors or owner-occupants seeking quality, space, and long-term value.
-
2026-05-22historical
-
2026-05-21status Active
-
2026-05-21status Active
-
2026-04-10status Pending
-
2026-04-10status Pending
-
2026-04-04price $237,000
-
2026-04-03price $237,000
-
2026-03-17price $242,000
-
2026-03-16price $242,000
-
2026-02-14price $246,000
-
2026-02-13price $246,000
-
2026-01-23$250,000 Active
-
2026-01-23$250,000 Active
-
2026-01-22historical
-
2026-01-22$250,000 Active
-
2026-01-22historical
-
2026-01-22$250,000 Active
-
2026-01-22historical
-
2026-01-22historical
-
2025-12-26$260,000 Active
-
2025-12-26$260,000 Active
-
2006-11-06soldstatus $65,000
-
2005-09-30historical
-
2005-03-23$75,000
ⓘ Source: listings_history table (triggers on properties + properties_extension) + one-shot
backfill from property_details.listing_events for pre-trigger history.
Tax reassessment forecast MI · Partial reset (capped growth)
- Current annual tax
- $1,282 · $107/mo
- Projected year-2 tax
- $2,397 · $200/mo
- Expected delta
- +$1,114/yr (+$93/mo · 86.9%)
ⓘ Screening estimate from a state-policy table — verify with the county assessor before closing.
Climate risk First Street
- Flood 1/10 Low FEMA zone X (unshaded) · 0% chance over 30 yrs
- Wildfire 1/10 Low
- Heat 3/10 Moderate 7 d/yr ≥97°F today · 15 d/yr by 30 yrs out
- Wind 2/10 Low
- Air quality 4/10 Moderate 4 unhealthy d/yr today · 6 by 30 yrs out
Nearby sold comps map
Loading sold comps map…
Walkable amenities ~0.75 mi
Loading nearby amenities…
Taxation est. · year 1
- Rental income
- $31,560
- − Mortgage interest
- −$12,772
- − Property taxes
- −$1,282
- − Insurance
- −$1,140
- − Repairs & maintenance
- −$2,525
- − Management
- −$2,525
- − Depreciation
- −$6,633
- Taxable income
- $4,684
- Est. tax owed @ 24.0%
- −$1,124
- After-tax cash flow
- $7,038/yr
For passive investors: Depreciation is non-cash, so a rental often shows a tax loss while cash-flowing — sheltering income. Rental losses are passive: they offset passive income freely, and up to $25,000/yr can offset ordinary (W-2) income if you actively participate and your MAGI is under $100k (phasing out to $0 by $150k); unused losses carry forward. On sale, claimed depreciation is recaptured at up to 25%, and gains may owe capital-gains tax (a 1031 exchange can defer both). Figures are a year-1 estimate at your 24.0% rate — not tax advice; consult a CPA.
Schools (NCES district)
- District
- Detroit Public Schools Community District
- NCES district ID
- 2601103
- Math proficiency
- 10% ▼ -2.00%
- Reading proficiency
- 24% ▲ 6.00%
- Median HH income
- $25,815
- Composite
- 13.06/100
- National rank
- #9564
- State rank
- #499 of 540 in MI
Livability — Detroit
- Score
- 73/100
- State rank
- #218
- US rank
- #5427
Category grades
Schools grade is shown separately in the Schools card above.
Census & demographics
- Census place
- Detroit, MI
- County
- Wayne County · 1,562,939 people
- City population
- 572,865
- Metro
- Detroit-Warren-Dearborn, MI
- Population (ZIP)
- 15,227
- Household income
- $45,046
- Rent vs Own
- Severe rent burden
- 646.0
Population outlook (Wayne County) Hauer SSP2
- Today (2025)
- 1,675,273 people
- By 2030
- 1,620,300 · -3.3%
- By 2040
- 1,502,341 · -10.3%
- By 2050
- 1,384,039 · -17.4%
- By 2075
- 1,124,592 · -32.9%
- By 2100
- 881,193 · -47.4%
Race, ethnicity, and origin ACS 2023
- Neighborhood character
- Predominantly Black (81%)
- Race & ethnicity
- Black 81% White 12% Two or more races 5% Hispanic / Latino 3%
- Common ancestry
- Iranian 3% Romanian 1% Slovak 1%
- Foreign-born
- 4% · Canada
- Languages at home
- 94% English-only · Spanish 4% Other Indo-European 1%
Political lean MEDSL · Wayne
- 2024 margin
- Strong D (+29.0) · D 62.7% · R 33.7% · Other 3.6%
- 2008→2024 swing
- -20.5pp toward R · 2008: 49.5pp · 2024: 29.0pp
- All cycles
- 2024: D+29.0 2020: D+38.1 2016: D+37.3 2012: D+46.9 2008: D+49.5
Not yet ingested
- Civics
- —
Market trends
- HPI YoY
- ▼ -139.60%
- Current HPI
- 130.9545
- Rent YoY
- ▲ 5.20%
- Metro
- Detroit-Warren-Dearborn, MI
- State GDP YoY
- ▲ 1.37%
- F500 in state
- 28
Industry mix (Fortune 500 HQ in MI)
| Industry | F500 HQs | Revenue |
|---|---|---|
| Automotive Parts | 3 | $48B |
|
||
| Automotive | 2 | $372B |
|
||
| Chemicals | 1 | $45B |
|
||
| Automotive Retail | 1 | $29B |
|
||
| Healthcare / Medical Devices | 1 | $23B |
|
||
| Automotive Technology | 1 | $20B |
|
||
Price history
+216.0% since first listed26 events — show timeline
- 2026-05-23 Listed $237,000 REALCOMP
- 2026-05-23 Listed $237,000 MiRealSource-MiMLS
- 2026-05-22 Listing Removed — MiRealSource-MiMLS
- 2026-05-21 Relisted — MiRealSource-MiMLS
- 2026-05-21 Relisted — REALCOMP
- 2026-04-10 Pending — MiRealSource-MiMLS
- 2026-04-10 Pending — REALCOMP
- 2026-04-04 Price Changed $237,000 MiRealSource-MiMLS
- 2026-04-03 Price Changed $237,000 REALCOMP
- 2026-03-17 Price Changed $242,000 MiRealSource-MiMLS
- 2026-03-16 Price Changed $242,000 REALCOMP
- 2026-02-14 Price Changed $246,000 MiRealSource-MiMLS
- 2026-02-13 Price Changed $246,000 REALCOMP
- 2026-01-23 Listed $250,000 REALCOMP
- 2026-01-23 Listed $250,000 MiRealSource-MiMLS
- 2026-01-22 Listing Removed — REALCOMP
- 2026-01-22 Listing Removed — MiRealSource-MiMLS
- 2026-01-22 Listed $250,000 MiRealSource-MiMLS
- 2026-01-22 Listing Removed — MiRealSource-MiMLS
- 2026-01-22 Listed $250,000 REALCOMP
- 2026-01-22 Listing Removed — REALCOMP
- 2025-12-26 Listed $260,000 REALCOMP
- 2025-12-26 Listed $260,000 MiRealSource-MiMLS
- 2006-11-06 Sold (Public Records) $65,000 Public Records
- 2005-09-30 Listing Removed — MiRealSource-MiMLS
- 2005-03-23 Listed $75,000 MiRealSource-MiMLS
Property tax history
+10.9%/yrLatest (2025): $1,282 · +0.0% YoY. Source: county tax records.
Cash-flow waterfall
monthlySold comps — $/sqft
last 12 mo · ≤1 miLoading sold comps…