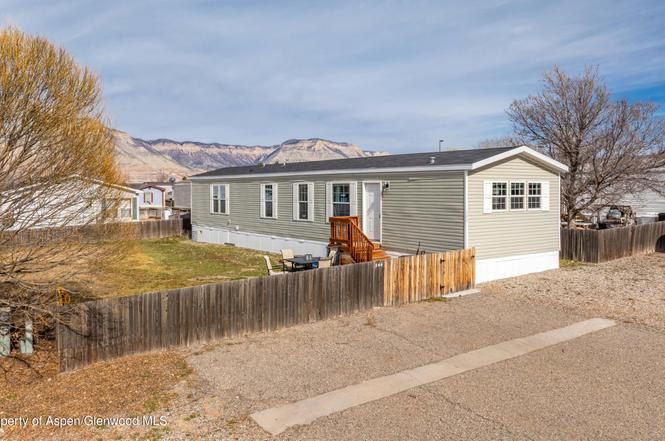
244 Bent Creek Cir · Battlement Mesa, CO
Flood risk 1/10 · Minimal
- FEMA flood zone
- X
- Chance of flooding over 30 yrs
- 0.0%
- Est. flood insurance / yr
- $507 – $1,088
Fire risk 6/10 · Moderate
- Est. fire insurance / yr
- $939 – $1,743
Heat risk 4/10 · Minor
- Hot days now (above 88°F)
- 7 days/yr
- Hot days in 30 yrs
- 20 days/yr
Wind risk 1/10 · Minimal
- Chance of severe wind over 30 yrs
- —
Air-quality risk 2/10 · Minimal
- Unhealthy air days now
- 2 days/yr
- Unhealthy air days in 30 yrs
- 2 days/yr
Risk factors via First Street. Map © Google.
Why this score? — see what drove the C grade
The composite is a weighted blend of 9 inputs, each scored 0–100. Each bar is that input's sub-score; the figure is the points it added to the 100-point composite (weight × sub-score).
- Cash flow +20.5/30.0
- Appreciation +10.0/10.0
- ARV discount +7.5/15.0
- DSCR +6.5/10.0
- 1% rule +5.4/10.0
- Livability +3.0/5.0
- Rent growth +2.5/5.0
- Condition / age +2.5/5.0
- Schools +1.9/10.0
$125,000
🖨 Deal sheet (PDF) 📄 Offer letter ✓ Due diligence
Listing remarks MLS
This home has a great layout ans is very tastefully done. It has nice sized bedrooms and a fireplace in the living room.
Key facts
- Ample counter space
- Fenced yard
- Walk-in closet
Tags
Neighborhood map
What this means for you Summary
Snapshot
- This is a 3-bed/2.0-bath single-family listed at $125k.
Deal economics
- At list price, monthly cash flow is $165 ($2k/yr) — positive.
- The deal already cash-flows at list — no discount required.
- Meets the 1% rule at list price ($1k rent vs $125k).
- Recommended offer: $118k (6.0% below list) — sets the bar for market timing.
- Cap rate 7.9% vs local median 1.8% in Battlement Mesa — top-decile yield for the area; either an underpriced asset or a hidden risk that comps aren't pricing in. Stress-test before assuming the spread holds.
Location & tenants
- Location reads 59/100 on livability (#287 in CO) — a working-class tenant base; expect higher turnover. Strengths: housing A+, cost of living B+, employment B; Watch: crime C-, schools F, amenities F.
- Grand Valley School District No. 16 In The County Of Garfi (town): math 18% / reading 23% proficiency, ranked #72 of 86 in CO (top 84%) — low school quality limits family demand, transient renter base, plan for 1-2y turnover.
- Market conditions: 122 active listings in the ZIP; 171 units permitted in Garfield County in 2024 (64 in 5+ unit buildings).
Forward outlook
- In year one you build about $13k of equity ($864 loan paydown + $12k appreciation (10.0% local appreciation)).
- Garfield County population projected at +5% by 2050 — modest demand growth; plan on rents tracking national, not racing it.
- At projected returns (10.0% appreciation + 3.0% rent growth), your $35k cash investment doubles in ~3 years — after that, you're playing with house money.
- By year 3, paydown + projected appreciation supports a ~$34k cash-out refi (75% LTV) — recoverable capital for the next deal without selling this one.
Negotiation context
- It's been on market 74 days — a 6% lower offer ($118k) is reasonable based on typical stale-listing flexibility.
- Current owner paid $23k; list at $125k implies a 443% gain — meaningful room to come down on a strong offer.
Risks & watch-outs
- Climate carrying-cost: major wildfire risk — expect insurance premiums to compound above CPI over the hold.
Questions for the listing agent
- It's been on market 74 days. Have you received any prior offers? Is the seller open to a 6% concession, seller financing, or rate buy-down credit?
- Why hasn't it sold? Are there any deal-killer items the seller is aware of (foundation, flood, title, zoning, code violations)?
- Is there a deadline driving the sale (1031 exchange, divorce, estate, relocation)? That informs how much negotiation room exists.
- Schools are F-rated, which usually means shorter tenancies and higher turnover. Who's the typical renter profile here, and what's been the actual vacancy rate?
- What's the average days-on-market for RENTAL listings here right now (not sales)? A rising rental-DOM trend means longer vacancies and softer asking-rent achievability than the comps imply.
- What's the recent tenant-quality profile in this submarket — average credit score on applications, eviction rate, late-payment / NSF rate, and stable-employment percentage? A property-management company in the area should have these aggregated.
- How much new for-sale + rental construction is in the pipeline within 1–3 miles? Heavy new supply typically softens prices + rents 12–24 months out; constrained supply supports both.
Investment metrics
- 1% rule
- 1.04% ✓
- Cap rate
- 7.88%
- Cash-on-cash
- 5.67%
- DSCR
- 1.25
- GRM
- 8.0
CMA / ARV
- ARV (on-the-fly)
- $306,880
- Comps found
- 12
Show comp detail 12 sales within ~0.75 mi
| Address | Dist | Beds/Ba | Sqft | Sold | Price | $/sf | Match |
|---|---|---|---|---|---|---|---|
| 128 Horizon Cir | 0.14mi | 3/2.0 | 1,016 (-9%) | 1mo | $123,000 | $121 | 77 |
| 6 Pinnacle Pl | 0.18mi | 3/2.0 | 1,188 (+6%) | 7mo | $325,000 | $274 | 76 |
| 286 E Tamarack Cir | 0.37mi | 3/2.0 | 1,080 (-4%) | 10mo | $329,900 | $305 | 69 |
| 122 E Tamarack Cir | 0.47mi | 3/2.0 | 1,144 (+2%) | 8mo | $335,000 | $293 | 68 |
| 124 W Carson Cir | 0.52mi | 3/2.0 | 1,170 (+4%) | 1mo | $128,000 | $109 | 68 |
| 68 E Bonanza Pl | 0.39mi | 3/2.0 | 1,161 (+4%) | 10mo | $335,000 | $289 | 67 |
| 22 W Bonanza Pl | 0.31mi | 3/2.0 | 1,216 (+9%) | 8mo | $285,000 | $234 | 65 |
| 152 W Tamarack Cir | 0.29mi | 3/2.0 | 1,196 (+7%) | 14mo | $333,500 | $279 | 63 |
| 227 E Tamarack Cir | 0.42mi | 3/2.0 | 1,228 (+10%) | 2mo | $343,250 | $280 | 62 |
| 73 Mahogany Cir | 0.28mi | 4/2.0 (+1) | 1,013 (-10%) | 16mo | $105,000 | $104 | 53 |
| 47 E Tamarack Cir | 0.39mi | 3/2.0 | 1,269 (+13%) | 18mo | $325,000 | $256 | 44 |
| 340 Tamarisk Trl | 0.61mi | 3/2.0 | 980 (-12%) | 19mo | $51,000 | $52 | 35 |
Match score weights: distance 35% · size 25% · config 20% · recency 20%. Top-matched comps best support the ARV.
Projected returns pro-forma
10.0% appreciation · 3.0% rent growth · sell at horizon
- IRR
- 28.4%
- Equity multiple
- 3.25×
- Total profit
- $78,631
- Equity at exit
- $112,610
- IRR
- 24.7%
- Equity multiple
- 7.38×
- Total profit
- $223,311
- Equity at exit
- $242,848
Cash invested: $35,000 (down + closing). Projections, not guarantees.
Landlord ↔ Tenant lean methodology
- Overall (STATE)
- 38 Tenant-Leaning
- State Colorado
- 38 Tenant-Leaning · D+4
- County
- — inherits STATE
- City
- — inherits STATE
ZIP-level market 81635
- Home prices YoY
- 3.1%
- Active inventory
- 122
- Price-to-rent
- 8.0×
Monthly cashflow live
- Estimated rent
- $1,303 medium interval (Pro) →
- Mortgage (P&I)
- −$656
- Tax est. 1.5%
- −$156 /mo · $1,875/yr
- Insurance
- −$52
- HOA
- −$0
- Vacancy / Maint / Mgmt
- −$274
- Net cashflow
- $165
Break-even live
Sensitivity live
| Price | -10% $252 | -5% $209 | +0% $165 | +5% $122 | +10% $79 |
|---|---|---|---|---|---|
| Rent | -10% $62 | -5% $114 | +0% $165 | +5% $217 | +10% $268 |
| Rate | -1.0pp $228 | -0.5pp $197 | base $165 | +0.5pp $133 | +1.0pp $100 |
UW: 25.0% down · 7.5% · 30yr · 1.5% tax · 5.0% vac · 8.0% maint · 8.0% mgmt
Financing live
Cash to close
- Down payment
- $31,250
- Closing costs
- $3,750
- Reserves months
- —
- Total cash needed
- —
Loan-product check · same deal, 3 products live
Conventional
25% down · 7.5% · 30yr
- Down + closing
- —
- Monthly P&I
- —
- Monthly cashflow
- —
- DSCR
- —
- Eligible?
- —
Personal DTI + credit; lowest rate.
DSCR
20% down · 8.5% · 30yr
- Down + closing
- —
- Monthly P&I
- —
- Monthly cashflow
- —
- DSCR
- —
- Eligible?
- —
No personal income docs; deal must DSCR.
Hard money
10% down · 12.0% · 12mo
- Down + closing
- —
- Monthly P&I
- —
- Monthly cashflow
- —
- DSCR
- —
- Eligible?
- —
Short-term bridge; refi at stabilization.
Listing history 4 events
-
2026-04-25status Pending
-
2026-03-11price $125,000
-
2026-01-30$130,000 Active
-
2013-07-10soldstatus $23,000 120-char remark
Show marketing remark (120 chars)
This home has a great layout ans is very tastefully done. It has nice sized bedrooms and a fireplace in the living room.
ⓘ Source: listings_history table (triggers on properties + properties_extension) + one-shot
backfill from property_details.listing_events for pre-trigger history.
Climate risk First Street
- Flood 1/10 Low FEMA zone X · 0% chance over 30 yrs
- Wildfire 6/10 Major
- Heat 4/10 Moderate 7 d/yr ≥88°F today · 20 d/yr by 30 yrs out
- Wind 1/10 Low
- Air quality 2/10 Low 2 unhealthy d/yr today · 2 by 30 yrs out
Nearby sold comps map
Loading sold comps map…
Walkable amenities ~0.75 mi
Loading nearby amenities…
Taxation est. · year 1
- Rental income
- $15,634
- − Mortgage interest
- −$7,002
- − Property taxes
- −$1,875
- − Insurance
- −$625
- − Repairs & maintenance
- −$1,251
- − Management
- −$1,251
- − Depreciation
- −$3,636
- Taxable loss
- −$6
- Est. tax savings @ 24.0%
- +$1
- After-tax cash flow
- $1,986/yr
For passive investors: Depreciation is non-cash, so a rental often shows a tax loss while cash-flowing — sheltering income. Rental losses are passive: they offset passive income freely, and up to $25,000/yr can offset ordinary (W-2) income if you actively participate and your MAGI is under $100k (phasing out to $0 by $150k); unused losses carry forward. On sale, claimed depreciation is recaptured at up to 25%, and gains may owe capital-gains tax (a 1031 exchange can defer both). Figures are a year-1 estimate at your 24.0% rate — not tax advice; consult a CPA.
Schools (NCES district)
- District
- Grand Valley School District No. 16 In The County Of Garfi
- NCES district ID
- 0804380
- Math proficiency
- 18% ▲ 3.00%
- Reading proficiency
- 23% ▼ -2.00%
- Median HH income
- $59,301
- Composite
- 19.2/100
- National rank
- #8815
- State rank
- #72 of 86 in CO
Livability — Battlement Mesa
- Score
- 59/100
- State rank
- #287
- US rank
- #20600
Category grades
Schools grade is shown separately in the Schools card above.
Census & demographics
- Census place
- Battlement Mesa, CO
- Population (ZIP)
- 7,155
Population outlook (Garfield County) Hauer SSP2
- Today (2025)
- 61,756 people
- By 2030
- 63,255 · +2.4%
- By 2040
- 64,952 · +5.2%
- By 2050
- 64,937 · +5.2%
- By 2075
- 62,413 · +1.1%
- By 2100
- 55,730 · -9.8%
Race, ethnicity, and origin ACS 2023
- Neighborhood character
- Predominantly White (70%)
- Race & ethnicity
- White 70% Hispanic / Latino 24% Two or more races 6% Asian 1%
- Hispanic origin (detail)
- Mexican 21%
- Common ancestry
- Lithuanian 2% Portuguese 2% Serbian 1%
- Foreign-born
- 9% · Canada
- Languages at home
- 81% English-only · Spanish 19%
Political lean MEDSL · Garfield
- 2024 margin
- Toss-up / Even · D 49.8% · R 47.7% · Other 2.5%
- 2008→2024 swing
- +2.1pp toward D · 2008: -0.0pp · 2024: 2.1pp
- All cycles
- 2024: D+2.1 2020: D+2.3 2016: R+7.1 2012: R+4.9 2008: R+0.0
Not yet ingested
- Civics
- —
Market trends
- HPI YoY
- ▲ 12.90%
- Current HPI
- 434.5219
- Rent YoY
- —
- Metro
- —
- State GDP YoY
- ▲ 1.95%
- F500 in state
- 14
Industry mix (Fortune 500 HQ in CO)
| Industry | F500 HQs | Revenue |
|---|---|---|
| Technology Distribution | 1 | $31B |
|
||
| Food / Agriculture | 1 | $18B |
|
||
| Packaging | 1 | $14B |
|
||
| Healthcare | 1 | $13B |
|
||
| Energy | 1 | $10B |
|
||
| Technology | 1 | $4B |
|
||
Price history
+443.5% since first listed4 events — show timeline
- 2026-04-25 Pending — AGMLS
- 2026-03-11 Price Changed $125,000 AGMLS
- 2026-01-30 Listed $130,000 AGMLS
- 2013-07-10 Sold (MLS) $23,000 AGMLS
Cash-flow waterfall
monthlySold comps — $/sqft
last 12 mo · ≤1 miLoading sold comps…