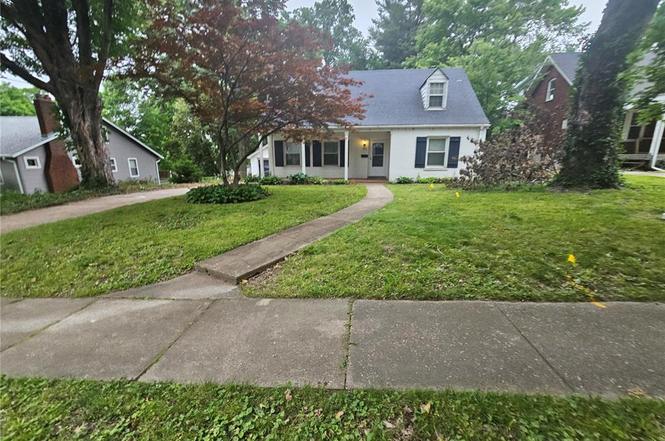
326 Tiffin Ave · Ferguson, MO
Flood risk 1/10 · Minimal
- FEMA flood zone
- X (unshaded)
- Chance of flooding over 30 yrs
- 0.0%
- Est. flood insurance / yr
- $473 – $860
Fire risk 1/10 · Minimal
- Est. fire insurance / yr
- $1,054 – $1,958
Heat risk 4/10 · Minor
- Hot days now (above 106°F)
- 7 days/yr
- Hot days in 30 yrs
- 20 days/yr
Wind risk 2/10 · Minimal
- Chance of severe wind over 30 yrs
- 1.0%
Air-quality risk 4/10 · Minor
- Unhealthy air days now
- 4 days/yr
- Unhealthy air days in 30 yrs
- 5 days/yr
Risk factors via First Street. Map © Google.
Why this score? — see what drove the B- grade
The composite is a weighted blend of 9 inputs, each scored 0–100. Each bar is that input's sub-score; the figure is the points it added to the 100-point composite (weight × sub-score).
- Cash flow +24.8/30.0
- ARV discount +15.0/15.0
- DSCR +8.1/10.0
- 1% rule +6.3/10.0
- Rent growth +4.8/5.0
- Livability +2.9/5.0
- Condition / age +2.5/5.0
- Schools +1.2/10.0
- Appreciation +0.0/10.0
$124,900
🖨 Deal sheet 📄 Offer letter ✓ Due diligence
Listing remarks MLS
Nice Brick story and a half on a very quiet street near many of the historic homes in Ferguson. The home boasts hardwood floors, large bedrooms and a large fenced in yard. The entire second floor is the large master bedroom, approximately 600 sq ft. The home needs some minor work, but will be nice for an investor or owner occupant.Title being transferred via Special Warranty Deed. House sold as-is.
Key facts
- Functional kitchen
- Formal dining room
- Classic period trim
Tags
Property features AI
Finance
- Other: Living area per assessor: 1,512; Lot size approximately 0.3719 acres
- Financial info: Lease not considered
Exterior
- Parking: Detached garage with garage door opener (1 garage space, 1 total parking)
- Utilities: Public water; Public sewer; Electric: Other
- Home design: Single-family residence; One and one-half levels; House structure
- Construction: Brick construction; Composition roof; Slab foundation; Built (year per assessor)
- Exterior features: Patio; Level lot
Interior
- Kitchen: Dishwasher; Disposal; Built-in electric oven; Range
- Bedrooms: 3 bedrooms total; 2 bedrooms on the main level, 1 bedroom on the upper level
- Flooring: Carpet; Hardwood
- Bathrooms: 1 full bathroom (main/upper levels)
- Heating & cooling: Heating: Other; Cooling: Central air, Electric, Wall/Window unit(s)
- Interior features: Fireplace (wood-burning); Full basement with walk-out access and poured walls (8 ft+), partially finished
Neighborhood map
What this means for you Summary
Snapshot
- This is a 2-bed/1.0-bath single-family listed at $125k.
Deal economics
- At list price, monthly cash flow is $266 ($3k/yr) — positive.
- The deal already cash-flows at list — no discount required.
- Meets the 1% rule at list price ($1k rent vs $125k).
Location & tenants
- Location reads 58/100 on livability (#586 in MO) — a working-class tenant base; expect higher turnover. Strengths: cost of living A+, housing B+; Watch: health & safety C-, crime F, amenities F.
- Ferguson-Florissant R-II (suburban): math 7% / reading 20% proficiency, ranked #311 of 324 in MO (top 96%) — low school quality limits family demand, transient renter base, plan for 1-2y turnover; 70% free/reduced lunch — lower-income household profile, screen leases tightly.
- Zoned schools: Central Elementary (180 students, 98% FRL); Mccluer High (math 0% / reading 17%, grade F, #511 of 521 statewide, top 98%, 1,181 students, 100% FRL) — zoned schools average 99% FRL vs 70% district-wide (30 pts higher); higher-poverty schools than district average — tighter screening recommended.
- Market conditions: Rents rising fast (+9.0%/yr); 162 active listings in the ZIP; 12 comparable units currently listed for rent nearby; rentals at typical pace (median 24d on market — plan ~3-4 weeks tenant-placement turnaround); 42% of comp listings sitting > 30 days — soft ceiling on asking rent; 920 units permitted in St. Louis County in 2024 (250 in 5+ unit buildings).
- This rent runs 32% of the median local income ($52k/yr) — at the standard rent-burdened threshold; future hikes will face affordability resistance.
Forward outlook
- Local home prices are declining (-3.0%/yr); year-one equity from $864 of loan paydown is wiped out by about $4k of value loss. Plan a longer hold.
- At projected returns (-3.0% appreciation + 8.0% rent growth), your $35k cash investment doubles in ~8 years — after that, you're playing with house money.
Negotiation context
- Only 1 days on market — expect competitive offers; lowballing is unlikely to land.
- 3 sale attempts since 14y ago with the ask held roughly flat each time — persistent listings suggest the price (not the market) is what's stuck; bring a comps-based counter.
- Current owner paid $50k; list at $125k implies a 152% gain — meaningful room to come down on a strong offer.
Risks & watch-outs
- Watch-outs: built in 1932 — expect roof / HVAC / electrical / plumbing capex.
Questions for the listing agent
- Built in 1932 — when were the roof, HVAC, electrical panel, plumbing, and water heater last replaced?
- Is there a deadline driving the sale (1031 exchange, divorce, estate, relocation)? That informs how much negotiation room exists.
- Schools are F-rated, which usually means shorter tenancies and higher turnover. Who's the typical renter profile here, and what's been the actual vacancy rate?
- Crime grade is F in this area — have there been break-ins, vandalism, or insurance claims at this property in the last 3 years? What carrier currently insures it and at what premium?
- What's the average days-on-market for RENTAL listings here right now (not sales)? A rising rental-DOM trend means longer vacancies and softer asking-rent achievability than the comps imply.
- What's the recent tenant-quality profile in this submarket — average credit score on applications, eviction rate, late-payment / NSF rate, and stable-employment percentage? A property-management company in the area should have these aggregated.
- How much new for-sale + rental construction is in the pipeline within 1–3 miles? Heavy new supply typically softens prices + rents 12–24 months out; constrained supply supports both.
Investment metrics
- 1% rule
- 1.13% ✓
- Cap rate
- 8.84%
- Cash-on-cash
- 9.11%
- DSCR
- 1.41
- GRM
- 7.4
CMA / ARV
- ARV (on-the-fly)
- $161,784
- Comps found
- 12
Show comp detail 12 sales within ~0.75 mi
| Address | Dist | Beds/Ba | Sqft | Sold | Price | $/sf | Match |
|---|---|---|---|---|---|---|---|
| 231 Georgia Ave | 0.09mi | 2/2.0 | 1,479 (-2%) | 0mo | $79,000 | $53 | 88 |
| 424 S Clark Ave | 0.31mi | 3/1.0 (+1) | 1,596 (+6%) | 12mo | $149,900 | $94 | 61 |
| 425 S Clark Ave | 0.30mi | 3/1.5 (+1) | 1,734 (+15%) | 2mo | $190,000 | $110 | 53 |
| 212 Louisa Ave | 0.20mi | 3/2.0 (+1) | 1,344 (-11%) | 13mo | $160,000 | $119 | 52 |
| 335 St Louis Ave | 0.53mi | 3/1.5 (+1) | 1,456 (-4%) | 12mo | $155,000 | $106 | 52 |
| 515 Carson Rd | 0.28mi | 3/2.0 (+1) | 1,726 (+14%) | 11mo | $152,000 | $88 | 45 |
| 103 Thoroughman Ave | 0.72mi | 3/1.5 (+1) | 1,418 (-6%) | 9mo | $152,000 | $107 | 42 |
| 215 Bruce Ave | 0.61mi | 2/2.0 | 1,312 (-13%) | 7mo | $145,000 | $111 | 40 |
| 818 Arline Ave | 0.56mi | 3/1.0 (+1) | 1,300 (-14%) | 8mo | $79,900 | $61 | 39 |
| 119 N Clay N | 0.63mi | 3/1.0 (+1) | 1,674 (+11%) | 10mo | $199,900 | $119 | 39 |
| 129 Darst Rd | 0.51mi | 3/1.5 (+1) | 1,328 (-12%) | 12mo | $180,000 | $136 | 38 |
| 8445 Hawkesbury Dr | 0.70mi | 3/1.5 (+1) | 1,311 (-13%) | 5mo | $88,650 | $68 | 34 |
Match score weights: distance 35% · size 25% · config 20% · recency 20%. Top-matched comps best support the ARV.
Projected returns pro-forma
-3.0% appreciation · 8.0% rent growth · sell at horizon
- IRR
- 2.9%
- Equity multiple
- 1.12×
- Total profit
- $4,159
- Equity at exit
- $18,623
- IRR
- 16.8%
- Equity multiple
- 2.70×
- Total profit
- $59,459
- Equity at exit
- $10,799
Cash invested: $34,972 (down + closing). Projections, not guarantees.
Landlord ↔ Tenant lean methodology
- Overall (STATE)
- 81 Strongly Landlord-Friendly
- State Missouri
- 81 Strongly Landlord-Friendly · R+10
- County
- — inherits STATE
- City
- — inherits STATE
ZIP-level market 63135
- Rents YoY
- 9.0%
- Active inventory
- 162
- Price-to-rent
- 7.4×
Monthly cashflow live
- Estimated rent
- $1,414 high interval (Pro) →
- Mortgage (P&I)
- −$655
- Tax from tax record
- −$144 /mo · $1,730/yr
- Insurance
- −$52
- HOA
- −$0
- Vacancy / Maint / Mgmt
- −$297
- Net cashflow
- $266
Break-even live
UW: 25.0% down · 7.5% · 30yr · 1.5% tax · 5.0% vac · 8.0% maint · 8.0% mgmt
Financing live
Cash to close
- Down payment
- $31,225
- Closing costs
- $3,747
- Reserves months
- —
- Total cash needed
- —
Loan-product check · same deal, 3 products live
Conventional
25% down · 7.5% · 30yr
- Down + closing
- —
- Monthly P&I
- —
- Monthly cashflow
- —
- DSCR
- —
- Eligible?
- —
Personal DTI + credit; lowest rate.
DSCR
20% down · 8.5% · 30yr
- Down + closing
- —
- Monthly P&I
- —
- Monthly cashflow
- —
- DSCR
- —
- Eligible?
- —
No personal income docs; deal must DSCR.
Hard money
10% down · 12.0% · 12mo
- Down + closing
- —
- Monthly P&I
- —
- Monthly cashflow
- —
- DSCR
- —
- Eligible?
- —
Short-term bridge; refi at stabilization.
Rent comps 12 comps
| Address | Beds | Baths | Sqft | Rent | $/sqft | DOM | Units | Dist |
|---|---|---|---|---|---|---|---|---|
| 265 S Harvey Ave Saint Louis, MO | 3.0 | 1.5 | 1240 | $1,350 | $1.09 | 44d | 1 | 0.23mi |
| 324 Emmett Ave Saint Louis, MO | 3.0 | 2.0 | 1357 | $1,650 | $1.22 | 24d | 1 | 0.30mi |
| 419 S Florissant Rd Ferguson, MO | 2.0 | 1.0 | 1100 | $1,200 | $1.09 | 44d | 1 | 0.41mi |
| 338 Saint Louis Ave Saint Louis, MO | 3.0 | 1.0 | 1200 | $1,200 | $1.00 | 44d | 1 | 0.58mi |
| 13 N Hartnett Ave Saint Louis, MO | 3.0 | 1.0 | 1140 | $1,400 | $1.23 | 10d | 1 | 0.94mi |
| 6170 Emerald Ave Saint Louis, MO | 3.0 | 1.0 | 1286 | $1,500 | $1.17 | 15d | 1 | 1.07mi |
| 6170 Emerald Ave Saint Louis, MO | 3.0 | 1.0 | 1286 | $1,425 | $1.11 | 2d | 1 | 1.07mi |
| 541 Hentschel Pl Saint Louis, MO | 2.0 | 1.0 | 1305 | $1,500 | $1.15 | 4d | 1 | 1.08mi |
| 1006 Highmont Dr Saint Louis, MO | 3.0 | 1.0 | 1920 | $1,550 | $0.81 | 44d | 1 | 1.09mi |
| 945 Edgehill Dr Saint Louis, MO | 3.0 | 1.0 | 1110 | $1,575 | $1.42 | 44d | 1 | 1.13mi |
| 299 Dashwood Dr Saint Louis, MO | 3.0 | 2.0 | 1920 | $1,575 | $0.82 | 24d | 1 | 1.13mi |
| 1131 N Florissant Rd Saint Louis, MO | 3.0 | 1.0 | 1580 | $1,390 | $0.88 | 24d | 1 | 1.47mi |
Listing history 2 events
-
2026-06-19remarks 638-char remark
-
2026-06-19$124,900 Active 1 DOM
ⓘ Source: listings_history table (triggers on properties + properties_extension) + one-shot
backfill from property_details.listing_events for pre-trigger history.
Tax reassessment forecast MO · Resets to sale price
- Current annual tax
- $1,730 · $144/mo
- Projected year-2 tax
- $1,730 · $144/mo
- Expected delta
- $0/yr ($0/mo · 0.0%)
ⓘ Screening estimate from a state-policy table — verify with the county assessor before closing.
Climate risk First Street
- Flood 1/10 Low FEMA zone X (unshaded) · 0% chance over 30 yrs
- Wildfire 1/10 Low
- Heat 4/10 Moderate 7 d/yr ≥106°F today · 20 d/yr by 30 yrs out
- Wind 2/10 Low 100% chance of damaging wind over 30 yrs
- Air quality 4/10 Moderate 4 unhealthy d/yr today · 5 by 30 yrs out
Nearby sold comps map
Loading sold comps map…
Walkable amenities ~0.75 mi
Loading nearby amenities…
Taxation est. · year 1
- Rental income
- $16,964
- − Mortgage interest
- −$6,996
- − Property taxes
- −$1,730
- − Insurance
- −$624
- − Repairs & maintenance
- −$1,357
- − Management
- −$1,357
- − Depreciation
- −$3,633
- Taxable income
- $1,265
- Est. tax owed @ 24.0%
- −$304
- After-tax cash flow
- $2,883/yr
For passive investors: Depreciation is non-cash, so a rental often shows a tax loss while cash-flowing — sheltering income. Rental losses are passive: they offset passive income freely, and up to $25,000/yr can offset ordinary (W-2) income if you actively participate and your MAGI is under $100k (phasing out to $0 by $150k); unused losses carry forward. On sale, claimed depreciation is recaptured at up to 25%, and gains may owe capital-gains tax (a 1031 exchange can defer both). Figures are a year-1 estimate at your 24.0% rate — not tax advice; consult a CPA.
Schools (NCES district)
- District
- Ferguson-Florissant R-II
- NCES district ID
- 2912010
- Math proficiency
- 7% ▼ -9.00%
- Reading proficiency
- 20% ▼ -6.00%
- Median HH income
- $44,610
- Composite
- 11.96/100
- National rank
- #9666
- State rank
- #311 of 324 in MO
Livability — Ferguson
- Score
- 58/100
- State rank
- #586
- US rank
- #20809
Category grades
Schools grade is shown separately in the Schools card above.
Census & demographics
- Census place
- Ferguson, MO
- County
- Saint Louis County · 888,823 people
- City population
- 18,381
- Metro
- St. Louis, MO-IL
- Population (ZIP)
- 18,381
- Household income
- $52,328
- Rent vs Own
- Severe rent burden
- 957.0
Population outlook (St. Louis County) Hauer SSP2
- Today (2025)
- 1,025,227 people
- By 2030
- 1,028,023 · +0.3%
- By 2040
- 1,020,940 · -0.4%
- By 2050
- 1,007,280 · -1.8%
- By 2075
- 987,277 · -3.7%
- By 2100
- 921,984 · -10.1%
Race, ethnicity, and origin ACS 2023
- Neighborhood character
- Predominantly Black (66%)
- Race & ethnicity
- Black 66% White 28% Two or more races 3% Hispanic / Latino 2%
- Common ancestry
- Lithuanian 1% Iranian 1% Romanian 1%
- Foreign-born
- 1% · Canada
- Languages at home
- 95% English-only · Spanish 4%
Political lean MEDSL · St. Louis
- 2024 margin
- Strong D (+23.4) · D 60.8% · R 37.4% · Other 1.7%
- 2008→2024 swing
- +3.5pp toward D · 2008: 19.9pp · 2024: 23.4pp
- All cycles
- 2024: D+23.4 2020: D+24.0 2016: D+16.2 2012: D+13.7 2008: D+19.9
Not yet ingested
- Civics
- —
Market trends
- HPI YoY
- ▼ -152.56%
- Current HPI
- 138.6781
- Rent YoY
- ▲ 9.03%
- Metro
- St. Louis, MO-IL
- State GDP YoY
- ▲ 1.84%
- F500 in state
- 20
Industry mix (Fortune 500 HQ in MO)
| Industry | F500 HQs | Revenue |
|---|---|---|
| Healthcare | 1 | $163B |
|
||
| Insurance | 1 | $21B |
|
||
| Industrial Technology | 1 | $17B |
|
||
| Retail | 1 | $16B |
|
||
| Industrial Distribution | 1 | $10B |
|
||
| Utilities | 1 | $9B |
|
||
Price history
+26.2% since first listed9 events — show timeline
- 2026-06-18 Listed $124,900 MARIS as Distributed by MLS Grid
- 2019-09-24 Sold (Public Records) $49,500 Public Records
- 2019-09-20 Sold (MLS) — MARIS as Distributed by MLS Grid
- 2019-09-03 Pending — MARIS as Distributed by MLS Grid
- 2019-08-26 Listed $54,900 MARIS as Distributed by MLS Grid
- 2013-02-05 Sold (Public Records) $55,000 Public Records
- 2013-01-25 Sold (MLS) — MARIS as Distributed by MLS Grid
- 2012-06-09 Listed $75,000 MARIS as Distributed by MLS Grid
- 2003-07-21 Sold (Public Records) $99,000 Public Records
Property tax history
+0.2%/yrLatest (2022): $1,730 · +3.3% YoY. Source: county tax records.
Cash-flow waterfall
monthlySold comps — $/sqft
last 12 mo · ≤1 miLoading sold comps…