401 Paris St · Pecan Gap, TX
Flood risk 1/10 · Minimal
- FEMA flood zone
- —
- Chance of flooding over 30 yrs
- 0.0%
- Est. flood insurance / yr
- —
Fire risk 6/10 · Moderate
- Est. fire insurance / yr
- $1,222 – $2,270
Heat risk 7/10 · Major
- Hot days now (above 110°F)
- 6 days/yr
- Hot days in 30 yrs
- 20 days/yr
Wind risk 4/10 · Minor
- Chance of severe wind over 30 yrs
- 24.0%
Air-quality risk 2/10 · Minimal
- Unhealthy air days now
- 0 days/yr
- Unhealthy air days in 30 yrs
- 1 days/yr
Risk factors via First Street. Map © Google.
Why this score? — see what drove the C+ grade
The composite is a weighted blend of 9 inputs, each scored 0–100. Each bar is that input's sub-score; the figure is the points it added to the 100-point composite (weight × sub-score).
- Cash flow +25.2/30.0
- DSCR +8.3/10.0
- 1% rule +7.7/10.0
- ARV discount +7.5/15.0
- Appreciation +5.0/10.0
- Livability +3.0/5.0
- Schools +2.6/10.0
- Rent growth +2.5/5.0
- Condition / age +2.5/5.0
$80,000
🖨 Deal sheet 📄 Offer letter ✓ Due diligence
Listing remarks
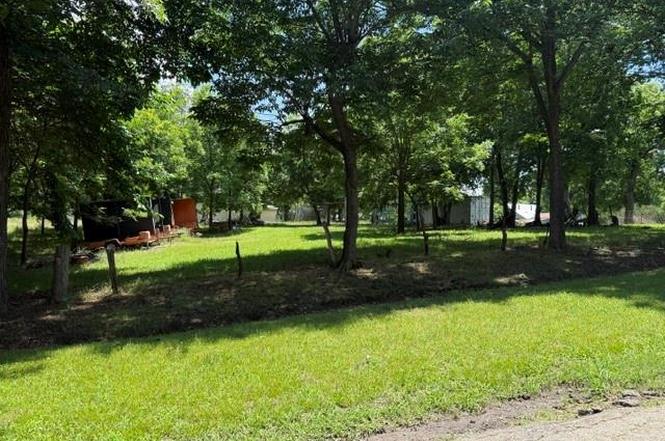
Beautiful tree shaded lots that go from Paris St back to Mayo st. House needs work but would be a great investment opportunity to either fix up or build more houses on the lots.
Key facts
- 1 acre lot
- Built 1900
- Listed 4 days
Property features AI
Finance
- Other: Located in Old Town Pecan Gap subdivision; County: Delta; Standard listing agreement
- Financial info: Listing for sale (Active); Original and current list price available; Treat as clear loan type
- HOA & community: No association
Exterior
- Parking: Driveway parking
- Utilities: City water; City sewer; Property in a municipal utility district
- Home design: Single-family residence; One story; Attached property
- Construction: Frame construction; Built in 1900
- Exterior features: Large backyard with grass; Few trees
Interior
- Kitchen: Other appliances
- Bedrooms: One primary bedroom on the main level
- Bathrooms: One full bathroom
- Interior features: Two main rooms; One living area; Other interior features
- Laundry & utility: No specific laundry or utility details provided
Neighborhood map
What this means for you Summary
Snapshot
- This is a 1-bed/1.0-bath single-family listed at $80k.
Deal economics
- At list price, monthly cash flow is $180 ($2k/yr) — positive.
- The deal already cash-flows at list — no discount required.
- Meets the 1% rule at list price ($1k rent vs $80k).
Location & tenants
- Location reads 60/100 on livability (#1,090 in TX) — a middle-class / working-renter tenant base. Strengths: cost of living A+, housing A+, employment B; Watch: crime C-, amenities F, commute F.
- Fannindel ISD (rural): math 25% / reading 30% proficiency, ranked #1,057 of 1,141 in TX (top 93%) — low school quality limits family demand, transient renter base, plan for 1-2y turnover; 70% free/reduced lunch — lower-income household profile, screen leases tightly.
- Zoned schools: Fannindel El (math 10% / reading 10%, grade F, #4,250 of 4,322 statewide, top 99%, 83 students, 95% FRL) — zoned schools average 95% FRL vs 70% district-wide (25 pts higher); higher-poverty schools than district average — tighter screening recommended.
- Zoned-school proficiency averages 10% at this address vs 28% district-wide (-18 pts) — the specific schools serving this property underperform the Fannindel ISD average; the district grade overstates school quality for this exact location.
- Market conditions: 21 active listings in the ZIP; 7 units permitted in Delta County in 2024 (0 in 5+ unit buildings).
Forward outlook
- In year one you build about $3k of equity ($553 loan paydown + $2k appreciation (3.0% local appreciation)).
- Delta County population projected to shrink 6% by 2050 — rents likely to lag national; underwrite the cash flow, not the appreciation.
- At projected returns (3.0% appreciation + 3.0% rent growth), your $22k cash investment doubles in ~4 years — after that, you're playing with house money.
Negotiation context
- Only 4 days on market — expect competitive offers; lowballing is unlikely to land.
Risks & watch-outs
- Watch-outs: property tax is 2.6% of price; built in 1900 — expect roof / HVAC / electrical / plumbing capex.
- Climate carrying-cost: major wildfire risk; extreme-heat days projected 6→20/yr by 2055 (HVAC capex compounding) — expect insurance premiums to compound above CPI over the hold.
Questions for the listing agent
- Built in 1900 — when were the roof, HVAC, electrical panel, plumbing, and water heater last replaced?
- Property tax is high relative to price — has the assessment been appealed recently, and will the sale trigger a re-assessment?
- Is there a deadline driving the sale (1031 exchange, divorce, estate, relocation)? That informs how much negotiation room exists.
- Schools are D-rated, which usually means shorter tenancies and higher turnover. Who's the typical renter profile here, and what's been the actual vacancy rate?
- What's the average days-on-market for RENTAL listings here right now (not sales)? A rising rental-DOM trend means longer vacancies and softer asking-rent achievability than the comps imply.
- What's the recent tenant-quality profile in this submarket — average credit score on applications, eviction rate, late-payment / NSF rate, and stable-employment percentage? A property-management company in the area should have these aggregated.
- How much new for-sale + rental construction is in the pipeline within 1–3 miles? Heavy new supply typically softens prices + rents 12–24 months out; constrained supply supports both.
Investment metrics
- 1% rule
- 1.27% ✓
- Cap rate
- 9.00%
- Cash-on-cash
- 9.66%
- DSCR
- 1.43
- GRM
- 6.5
CMA / ARV
No comps found within radius.
Projected returns pro-forma
3.0% appreciation · 3.0% rent growth · sell at horizon
- IRR
- 16.6%
- Equity multiple
- 1.95×
- Total profit
- $21,180
- Equity at exit
- $35,971
- IRR
- 18.1%
- Equity multiple
- 3.65×
- Total profit
- $59,397
- Equity at exit
- $55,436
Cash invested: $22,400 (down + closing). Projections, not guarantees.
Landlord ↔ Tenant lean methodology
- Overall (STATE)
- 87 Strongly Landlord-Friendly
- State Texas
- 87 Strongly Landlord-Friendly · R+5
- County
- — inherits STATE
- City
- — inherits STATE
ZIP-level market 75469
- Active inventory
- 21
- Price-to-rent
- 6.5×
Monthly cashflow live
- Estimated rent
- $1,018 medium interval (Pro) →
- Mortgage (P&I)
- −$420
- Tax from tax record
- −$171 /mo · $2,052/yr
- Insurance
- −$33
- HOA
- −$0
- Vacancy / Maint / Mgmt
- −$214
- Net cashflow
- $180
Break-even live
UW: 25.0% down · 7.5% · 30yr · 1.5% tax · 5.0% vac · 8.0% maint · 8.0% mgmt
Financing live
Cash to close
- Down payment
- $20,000
- Closing costs
- $2,400
- Reserves months
- —
- Total cash needed
- —
Loan-product check · same deal, 3 products live
Conventional
25% down · 7.5% · 30yr
- Down + closing
- —
- Monthly P&I
- —
- Monthly cashflow
- —
- DSCR
- —
- Eligible?
- —
Personal DTI + credit; lowest rate.
DSCR
20% down · 8.5% · 30yr
- Down + closing
- —
- Monthly P&I
- —
- Monthly cashflow
- —
- DSCR
- —
- Eligible?
- —
No personal income docs; deal must DSCR.
Hard money
10% down · 12.0% · 12mo
- Down + closing
- —
- Monthly P&I
- —
- Monthly cashflow
- —
- DSCR
- —
- Eligible?
- —
Short-term bridge; refi at stabilization.
Listing history 5 events
-
2026-06-18days on market $80,000 Active 4 DOM
-
2026-06-17days on market $80,000 Active 3 DOM
-
2026-06-16days on market $80,000 Active 2 DOM
-
2026-06-15remarks 177-char remark
-
2026-06-15$80,000 Active 1 DOM
ⓘ Source: listings_history table (triggers on properties + properties_extension) + one-shot
backfill from property_details.listing_events for pre-trigger history.
Tax reassessment forecast TX · Resets to sale price
- Current annual tax
- $2,052 · $171/mo
- Projected year-2 tax
- $2,052 · $171/mo
- Expected delta
- $0/yr ($0/mo · 0.0%)
ⓘ Screening estimate from a state-policy table — verify with the county assessor before closing.
Climate risk First Street
- Flood 1/10 Low 0% chance over 30 yrs
- Wildfire 6/10 Major
- Heat 7/10 Severe 6 d/yr ≥110°F today · 20 d/yr by 30 yrs out
- Wind 4/10 Moderate 24% chance of damaging wind over 30 yrs
- Air quality 2/10 Low 0 unhealthy d/yr today · 1 by 30 yrs out
Nearby sold comps map
Loading sold comps map…
Walkable amenities ~0.75 mi
Loading nearby amenities…
Taxation est. · year 1
- Rental income
- $12,215
- − Mortgage interest
- −$4,481
- − Property taxes
- −$2,052
- − Insurance
- −$400
- − Repairs & maintenance
- −$977
- − Management
- −$977
- − Depreciation
- −$2,327
- Taxable income
- $1,000
- Est. tax owed @ 24.0%
- −$240
- After-tax cash flow
- $1,924/yr
For passive investors: Depreciation is non-cash, so a rental often shows a tax loss while cash-flowing — sheltering income. Rental losses are passive: they offset passive income freely, and up to $25,000/yr can offset ordinary (W-2) income if you actively participate and your MAGI is under $100k (phasing out to $0 by $150k); unused losses carry forward. On sale, claimed depreciation is recaptured at up to 25%, and gains may owe capital-gains tax (a 1031 exchange can defer both). Figures are a year-1 estimate at your 24.0% rate — not tax advice; consult a CPA.
Schools (NCES district)
- District
- Fannindel ISD
- NCES district ID
- 4819050
- Math proficiency
- 25% ▬ 0.00%
- Reading proficiency
- 30% ▲ 5.00%
- Median HH income
- $34,661
- Composite
- 25.59/100
- National rank
- #12831
- State rank
- #1057 of 1141 in TX
Livability — Pecan Gap
- Score
- 60/100
- State rank
- #1090
- US rank
- #19346
Category grades
Schools grade is shown separately in the Schools card above.
Census & demographics
- Census place
- Pecan Gap, TX
- Population (ZIP)
- 438
Population outlook (Delta County) Hauer SSP2
- Today (2025)
- 5,168 people
- By 2030
- 5,108 · -1.2%
- By 2040
- 4,960 · -4.0%
- By 2050
- 4,832 · -6.5%
- By 2075
- 4,402 · -14.8%
- By 2100
- 3,893 · -24.7%
Race, ethnicity, and origin ACS 2023
- Neighborhood character
- Predominantly White (96%)
- Race & ethnicity
- White 96% Hispanic / Latino 4%
- Common ancestry
- Slovak 3% Romanian 3% Portuguese 1%
- Foreign-born
- 2% · Canada
- Languages at home
- 97% English-only · Spanish 3%
Political lean MEDSL · Delta
- 2024 margin
- Solid R (+69.7) · D 14.9% · R 84.7%
- 2008→2024 swing
- -24.4pp toward R · 2008: -45.3pp · 2024: -69.7pp
- All cycles
- 2024: R+69.7 2020: R+67.9 2016: R+63.0 2012: R+53.0 2008: R+45.3
Not yet ingested
- Civics
- —
Market trends
- HPI YoY
- —
- Current HPI
- —
- Rent YoY
- —
- Metro
- —
- State GDP YoY
- ▲ 3.95%
- F500 in state
- 110
Industry mix (Fortune 500 HQ in TX)
| Industry | F500 HQs | Revenue |
|---|---|---|
| Energy | 16 | $1,198B |
|
||
| Technology | 5 | $198B |
|
||
| Engineering / Construction | 4 | $72B |
|
||
| Energy Services | 3 | $60B |
|
||
| Utilities | 3 | $41B |
|
||
| Healthcare | 2 | $330B |
|
||
Price history
2 events — show timeline
- 2026-06-12 Listed $80,000 NTREIS
- 2001-01-12 Sold (Public Records) — Public Records
Property tax history
+9.3%/yrLatest (2025): $2,052 · +27.8% YoY. Source: county tax records.
Cash-flow waterfall
monthlySold comps — $/sqft
last 12 mo · ≤1 miLoading sold comps…