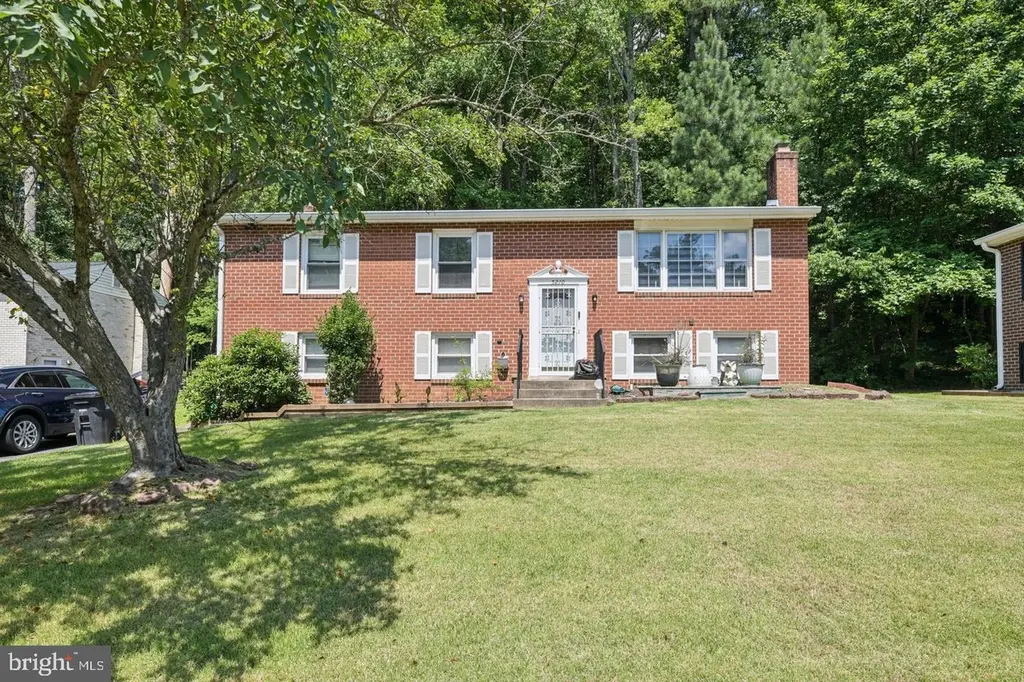
5210 W Boniwood Turn · Clinton, MD
Flood risk 1/10 · Minimal
- FEMA flood zone
- X (unshaded)
- Chance of flooding over 30 yrs
- 0.0%
- Est. flood insurance / yr
- $507 – $1,088
Fire risk 3/10 · Minor
- Est. fire insurance / yr
- $755 – $1,403
Heat risk 7/10 · Major
- Hot days now (above 103°F)
- 7 days/yr
- Hot days in 30 yrs
- 16 days/yr
Wind risk 5/10 · Moderate
- Chance of severe wind over 30 yrs
- 22.0%
Air-quality risk 2/10 · Minimal
- Unhealthy air days now
- 1 days/yr
- Unhealthy air days in 30 yrs
- 2 days/yr
Risk factors via First Street. Map © Google.
Why this score? — see what drove the F grade
The composite is a weighted blend of 9 inputs, each scored 0–100. Each bar is that input's sub-score; the figure is the points it added to the 100-point composite (weight × sub-score).
- Cash flow +10.0/30.0
- ARV discount +4.9/15.0
- Livability +3.2/5.0
- DSCR +2.8/10.0
- 1% rule +2.7/10.0
- Rent growth +2.5/5.0
- Condition / age +2.5/5.0
- Schools +1.7/10.0
- Appreciation +0.0/10.0
$455,000
🖨 Deal sheet (PDF) 📄 Offer letter ✓ Due diligence
Listing remarks
Welcome to 5210 W Boniwood Turn, a beautifully reimagined residence where modern design, refined craftsmanship, and turnkey convenience come together seamlessly. Extensively updated in 2026, this home delivers the rare opportunity to own a truly move-in-ready property finished with today’s most desirable materials and style. Offering 5 spacious suites and 3 fully renovated bathrooms, the home provides exceptional flexibility for comfortable everyday living, multigenerational needs, or elegant guest accommodations. Fresh designer paint (2026) and new luxury vinyl plank flooring (2026) create a cohesive, contemporary aesthetic, while resurfaced hardwood floors add warmth and timeless ch
Key facts
- Extensively updated
- New kitchen
- 7,406 sq ft lot
Tags
Property features AI
Finance
- Other: Fee simple ownership; Total below-grade finished area estimated at 1,212; Above-grade finished area estimated at 1,212; Property condition listed as excellent/very good; Ground rent payment frequency: annually
- HOA & community: HOA fee approximately $69.33 per month; HOA covers management and common area maintenance; HOA amenities include common grounds
Exterior
- Parking: Asphalt driveway; Driveway parking
- Utilities: Public water and public sewer; Natural gas for heating, cooling fuel, and hot water; Electric service for central systems
- Home design: Detached structure; Brick and stone construction; Architectural shingle roof; Slab foundation; Effective year of major renovation 2025 (year built estimated)
- Construction: Brick and stone exterior; Architectural shingle roof; Slab foundation
- Exterior features: Street lights and sidewalks; Deck(s) and patio(s); Pets allowed with no pet restrictions; Not in a federal flood zone
Interior
- Kitchen: Dishwasher; Gas oven/range; Built-in microwave; Food disposal; Refrigerator; Extra refrigerator/freezer; Upgraded countertops; Kitchen island
- Basement: Fully finished, heated basement with interior access and outside entrance; Poured concrete foundation, windows, walkout level
- Bedrooms: Three bedrooms on the main level; Two bedrooms on the lower level
- Flooring: Hardwood; Luxury vinyl plank
- Bathrooms: Two full bathrooms on the main level; One full bathroom on the lower level (three full bathrooms total)
- Fireplace: One fireplace
- Heating & cooling: Central heating (forced air) with natural gas; Central air conditioning with programmable thermostat; Hot water heated by natural gas
- Interior features: Breakfast area; Combination kitchen/dining and dining/living areas; Dining area; Family room off the kitchen; Kitchen with eat-in space and island; Pantry; Recessed lighting; Master bath(s) with tub/shower; Upgraded countertops; Insulated doors; High walls and ceilings (R-factor ceilings 49)
- Laundry & utility: Washer and dryer in unit (lower floor laundry); Water heater
Neighborhood map
What this means for you Summary
Snapshot
- This is a 5-bed/3.0-bath single-family listed at $455k.
Deal economics
- At list price, monthly cash flow is $-275 ($-3k/yr) — negative.
- To cash-flow at today's rent, offer at most $406k (10.7% below list).
- To meet the 1% rule (rent ≥ 1% of price), the offer needs to be $349k (23.4% below list).
- Recommended offer: $349k (23.4% below list) — sets the bar for 1% rule.
Location & tenants
- Location reads 63/100 on livability (#304 in MD) — a middle-class / working-renter tenant base. Strengths: employment A+, housing A+; Watch: crime D+, amenities F, commute F.
- Prince George'S County Public Schools (suburban): math 8% / reading 24% proficiency, ranked #21 of 24 in MD (top 88%) — low school quality limits family demand, transient renter base, plan for 1-2y turnover.
- Zoned schools: Waldon Woods Elementary (math 4% / reading 11%, grade F, #681 of 860 statewide, top 81%, 529 students, 70% FRL); Stephen Decatur Middle (math 3% / reading 24%, grade F, #198 of 225 statewide, top 88%, 781 students, 70% FRL); Surrattsville High (math 2% / reading 27%, grade F, #185 of 222 statewide, top 85%, 772 students, 60% FRL).
- Market conditions: 124 active listings in the ZIP; 6 comparable units currently listed for rent nearby; rentals at typical pace (median 26d on market — plan ~3-4 weeks tenant-placement turnaround); high-income renter base; 1,481 units permitted in Prince George's County in 2024 (0 in 5+ unit buildings).
- This rent runs 33% of the median local income ($126k/yr) — at the standard rent-burdened threshold; future hikes will face affordability resistance.
Forward outlook
- Local home prices are declining (-3.0%/yr); year-one equity from $3k of loan paydown is wiped out by about $14k of value loss. Plan a longer hold.
- Prince George's County population projected at +18% by 2050 — long-run rental-demand tailwind backs the buy-and-hold thesis.
Negotiation context
- It's been on market 32 days — a 3% lower offer ($441k) is reasonable based on typical stale-listing flexibility.
- 10 sale attempts since 26y ago with the ask held roughly flat each time — persistent listings suggest the price (not the market) is what's stuck; bring a comps-based counter.
- Current owner paid $310k; 47% above their basis — modest negotiation headroom, anchor on the comps not their cost.
Risks & watch-outs
- Climate carrying-cost: moderate wind risk, 22% chance of damaging wind over 30y; extreme-heat days projected 7→16/yr by 2055 (HVAC capex compounding) — expect insurance premiums to compound above CPI over the hold.
Questions for the listing agent
- What do current leases actually rent for vs. the listed asking? Can we see a recent rent roll and the last 12 months of T-12 income?
- It's been on market 32 days. Have you received any prior offers? Is the seller open to a 23% concession, seller financing, or rate buy-down credit?
- What does the HOA fee cover, when was the last increase, and are there any pending special assessments or reserve-fund shortfalls?
- Is there a deadline driving the sale (1031 exchange, divorce, estate, relocation)? That informs how much negotiation room exists.
- Schools are D-rated, which usually means shorter tenancies and higher turnover. Who's the typical renter profile here, and what's been the actual vacancy rate?
- Crime grade is D in this area — have there been break-ins, vandalism, or insurance claims at this property in the last 3 years? What carrier currently insures it and at what premium?
- The area grade is low — what's the realistic commute time and amenity access for the typical tenant pool here? Any planned neighborhood developments (good or bad) we should know about?
- What's the average days-on-market for RENTAL listings here right now (not sales)? A rising rental-DOM trend means longer vacancies and softer asking-rent achievability than the comps imply.
- What's the recent tenant-quality profile in this submarket — average credit score on applications, eviction rate, late-payment / NSF rate, and stable-employment percentage? A property-management company in the area should have these aggregated.
- How much new for-sale + rental construction is in the pipeline within 1–3 miles? Heavy new supply typically softens prices + rents 12–24 months out; constrained supply supports both.
Investment metrics
- 1% rule
- 0.77% ✗
- Cap rate
- 5.57%
- Cash-on-cash
- -2.59%
- DSCR
- 0.88
- GRM
- 10.9
CMA / ARV
- ARV (on-the-fly)
- $430,260
- Comps found
- 9
Show comp detail 9 sales within ~0.75 mi
| Address | Dist | Beds/Ba | Sqft | Sold | Price | $/sf | Match |
|---|---|---|---|---|---|---|---|
| 11603 Butlers Branch Rd | 0.11mi | 4/3.0 (-1) | 1,216 (+0%) | 0mo | $392,000 | $322 | 89 |
| 5245 W Boniwood Turn | 0.14mi | 4/3.0 (-1) | 1,286 (+6%) | 9mo | $405,000 | $315 | 70 |
| 5903 Sylvia Ct | 0.52mi | 4/3.0 (-1) | 1,204 (-1%) | 1mo | $445,000 | $370 | 69 |
| 5342 W Boniwood Turn | 0.44mi | 4/3.0 (-1) | 1,216 (+0%) | 11mo | $450,000 | $370 | 65 |
| 5242 W Boniwood Turn W | 0.11mi | 4/3.0 (-1) | 1,276 (+5%) | 21mo | $445,000 | $349 | 64 |
| 6104 Brooke Jane Dr | 0.66mi | 5/3.0 | 1,212 (0%) | 10mo | $460,000 | $380 | 61 |
| 11829 Sylvia Dr | 0.59mi | 4/3.0 (-1) | 1,212 (0%) | 8mo | $429,900 | $355 | 60 |
| 11813 Sylvia Dr | 0.56mi | 4/3.0 (-1) | 1,196 (-1%) | 19mo | $460,000 | $385 | 51 |
| 11802 Thrift Rd | 0.54mi | 4/2.5 (-1) | 1,266 (+4%) | 13mo | $420,000 | $332 | 50 |
Match score weights: distance 35% · size 25% · config 20% · recency 20%. Top-matched comps best support the ARV.
Projected returns pro-forma
-3.0% appreciation · 3.0% rent growth · sell at horizon
- IRR
- -20.6%
- Equity multiple
- 0.28×
- Total profit
- $-91,234
- Equity at exit
- $67,842
- IRR
- -13.8%
- Equity multiple
- 0.20×
- Total profit
- $-102,036
- Equity at exit
- $39,340
Cash invested: $127,400 (down + closing). Projections, not guarantees.
Landlord ↔ Tenant lean methodology
- Overall (STATE)
- 27 Tenant-Leaning
- State Maryland
- 27 Tenant-Leaning · D+14
- County
- — inherits STATE
- City
- — inherits STATE
ZIP-level market 20735
- Active inventory
- 124
- Price-to-rent
- 10.9×
Monthly cashflow live
- Estimated rent
- $3,486 high interval (Pro) →
- Mortgage (P&I)
- −$2,386
- Tax from tax record
- −$384 /mo · $4,610/yr
- Insurance
- −$190
- HOA
- −$69
- Vacancy / Maint / Mgmt
- −$732
- Net cashflow
- $-275
Break-even live
Sensitivity live
| Price | -10% $-17 | -5% $-146 | +0% $-275 | +5% $-403 | +10% $-532 |
|---|---|---|---|---|---|
| Rent | -10% $-550 | -5% $-412 | +0% $-275 | +5% $-137 | +10% $1 |
| Rate | -1.0pp $-45 | -0.5pp $-159 | base $-275 | +0.5pp $-392 | +1.0pp $-512 |
UW: 25.0% down · 7.5% · 30yr · 1.5% tax · 5.0% vac · 8.0% maint · 8.0% mgmt
Financing live
Cash to close
- Down payment
- $113,750
- Closing costs
- $13,650
- Reserves months
- —
- Total cash needed
- —
Loan-product check · same deal, 3 products live
Conventional
25% down · 7.5% · 30yr
- Down + closing
- —
- Monthly P&I
- —
- Monthly cashflow
- —
- DSCR
- —
- Eligible?
- —
Personal DTI + credit; lowest rate.
DSCR
20% down · 8.5% · 30yr
- Down + closing
- —
- Monthly P&I
- —
- Monthly cashflow
- —
- DSCR
- —
- Eligible?
- —
No personal income docs; deal must DSCR.
Hard money
10% down · 12.0% · 12mo
- Down + closing
- —
- Monthly P&I
- —
- Monthly cashflow
- —
- DSCR
- —
- Eligible?
- —
Short-term bridge; refi at stabilization.
Rent comps 6 comps
| Address | Beds | Baths | Sqft | Rent | $/sqft | DOM | Units | Dist |
|---|---|---|---|---|---|---|---|---|
| 5539 E Boniwood Turn Clinton, MD | 4.0 | 3.5 | 1288 | $2,950 | $2.29 | 45d | 1 | 0.10mi |
| 5508 E Boniwood Turn Clinton, MD | 4.0 | 3.5 | 1320 | $2,600 | $1.97 | 14d | 1 | 0.14mi |
| 5558 E Boniwood Turn Clinton, MD | 4.0 | 3.5 | 1360 | $3,200 | $2.35 | 3d | 1 | 0.17mi |
| 11160 Tippett Rd Clinton, MD | 6.0 | 2.0 | 1419 | $3,500 | $2.47 | 26d | 1 | 0.67mi |
| 6004 Clinton Way Clinton, MD | 4.0 | 1.5 | 1028 | $2,850 | $2.77 | 45d | 1 | 0.79mi |
| 6907 Fulford St Clinton, MD | 4.0 | 3.0 | 1125 | $3,500 | $3.11 | 20d | 1 | 1.41mi |
HOA detail
- Monthly dues
- $69 · $828/yr
Listing history 43 events
-
2026-06-21days on market $455,000 Active 32 DOM
-
2026-06-18days on market $455,000 Active 29 DOM
-
2026-06-17days on market $455,000 Active 28 DOM
-
2026-06-16days on market $455,000 Active 27 DOM
-
2026-06-15days on market $455,000 Active 26 DOM
-
2026-06-13days on market $455,000 Active 24 DOM
-
2026-06-10days on market $455,000 Active 20 DOM
-
2026-06-08days on market $455,000 Active 19 DOM
-
2026-06-07days on market $455,000 Active 18 DOM
-
2026-06-04days on market $455,000 Active 15 DOM
-
2026-06-03days on market $455,000 Active 14 DOM
-
2026-06-02days on market $455,000 Active 13 DOM
-
2026-06-01days on market $455,000 Active 12 DOM
-
2026-05-31days on market $455,000 Active 11 DOM
-
2026-05-11historical
-
2026-04-08$460,000 Active
-
2026-04-08historical
-
2026-03-17status Active
-
2026-03-09historical Active Under Contract
-
2026-03-01status Active
-
2026-02-20historical Active Under Contract
-
2026-02-12$460,000 Active
-
2026-02-11historical
-
2026-01-05soldstatus $310,000
-
2025-12-05soldstatus $310,000 Closed
-
2025-11-10historical Active Under Contract
-
2025-10-31$350,000 Active
-
2025-10-26historical
-
2025-10-25status Active
-
2025-10-17historical Active Under Contract
-
2025-10-01price $400,000
-
2025-08-05price $425,000
-
2025-07-22price $430,000
-
2025-07-07$450,000 Active
-
2025-07-03historical
-
2002-02-22soldstatus $159,900
-
2002-01-15soldstatus $159,900
-
2001-12-22historical
-
2001-11-16$159,900
-
2000-11-09historical
-
2000-07-14
-
1995-04-26soldstatus $146,500
-
1986-06-24soldstatus $62,550
ⓘ Source: listings_history table (triggers on properties + properties_extension) + one-shot
backfill from property_details.listing_events for pre-trigger history.
Tax reassessment forecast MD · Partial reset (capped growth)
- Current annual tax
- $4,610 · $384/mo
- Projected year-2 tax
- $4,785 · $399/mo
- Expected delta
- +$175/yr (+$15/mo · 3.8%)
ⓘ Screening estimate from a state-policy table — verify with the county assessor before closing.
Climate risk First Street
- Flood 1/10 Low FEMA zone X (unshaded) · 0% chance over 30 yrs
- Wildfire 3/10 Moderate
- Heat 7/10 Severe 7 d/yr ≥103°F today · 16 d/yr by 30 yrs out
- Wind 5/10 Major 22% chance of damaging wind over 30 yrs
- Air quality 2/10 Low 1 unhealthy d/yr today · 2 by 30 yrs out
Nearby sold comps map
Loading sold comps map…
Walkable amenities ~0.75 mi
Loading nearby amenities…
Taxation est. · year 1
- Rental income
- $41,837
- − Mortgage interest
- −$25,487
- − Property taxes
- −$4,610
- − Insurance
- −$2,275
- − Repairs & maintenance
- −$3,347
- − Management
- −$3,347
- − HOA
- −$828
- − Depreciation
- −$13,236
- Taxable loss
- −$11,293
- Est. tax savings @ 24.0%
- +$2,710
- After-tax cash flow
- $-584/yr
For passive investors: Depreciation is non-cash, so a rental often shows a tax loss while cash-flowing — sheltering income. Rental losses are passive: they offset passive income freely, and up to $25,000/yr can offset ordinary (W-2) income if you actively participate and your MAGI is under $100k (phasing out to $0 by $150k); unused losses carry forward. On sale, claimed depreciation is recaptured at up to 25%, and gains may owe capital-gains tax (a 1031 exchange can defer both). Figures are a year-1 estimate at your 24.0% rate — not tax advice; consult a CPA.
Schools (NCES district)
- District
- Prince George'S County Public Schools
- NCES district ID
- 2400510
- Math proficiency
- 8% ▼ -11.00%
- Reading proficiency
- 24% ▼ -9.00%
- Median HH income
- $73,967
- Composite
- 16.82/100
- National rank
- #9151
- State rank
- #21 of 24 in MD
Livability — Clinton
- Score
- 63/100
- State rank
- #304
- US rank
- #15951
Category grades
Schools grade is shown separately in the Schools card above.
Census & demographics
- Census place
- Clinton, MD
- County
- Prince Georges County · 919,866 people
- City population
- 37,464
- Metro
- Washington-Arlington-Alexandria, DC-VA-MD-WV
- Population (ZIP)
- 37,464
- Household income
- $126,196
- Rent vs Own
- Severe rent burden
- 334.0
Population outlook (Prince George's County) Hauer SSP2
- Today (2025)
- 1,005,426 people
- By 2030
- 1,048,416 · +4.3%
- By 2040
- 1,123,425 · +11.7%
- By 2050
- 1,183,220 · +17.7%
- By 2075
- 1,306,202 · +29.9%
- By 2100
- 1,408,179 · +40.1%
Race, ethnicity, and origin ACS 2023
- Neighborhood character
- Predominantly Black (76%)
- Race & ethnicity
- Black 76% Hispanic / Latino 10% White 7% Two or more races 5% Asian 2%
- Hispanic origin (detail)
- Mexican 1%
- Foreign-born
- 13% · Canada, Vietnam
- Languages at home
- 86% English-only · Spanish 9% Tagalog/Filipino 1% French/Haitian/Cajun 1%
Political lean MEDSL · Prince George's
- 2024 margin
- Solid D (+75.2) · D 86.3% · R 11.2% · Other 2.5%
- 2008→2024 swing
- -3.3pp toward R · 2008: 78.5pp · 2024: 75.2pp
- All cycles
- 2024: D+75.2 2020: D+80.5 2016: D+81.0 2012: D+80.9 2008: D+78.5
Not yet ingested
- Civics
- —
Market trends
- HPI YoY
- ▼ -299.23%
- Current HPI
- 251.6263
- Rent YoY
- —
- Metro
- Washington-Arlington-Alexandria, DC-VA-MD-WV
- State GDP YoY
- ▲ 2.97%
- F500 in state
- 12
Industry mix (Fortune 500 HQ in MD)
| Industry | F500 HQs | Revenue |
|---|---|---|
| Aerospace / Defense | 1 | $71B |
|
||
| Utilities | 1 | $25B |
|
||
| Hotels | 1 | $24B |
|
||
| Consumer Goods | 1 | $7B |
|
||
| Real Estate | 1 | $6B |
|
||
| Chemicals | 1 | $2B |
|
||
Price history
+627.4% since first listed30 events — show timeline
- 2026-05-20 Listed $455,000 BRIGHT MLS
- 2026-05-11 Listing Removed — BRIGHT MLS
- 2026-04-08 Listing Removed — BRIGHT MLS
- 2026-04-08 Listed $460,000 BRIGHT MLS
- 2026-03-17 Relisted — BRIGHT MLS
- 2026-03-09 Contingent — BRIGHT MLS
- 2026-03-01 Relisted — BRIGHT MLS
- 2026-02-20 Contingent — BRIGHT MLS
- 2026-02-12 Listed $460,000 BRIGHT MLS
- 2026-02-11 Coming Soon — BRIGHT MLS
- 2026-01-05 Sold (Public Records) $310,000 Public Records
- 2025-12-05 Sold (MLS) $310,000 BRIGHT MLS
- 2025-11-10 Contingent — BRIGHT MLS
- 2025-10-31 Listed $350,000 BRIGHT MLS
- 2025-10-26 Listing Removed — BRIGHT MLS
- 2025-10-25 Relisted — BRIGHT MLS
- 2025-10-17 Contingent — BRIGHT MLS
- 2025-10-01 Price Changed $400,000 BRIGHT MLS
- 2025-08-05 Price Changed $425,000 BRIGHT MLS
- 2025-07-22 Price Changed $430,000 BRIGHT MLS
- 2025-07-07 Listed $450,000 BRIGHT MLS
- 2025-07-03 Coming Soon — BRIGHT MLS
- 2002-02-22 Sold (Public Records) $159,900 Public Records
- 2002-01-15 Sold (MLS) $159,900 MRIS
- 2001-12-22 Delisted — MRIS
- 2001-11-16 Listed $159,900 MRIS
- 2000-11-09 Delisted — MRIS
- 2000-07-14 Listed — MRIS
- 1995-04-26 Sold (Public Records) $146,500 Public Records
- 1986-06-24 Sold (Public Records) $62,550 Public Records
Property tax history
+5.6%/yrLatest (2025): $4,610 · +4.0% YoY. Source: county tax records.
Cash-flow waterfall
monthlySold comps — $/sqft
last 12 mo · ≤1 miLoading sold comps…