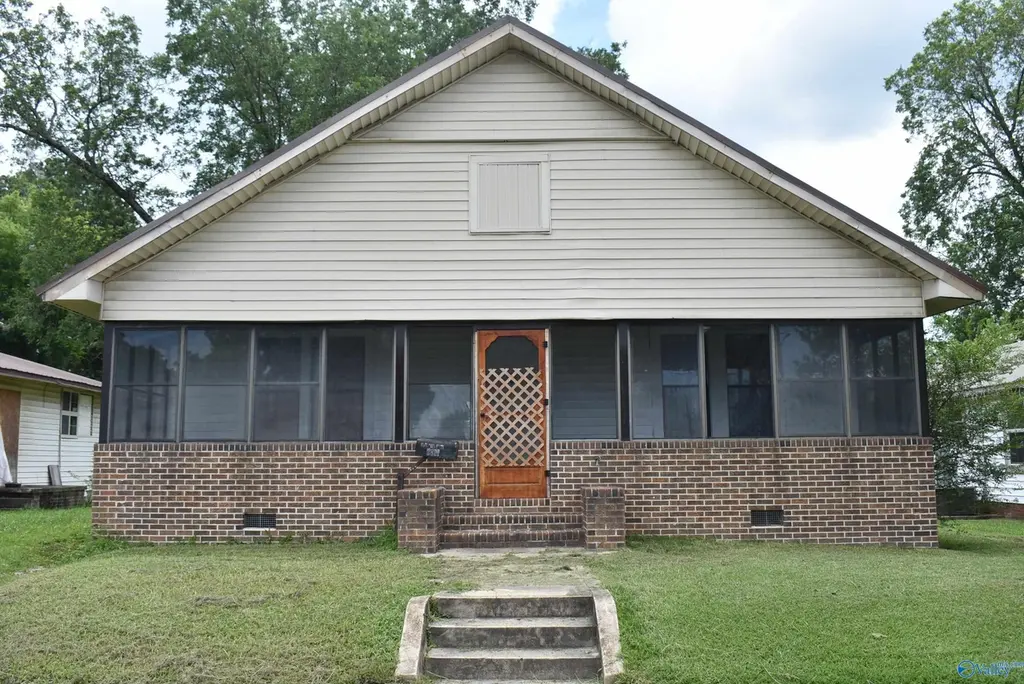
2821 Sansom Ave · Gadsden, AL
Flood risk 1/10 · Minimal
- FEMA flood zone
- X (unshaded)
- Chance of flooding over 30 yrs
- 0.0%
- Est. flood insurance / yr
- $507 – $1,088
Fire risk 4/10 · Minor
- Est. fire insurance / yr
- $916 – $1,700
Heat risk 6/10 · Moderate
- Hot days now (above 107°F)
- 7 days/yr
- Hot days in 30 yrs
- 20 days/yr
Wind risk 4/10 · Minor
- Chance of severe wind over 30 yrs
- 21.0%
Air-quality risk 2/10 · Minimal
- Unhealthy air days now
- 2 days/yr
- Unhealthy air days in 30 yrs
- 2 days/yr
Risk factors via First Street. Map © Google.
Why this score? — see what drove the F grade
The composite is a weighted blend of 9 inputs, each scored 0–100. Each bar is that input's sub-score; the figure is the points it added to the 100-point composite (weight × sub-score).
- Cash flow +14.1/30.0
- DSCR +4.3/10.0
- Livability +3.0/5.0
- 1% rule +2.9/10.0
- Rent growth +2.5/5.0
- Condition / age +2.5/5.0
- Schools +2.2/10.0
- ARV discount +0.8/15.0
- Appreciation +0.0/10.0
$94,900
🖨 Deal sheet 📄 Offer letter ✓ Due diligence
Listing remarks MLS
3 bedroom 2 bath home in quite neighborhood with large screened front porch, spacious back deck with fenced back yard. This home features 2 fireplaces with gas logs and a living room and den next to the kitchen, the master bath is huge with a walk in closet, plus a storage building out back.
Key facts
- Screened front porch
- Spacious back deck
- Fenced back yard
Tags
Neighborhood map
What this means for you Summary
Snapshot
- This is a 3-bed/2.0-bath single-family listed at $95k.
Deal economics
- At list price, monthly cash flow is $14 ($173/yr) — positive.
- The deal already cash-flows at list — no discount required.
- To meet the 1% rule (rent ≥ 1% of price), the offer needs to be $75k (21.0% below list).
- Recommended offer: $75k (21.0% below list) — sets the bar for 1% rule.
- Cap rate 6.5% vs local median 5.1% in Gadsden — meaningfully above typical; check what's discounted (condition, days-on-market, listing class) to confirm the premium yield is real.
Location & tenants
- Location reads 59/100 on livability (#335 in AL) — a working-class tenant base; expect higher turnover. Strengths: cost of living A+, housing A+; Watch: schools C-, crime F, amenities F.
- Gadsden City (urban): math 15% / reading 39% proficiency, ranked #87 of 129 in AL (top 67%) — low school quality limits family demand, transient renter base, plan for 1-2y turnover; 66% free/reduced lunch — lower-income household profile, screen leases tightly.
- Market conditions: 84 active listings in the ZIP; 1 comparable units currently listed for rent nearby; 119 units permitted in Etowah County in 2024 (0 in 5+ unit buildings).
Forward outlook
- Local home prices are declining (-3.0%/yr); year-one equity from $656 of loan paydown is wiped out by about $3k of value loss. Plan a longer hold.
- Etowah County population projected at -12% by 2050 — secular population decline; favor cash flow + early exit over multi-decade hold.
Negotiation context
- It's been on market 352 days — a 12% lower offer ($84k) is reasonable based on typical stale-listing flexibility.
Risks & watch-outs
- Watch-outs: built in 1930 — expect roof / HVAC / electrical / plumbing capex.
- Climate carrying-cost: extreme-heat days projected 7→20/yr by 2055 (HVAC capex compounding) — expect insurance premiums to compound above CPI over the hold.
Questions for the listing agent
- It's been on market 352 days. Have you received any prior offers? Is the seller open to a 21% concession, seller financing, or rate buy-down credit?
- Built in 1930 — when were the roof, HVAC, electrical panel, plumbing, and water heater last replaced?
- Why hasn't it sold? Are there any deal-killer items the seller is aware of (foundation, flood, title, zoning, code violations)?
- Is there a deadline driving the sale (1031 exchange, divorce, estate, relocation)? That informs how much negotiation room exists.
- Crime grade is F in this area — have there been break-ins, vandalism, or insurance claims at this property in the last 3 years? What carrier currently insures it and at what premium?
- The area grade is low — what's the realistic commute time and amenity access for the typical tenant pool here? Any planned neighborhood developments (good or bad) we should know about?
- What's the average days-on-market for RENTAL listings here right now (not sales)? A rising rental-DOM trend means longer vacancies and softer asking-rent achievability than the comps imply.
- What's the recent tenant-quality profile in this submarket — average credit score on applications, eviction rate, late-payment / NSF rate, and stable-employment percentage? A property-management company in the area should have these aggregated.
- How much new for-sale + rental construction is in the pipeline within 1–3 miles? Heavy new supply typically softens prices + rents 12–24 months out; constrained supply supports both.
Investment metrics
- 1% rule
- 0.79% ✗
- Cap rate
- 6.47%
- Cash-on-cash
- 0.65%
- DSCR
- 1.03
- GRM
- 10.5
CMA / ARV
- ARV (median comp)
- $82,660
- List price
- $94,900
- Delta
- 14.81%
- Verdict
- OVERPRICED
- Comps
- 20 within 1.0 mi
Show comp detail 10 sales within ~0.75 mi
| Address | Dist | Beds/Ba | Sqft | Sold | Price | $/sf | Match |
|---|---|---|---|---|---|---|---|
| 2908 W Meighan Blvd | 0.12mi | 3/1.0 | 1,628 (+4%) | 3mo | $55,000 | $34 | 82 |
| 14 Winona | 0.38mi | 3/2.0 | 1,500 (-4%) | 1mo | $20,000 | $13 | 74 |
| 3424 W Meighan Blvd | 0.47mi | 3/2.0 | 1,534 (-2%) | 2mo | $145,000 | $95 | 73 |
| 11 W Tuscaloosa Ave | 0.57mi | 3/2.0 | 1,571 (+0%) | 9mo | $73,000 | $46 | 66 |
| 3506 Western Ave | 0.59mi | 3/2.0 | 1,552 (-1%) | 14mo | $139,900 | $90 | 59 |
| 421 33rd St N | 0.35mi | 4/1.5 (+1) | 1,407 (-10%) | 5mo | $108,000 | $77 | 56 |
| 411 Vernon St | 0.52mi | 3/2.0 | 1,523 (-3%) | 21mo | $128,100 | $84 | 53 |
| 20 Dwight Ave | 0.61mi | 3/1.0 | 1,500 (-4%) | 20mo | $80,000 | $53 | 44 |
| 3204 Sansom Ave | 0.27mi | 4/2.0 (+1) | 1,800 (+15%) | 18mo | $189,000 | $105 | 43 |
| 3708 Roselawn Dr | 0.72mi | 3/1.5 | 1,775 (+13%) | 22mo | $180,000 | $101 | 25 |
Match score weights: distance 35% · size 25% · config 20% · recency 20%. Top-matched comps best support the ARV.
Projected returns pro-forma
-3.0% appreciation · 3.0% rent growth · sell at horizon
- IRR
- -15.3%
- Equity multiple
- 0.45×
- Total profit
- $-14,499
- Equity at exit
- $14,150
- IRR
- -6.8%
- Equity multiple
- 0.56×
- Total profit
- $-11,594
- Equity at exit
- $8,205
Cash invested: $26,572 (down + closing). Projections, not guarantees.
Landlord ↔ Tenant lean methodology
- Overall (STATE)
- 90 Strongly Landlord-Friendly
- State Alabama
- 90 Strongly Landlord-Friendly · R+15
- County
- — inherits STATE
- City
- — inherits STATE
ZIP-level market 35904
- Home prices YoY
- -17.1%
- Active inventory
- 84
- Price-to-rent
- 10.5×
Monthly cashflow live
- Estimated rent
- $750 medium interval (Pro) →
- Mortgage (P&I)
- −$498
- Tax from tax record
- −$41 /mo · $491/yr
- Insurance
- −$40
- HOA
- −$0
- Vacancy / Maint / Mgmt
- −$158
- Net cashflow
- $14
Break-even live
UW: 25.0% down · 7.5% · 30yr · 1.5% tax · 5.0% vac · 8.0% maint · 8.0% mgmt
Financing live
Cash to close
- Down payment
- $23,725
- Closing costs
- $2,847
- Reserves months
- —
- Total cash needed
- —
Loan-product check · same deal, 3 products live
Conventional
25% down · 7.5% · 30yr
- Down + closing
- —
- Monthly P&I
- —
- Monthly cashflow
- —
- DSCR
- —
- Eligible?
- —
Personal DTI + credit; lowest rate.
DSCR
20% down · 8.5% · 30yr
- Down + closing
- —
- Monthly P&I
- —
- Monthly cashflow
- —
- DSCR
- —
- Eligible?
- —
No personal income docs; deal must DSCR.
Hard money
10% down · 12.0% · 12mo
- Down + closing
- —
- Monthly P&I
- —
- Monthly cashflow
- —
- DSCR
- —
- Eligible?
- —
Short-term bridge; refi at stabilization.
Rent comps 1 comps
| Address | Beds | Baths | Sqft | Rent | $/sqft | DOM | Units | Dist |
|---|---|---|---|---|---|---|---|---|
| 2 W Tuscaloosa Ave Gadsden, AL | 2.0 | 1.0 | 1056 | $750 | $0.71 | 43d | 1 | 0.60mi |
Listing history 18 events
-
2026-06-19days on market $94,900 Active 352 DOM
-
2026-06-18days on market $94,900 Active 351 DOM
-
2026-06-17days on market $94,900 Active 350 DOM
-
2026-06-16days on market $94,900 Active 349 DOM
-
2026-06-15days on market $94,900 Active 348 DOM
-
2026-06-14days on market $94,900 Active 346 DOM
-
2026-06-12days on market $94,900 Active 345 DOM
-
2026-06-09days on market $94,900 Active 342 DOM
-
2026-06-08days on market $94,900 Active 341 DOM
-
2026-06-07days on market $94,900 Active 340 DOM
-
2026-06-07days on market $94,900 Active 339 DOM
-
2026-06-04days on market $94,900 Active 336 DOM
-
2026-06-02days on market $94,900 Active 335 DOM
-
2026-06-01days on market $94,900 Active 334 DOM
-
2026-05-31days on market $94,900 Active 333 DOM
-
2026-05-31days on market $94,900 Active 332 DOM
-
2025-08-04price $94,900 293-char remark
Show marketing remark (293 chars)
3 bedroom 2 bath home in quite neighborhood with large screened front porch, spacious back deck with fenced back yard. This home features 2 fireplaces with gas logs and a living room and den next to the kitchen, the master bath is huge with a walk in closet, plus a storage building out back.
-
2025-07-02$99,900 Active 293-char remark
Show marketing remark (293 chars)
3 bedroom 2 bath home in quite neighborhood with large screened front porch, spacious back deck with fenced back yard. This home features 2 fireplaces with gas logs and a living room and den next to the kitchen, the master bath is huge with a walk in closet, plus a storage building out back.
ⓘ Source: listings_history table (triggers on properties + properties_extension) + one-shot
backfill from property_details.listing_events for pre-trigger history.
Tax reassessment forecast AL · Resets to sale price
- Current annual tax
- $491 · $41/mo
- Projected year-2 tax
- $491 · $41/mo
- Expected delta
- $0/yr ($0/mo · 0.0%)
ⓘ Screening estimate from a state-policy table — verify with the county assessor before closing.
Climate risk First Street
- Flood 1/10 Low FEMA zone X (unshaded) · 0% chance over 30 yrs
- Wildfire 4/10 Moderate
- Heat 6/10 Major 7 d/yr ≥107°F today · 20 d/yr by 30 yrs out
- Wind 4/10 Moderate 21% chance of damaging wind over 30 yrs
- Air quality 2/10 Low 2 unhealthy d/yr today · 2 by 30 yrs out
Nearby sold comps map
Loading sold comps map…
Walkable amenities ~0.75 mi
Loading nearby amenities…
Taxation est. · year 1
- Rental income
- $9,000
- − Mortgage interest
- −$5,316
- − Property taxes
- −$491
- − Insurance
- −$474
- − Repairs & maintenance
- −$720
- − Management
- −$720
- − Depreciation
- −$2,761
- Taxable loss
- −$1,482
- Est. tax savings @ 24.0%
- +$356
- After-tax cash flow
- $528/yr
For passive investors: Depreciation is non-cash, so a rental often shows a tax loss while cash-flowing — sheltering income. Rental losses are passive: they offset passive income freely, and up to $25,000/yr can offset ordinary (W-2) income if you actively participate and your MAGI is under $100k (phasing out to $0 by $150k); unused losses carry forward. On sale, claimed depreciation is recaptured at up to 25%, and gains may owe capital-gains tax (a 1031 exchange can defer both). Figures are a year-1 estimate at your 24.0% rate — not tax advice; consult a CPA.
Schools (NCES district)
- District
- Gadsden City
- NCES district ID
- 0101620
- Math proficiency
- 15% ▼ -27.00%
- Reading proficiency
- 39% ▼ -2.00%
- Median HH income
- $29,099
- Composite
- 21.62/100
- National rank
- #8292
- State rank
- #87 of 129 in AL
Livability — Gadsden
- Score
- 59/100
- State rank
- #335
- US rank
- #20131
Category grades
Schools grade is shown separately in the Schools card above.
Census & demographics
- Census place
- Gadsden, AL
- Population (ZIP)
- 13,571
Population outlook (Etowah County) Hauer SSP2
- Today (2025)
- 100,500 people
- By 2030
- 98,488 · -2.0%
- By 2040
- 93,731 · -6.7%
- By 2050
- 88,681 · -11.8%
- By 2075
- 76,746 · -23.6%
- By 2100
- 65,373 · -35.0%
Race, ethnicity, and origin ACS 2023
- Neighborhood character
- Predominantly White (77%)
- Race & ethnicity
- White 77% Black 13% Hispanic / Latino 8% Two or more races 2%
- Hispanic origin (detail)
- Mexican 5%
- Common ancestry
- Slovak 3% Serbian 1% Iranian 1%
- Foreign-born
- 3% · Canada
- Languages at home
- 93% English-only · Spanish 6%
Political lean MEDSL · Etowah
- 2024 margin
- Solid R (+55.7) · D 21.8% · R 77.5%
- 2008→2024 swing
- -17.5pp toward R · 2008: -38.2pp · 2024: -55.7pp
- All cycles
- 2024: R+55.7 2020: R+50.2 2016: R+50.1 2012: R+38.4 2008: R+38.2
Not yet ingested
- Civics
- —
Market trends
- HPI YoY
- ▼ -44.06%
- Current HPI
- 213.3981
- Rent YoY
- —
- Metro
- —
- State GDP YoY
- ▲ 2.94%
- F500 in state
- 4
Industry mix (Fortune 500 HQ in AL)
| Industry | F500 HQs | Revenue |
|---|---|---|
| Financial Services | 1 | $8B |
|
||
| Healthcare | 1 | $5B |
|
||
Price history
-5.0% since first listed2 events — show timeline
- 2025-08-04 Price Changed $94,900 VMLS
- 2025-07-02 Listed $99,900 VMLS
Property tax history
+10.4%/yrLatest (2025): $491 · +0.0% YoY. Source: county tax records.
Cash-flow waterfall
monthlySold comps — $/sqft
last 12 mo · ≤1 miLoading sold comps…