 Multi-family
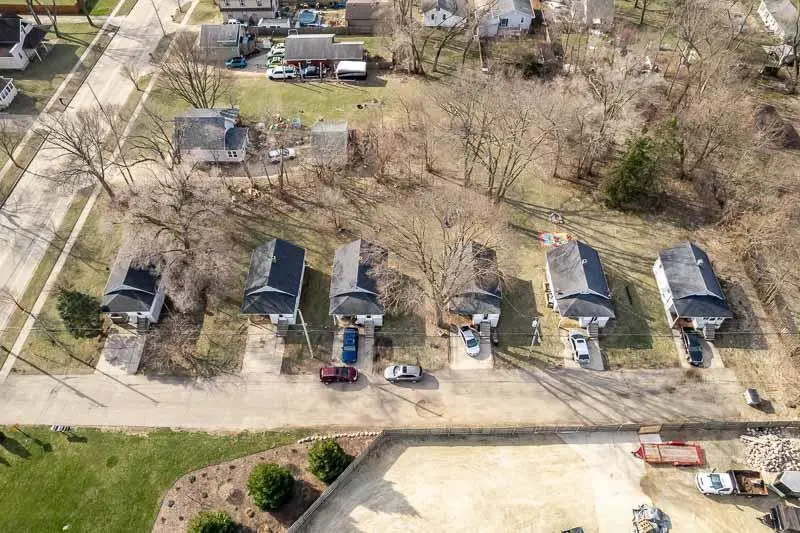
826-850 Sharpes Ct · Beloit, WI
Flood risk 1/10 · Minimal
- FEMA flood zone
- X (unshaded)
- Chance of flooding over 30 yrs
- 0.0%
- Est. flood insurance / yr
- $473 – $860
Fire risk 1/10 · Minimal
- Est. fire insurance / yr
- $636 – $1,182
Heat risk 2/10 · Minimal
- Hot days now (above 102°F)
- 7 days/yr
- Hot days in 30 yrs
- 14 days/yr
Wind risk 2/10 · Minimal
- Chance of severe wind over 30 yrs
- —
Air-quality risk 3/10 · Minor
- Unhealthy air days now
- 2 days/yr
- Unhealthy air days in 30 yrs
- 3 days/yr
Risk factors via First Street. Map © Google.
Why this score? — see what drove the B- grade
The composite is a weighted blend of 9 inputs, each scored 0–100. Each bar is that input's sub-score; the figure is the points it added to the 100-point composite (weight × sub-score).
- Cash flow +30.0/30.0
- DSCR +10.0/10.0
- 1% rule +9.8/10.0
- ARV discount +7.5/15.0
- Rent growth +4.0/5.0
- Livability +3.5/5.0
- Condition / age +2.0/5.0
- Schools +0.9/10.0
- Appreciation +0.0/10.0
$499,000
🖨 Deal sheet (PDF) 📄 Offer letter ✓ Due diligence
Multi-family units
County records classify this as Multi-Family (5+ Unit). Listing-text estimate: 1 unit. estimate disagrees with records
5+ unit building — per-unit beds/baths from public records are typically unavailable; the breakdown below (if shown) is an estimate from the listing text.
Listing remarks
Unique opportunity with six properties on one parcel! Minimal expenses, great income!! Most units have been updated within the last 3 years. All units have a cute interior! Tenant pays all utilities. Measurements are estimates, buyer to confirm if important. More photos to come. Owner financing may be available.
Key facts
- 0.77 acre lot
- Parking
- Built 1947
Property features AI
Finance
- Financial info: Improvement value reported (not included here as financial detail); Seller owns appliances included with sale; Tenant property excluded from inclusions
Exterior
- Parking: 1 parking space (overall)
- Utilities: Municipal water; Municipal sewer; Natural gas
- Home design: Multi-family property; 0.77-acre lot
- Construction: Year built information from assessor/public record (year not specified)
- Exterior features: Vinyl siding; Aluminum/steel siding; Wood siding; Zoned A-Res
Interior
- Kitchen: Appliances owned by seller included (general — specific appliances not detailed)
- Bedrooms: Each unit is a 1-bedroom (units 1–4 listed; building has 6 units)
- Bathrooms: Each listed unit has 1 full bathroom (no half baths listed for units 1–4)
- Heating & cooling: Forced-air heating; Natural gas fuel
- Interior features: Partial basement; Six-unit building
- Laundry & utility: No specific laundry details provided
Neighborhood map
What this means for you Summary
Snapshot
- This is a multifamily listed at $499k. Condition is rated fair.
Deal economics
- At list price, monthly cash flow is $2k ($29k/yr) — positive.
- The deal already cash-flows at list — no discount required.
- Meets the 1% rule at list price ($7k rent vs $499k).
- Recommended offer: $469k (6.0% below list) — sets the bar for market timing.
- Cap rate 12.1% vs local median 3.5% in Beloit — top-decile yield for the area; either an underpriced asset or a hidden risk that comps aren't pricing in. Stress-test before assuming the spread holds.
Location & tenants
- Location reads 70/100 on livability (#283 in WI) — a middle-class / working-renter tenant base. Strengths: cost of living A+, housing A+, health & safety A+; Watch: crime D, schools F, amenities F.
- Beloit School District (urban): math 8% / reading 13% proficiency, ranked #339 of 342 in WI (top 99%) — low school quality limits family demand, transient renter base, plan for 1-2y turnover; 70% free/reduced lunch — lower-income household profile, screen leases tightly.
- Market conditions: Rents rising fast (+6.0%/yr); 202 active listings in the ZIP; 8 comparable units currently listed for rent nearby; rentals at typical pace (median 14d on market — plan ~3-4 weeks tenant-placement turnaround); 629 units permitted in Rock County in 2024 (263 in 5+ unit buildings).
- At $7,396/mo this rent would consume 132% of the median local household income ($67k/yr) (locally 1341% of renters already pay >50% of income on rent) — very limited rent-growth headroom before tenants either downsize or default.
Forward outlook
- Local home prices are declining (-3.0%/yr); year-one equity from $3k of loan paydown is wiped out by about $15k of value loss. Plan a longer hold.
- Rock County population projected to shrink 7% by 2050 — rents likely to lag national; underwrite the cash flow, not the appreciation.
- At projected returns (-3.0% appreciation + 6.0% rent growth), your $140k cash investment doubles in ~6 years — after that, you're playing with house money.
Negotiation context
- It's been on market 66 days — a 6% lower offer ($469k) is reasonable based on typical stale-listing flexibility.
- 3 sale attempts with the ask held roughly flat each time — persistent listings suggest the price (not the market) is what's stuck; bring a comps-based counter.
Risks & watch-outs
- Watch-outs: built in 1947 — expect roof / HVAC / electrical / plumbing capex.
Questions for the listing agent
- It's been on market 66 days. Have you received any prior offers? Is the seller open to a 6% concession, seller financing, or rate buy-down credit?
- Have any recent inspections been done? Can we get a copy of the seller's disclosures and any deferred-maintenance estimates?
- Built in 1947 — when were the roof, HVAC, electrical panel, plumbing, and water heater last replaced?
- Why hasn't it sold? Are there any deal-killer items the seller is aware of (foundation, flood, title, zoning, code violations)?
- Is there a deadline driving the sale (1031 exchange, divorce, estate, relocation)? That informs how much negotiation room exists.
- Schools are F-rated, which usually means shorter tenancies and higher turnover. Who's the typical renter profile here, and what's been the actual vacancy rate?
- Crime grade is D in this area — have there been break-ins, vandalism, or insurance claims at this property in the last 3 years? What carrier currently insures it and at what premium?
- What's the average days-on-market for RENTAL listings here right now (not sales)? A rising rental-DOM trend means longer vacancies and softer asking-rent achievability than the comps imply.
- What's the recent tenant-quality profile in this submarket — average credit score on applications, eviction rate, late-payment / NSF rate, and stable-employment percentage? A property-management company in the area should have these aggregated.
- How much new apartment / multifamily construction is in the pipeline within 1–3 miles? Heavy new supply (>2% of stock underway) typically softens rents 12–24 months out; light construction supports rent growth.
Investment metrics
- 1% rule
- 1.48% ✓
- Cap rate
- 12.05%
- Cash-on-cash
- 20.56%
- DSCR
- 1.91
- GRM
- 5.6
CMA / ARV
- ARV (median comp)
- $259,713
- List price
- $499,000
- Delta
- 92.13%
- Verdict
- OVERPRICED
- Comps
- 7 within 2.0 mi
Show comp detail 6 sales within ~0.75 mi
| Address | Dist | Beds/Ba | Sqft | Sold | Price | $/sf | Match |
|---|---|---|---|---|---|---|---|
| 1919 S Wisconsin Ave | 0.42mi | 6/2.0 | — | 6mo | $185,000 | — | 63 |
| 1986-1990 S Mound Ave | 0.27mi | 3/2.0 | — | 16mo | $164,000 | — | 62 |
| 1002-1104 E Elmwood Ave | 0.65mi | —/— | — | 4mo | $1,007,500 | — | 54 |
| 1901 Wisconsin Ave | 0.45mi | 4/1.0 | — | 20mo | $140,000 | — | 50 |
| 1702-1704 Wisconsin Ave | 0.74mi | 6/2.0 | — | 12mo | $200,000 | — | 43 |
| 1771 Harrison Ave | 0.61mi | 6/3.0 | — | 20mo | $220,000 | — | 42 |
Match score weights: distance 35% · size 25% · config 20% · recency 20%. Top-matched comps best support the ARV.
Projected returns pro-forma
-3.0% appreciation · 6.05% rent growth · sell at horizon
- IRR
- 16.3%
- Equity multiple
- 1.68×
- Total profit
- $95,140
- Equity at exit
- $74,403
- IRR
- 27.0%
- Equity multiple
- 3.73×
- Total profit
- $381,851
- Equity at exit
- $43,144
Cash invested: $139,720 (down + closing). Projections, not guarantees.
Landlord ↔ Tenant lean methodology
- Overall (STATE)
- 73 Landlord-Friendly
- State Wisconsin
- 73 Landlord-Friendly · R+2
- County
- — inherits STATE
- City
- — inherits STATE
ZIP-level market 53511
- Home prices YoY
- -26.9%
- Rents YoY
- 6.0%
- Active inventory
- 202
- Price-to-rent
- 33.7×
Monthly cashflow live
- Estimated rent
- $7,396 high interval (Pro) →
- Mortgage (P&I)
- −$2,617
- Tax est. 1.5%
- −$624 /mo · $7,485/yr
- Insurance
- −$208
- HOA
- −$0
- Vacancy / Maint / Mgmt
- −$1,553
- Net cashflow
- $2,394
Break-even live
Sensitivity live
| Price | -10% $2,739 | -5% $2,567 | +0% $2,394 | +5% $2,222 | +10% $2,050 |
|---|---|---|---|---|---|
| Rent | -10% $1,810 | -5% $2,102 | +0% $2,394 | +5% $2,687 | +10% $2,979 |
| Rate | -1.0pp $2,646 | -0.5pp $2,521 | base $2,394 | +0.5pp $2,265 | +1.0pp $2,134 |
6-unit breakdown (identical units grouped — click to expand)
| Units | Beds | Baths | Est. rent |
|---|---|---|---|
| 6× units | 3 | 1 | $7,398 |
| #1 | 3 | 1 | $1,233 |
| #2 | 3 | 1 | $1,233 |
| #3 | 3 | 1 | $1,233 |
| #4 | 3 | 1 | $1,233 |
| #5 | 3 | 1 | $1,233 |
| #6 | 3 | 1 | $1,233 |
| Total (6 units) | $7,396 | ||
UW: 25.0% down · 7.5% · 30yr · 1.5% tax · 5.0% vac · 8.0% maint · 8.0% mgmt
Financing live
Cash to close
- Down payment
- $124,750
- Closing costs
- $14,970
- Reserves months
- —
- Total cash needed
- —
Loan-product check · same deal, 3 products live
Conventional
25% down · 7.5% · 30yr
- Down + closing
- —
- Monthly P&I
- —
- Monthly cashflow
- —
- DSCR
- —
- Eligible?
- —
Personal DTI + credit; lowest rate.
DSCR
20% down · 8.5% · 30yr
- Down + closing
- —
- Monthly P&I
- —
- Monthly cashflow
- —
- DSCR
- —
- Eligible?
- —
No personal income docs; deal must DSCR.
Hard money
10% down · 12.0% · 12mo
- Down + closing
- —
- Monthly P&I
- —
- Monthly cashflow
- —
- DSCR
- —
- Eligible?
- —
Short-term bridge; refi at stabilization.
Rent comps 8 comps
| Address | Beds | Baths | Sqft | Rent | $/sqft | DOM | Units | Dist |
|---|---|---|---|---|---|---|---|---|
| 1851 Cranston Rd Unit 1851-206 Beloit, WI | 2.0 | 1.0 | — | $985 | — | 44d | 1 | 0.68mi |
| 206 Carpenter St Unit 3 Beloit, WI | 2.0 | 1.0 | 1400 | $1,000 | $0.71 | 14d | 1 | 0.90mi |
| 2612 Robinson Dr Unit 2606-3 Beloit, WI | 2.0 | 1.0 | — | $1,125 | — | 22d | 1 | 0.91mi |
| 205 Birch Ave Unit 2 Beloit, WI | 2.0 | 1.0 | 1288 | $1,000 | $0.78 | 14d | 1 | 0.92mi |
| 2080 Shopiere Rd Beloit, WI | 2.0 | 1.0 | 1200 | $1,300 | $1.08 | 44d | 1 | 1.04mi |
| 1850 Huebbe Pkwy Unit RB-225 Beloit, WI | 2.0 | 1.0 | 852 | $1,000 | $1.17 | 14d | 1 | 1.41mi |
| 1850 Huebbe Pkwy Unit RB-308 Beloit, WI | 1.0 | 1.0 | 645 | $900 | $1.40 | 14d | 1 | 1.41mi |
| 532 Lawton Ave Beloit, WI | 2.0 | 1.0 | 872 | $1,220 | $1.40 | 14d | 5 | 1.47mi |
Listing history 8 events
-
2026-05-31days on market $499,000 Active 66 DOM
-
2026-05-30days on market $499,000 Active 65 DOM
-
2026-03-26$499,000 Active
-
2025-08-09historical $800
-
2025-07-05price $800
-
2025-06-10$850
-
2025-06-09historical $850
-
2025-06-09$850
ⓘ Source: listings_history table (triggers on properties + properties_extension) + one-shot
backfill from property_details.listing_events for pre-trigger history.
Climate risk First Street
- Flood 1/10 Low FEMA zone X (unshaded) · 0% chance over 30 yrs
- Wildfire 1/10 Low
- Heat 2/10 Low 7 d/yr ≥102°F today · 14 d/yr by 30 yrs out
- Wind 2/10 Low
- Air quality 3/10 Moderate 2 unhealthy d/yr today · 3 by 30 yrs out
Nearby sold comps map
Loading sold comps map…
Walkable amenities ~0.75 mi
Loading nearby amenities…
Taxation est. · year 1
- Rental income
- $88,752
- − Mortgage interest
- −$27,952
- − Property taxes
- −$7,485
- − Insurance
- −$2,495
- − Repairs & maintenance
- −$7,100
- − Management
- −$7,100
- − Depreciation
- −$14,516
- Taxable income
- $22,104
- Est. tax owed @ 24.0%
- −$5,305
- After-tax cash flow
- $23,428/yr
For passive investors: Depreciation is non-cash, so a rental often shows a tax loss while cash-flowing — sheltering income. Rental losses are passive: they offset passive income freely, and up to $25,000/yr can offset ordinary (W-2) income if you actively participate and your MAGI is under $100k (phasing out to $0 by $150k); unused losses carry forward. On sale, claimed depreciation is recaptured at up to 25%, and gains may owe capital-gains tax (a 1031 exchange can defer both). Figures are a year-1 estimate at your 24.0% rate — not tax advice; consult a CPA.
Condition & rehab AI · 12 photos
This multi-family property requires significant repairs and maintenance, including landscaping, exterior siding, and interior updates. While it has potential, the current condition is fair and would benefit from substantial investment to increase its resale and rental value.
Repairs flagged
- Major landscaping — Significant landscaping and yard work needed.
- Major exterior siding — Significant wear and tear on exterior siding.
- Major interior updates — Based on exterior condition, interior likely requires significant updates.
- Major flooring — Based on exterior condition, flooring likely in poor condition and in need of updates.
- Major system updates — Based on exterior condition, systems likely in need of updates.
Value-add opportunities
- Both landscaping and yard work — Improves curb appeal and enhances property value.
- Both exterior siding and foundation repairs — Enhances property value and improves curb appeal.
- Both interior updates — Improves living conditions and enhances property value.
- Both flooring replacement — Enhances living conditions and improves property value.
- Both system updates — Improves property functionality and enhances property value.
Renovation cost estimate screening
| Repair item | Severity | Est. cost |
|---|---|---|
| landscaping · Significant landscaping and yard work needed. | Major | $15,000–50,000 |
| exterior siding · Significant wear and tear on exterior siding. | Major | $15,000–50,000 |
| interior updates · Based on exterior condition, interior likely requires significant updates. | Major | $15,000–50,000 |
| flooring · Based on exterior condition, flooring likely in poor condition and in need of updates. | Major | $15,000–50,000 |
| system updates · Based on exterior condition, systems likely in need of updates. | Major | $15,000–50,000 |
| Total estimated repair cost · 5 items | $75,000–250,000 |
Value-add ROI direction
- Both landscaping and yard work — Improves curb appeal and enhances property value. ↑
- Both exterior siding and foundation repairs — Enhances property value and improves curb appeal. ↑
- Both interior updates — Improves living conditions and enhances property value. ↑
- Both flooring replacement — Enhances living conditions and improves property value. ↑
- Both system updates — Improves property functionality and enhances property value. ↑
ⓘ Cost ranges are severity-bucket heuristics (US national rule-of-thumb). Get contractor quotes + a written scope before underwriting a rehab budget.
Schools (NCES district)
- District
- Beloit School District
- NCES district ID
- 5501050
- Math proficiency
- 8% ▼ -10.00%
- Reading proficiency
- 13% ▼ -5.00%
- Median HH income
- $37,328
- Composite
- 8.81/100
- National rank
- #9890
- State rank
- #339 of 342 in WI
Livability — Beloit
- Score
- 70/100
- State rank
- #283
- US rank
- #7336
Category grades
Schools grade is shown separately in the Schools card above.
Census & demographics
- County
- Rock County · 135,428 people
- City population
- 48,701
- Metro
- Janesville-Beloit, WI
- Population (ZIP)
- 48,701
- Household income
- $67,067
- Rent vs Own
- Severe rent burden
- 1341.0
Population outlook (Rock County) Hauer SSP2
- Today (2025)
- 163,403 people
- By 2030
- 162,815 · -0.4%
- By 2040
- 158,655 · -2.9%
- By 2050
- 151,235 · -7.4%
- By 2075
- 131,901 · -19.3%
- By 2100
- 108,665 · -33.5%
Race, ethnicity, and origin ACS 2023
- Neighborhood character
- Majority White (64%)
- Race & ethnicity
- White 64% Hispanic / Latino 19% Two or more races 14% Black 11% Asian 1%
- Hispanic origin (detail)
- Mexican 15% Dominican 1%
- Common ancestry
- Portuguese 8% Romanian 3% Lithuanian 2%
- Foreign-born
- 9% · Canada
- Languages at home
- 85% English-only · Spanish 14%
Political lean MEDSL · Rock
- 2024 margin
- Lean D (+7.3) · D 52.9% · R 45.6% · Other 1.4%
- 2008→2024 swing
- -22.0pp toward R · 2008: 29.3pp · 2024: 7.3pp
- All cycles
- 2024: D+7.3 2020: D+11.2 2016: D+10.5 2012: D+23.2 2008: D+29.3
Not yet ingested
- Civics
- —
Market trends
- HPI YoY
- ▼ -115.19%
- Current HPI
- 312.6591
- Rent YoY
- ▲ 6.05%
- Metro
- Janesville-Beloit, WI
- State GDP YoY
- ▲ 2.10%
- F500 in state
- 20
Industry mix (Fortune 500 HQ in WI)
| Industry | F500 HQs | Revenue |
|---|---|---|
| Industrial Machinery | 4 | $23B |
|
||
| Industrial Technology | 2 | $36B |
|
||
| Insurance | 1 | $36B |
|
||
| Professional Services | 1 | $19B |
|
||
| Utilities | 1 | $9B |
|
||
| Consumer Goods | 1 | $3B |
|
||
Price history
6 events — show timeline
- 2026-03-26 Listed $499,000 SCWMLS
- 2025-08-09 Rental Removed $800 APPFOLIO
- 2025-07-05 Price Changed $800 APPFOLIO
- 2025-06-10 Listed for Rent $850 APPFOLIO
- 2025-06-09 Rental Removed $850 SHOWMOJO
- 2025-06-09 Listed for Rent $850 SHOWMOJO
Cash-flow waterfall
monthlySold comps — $/sqft
last 12 mo · ≤1 miLoading sold comps…