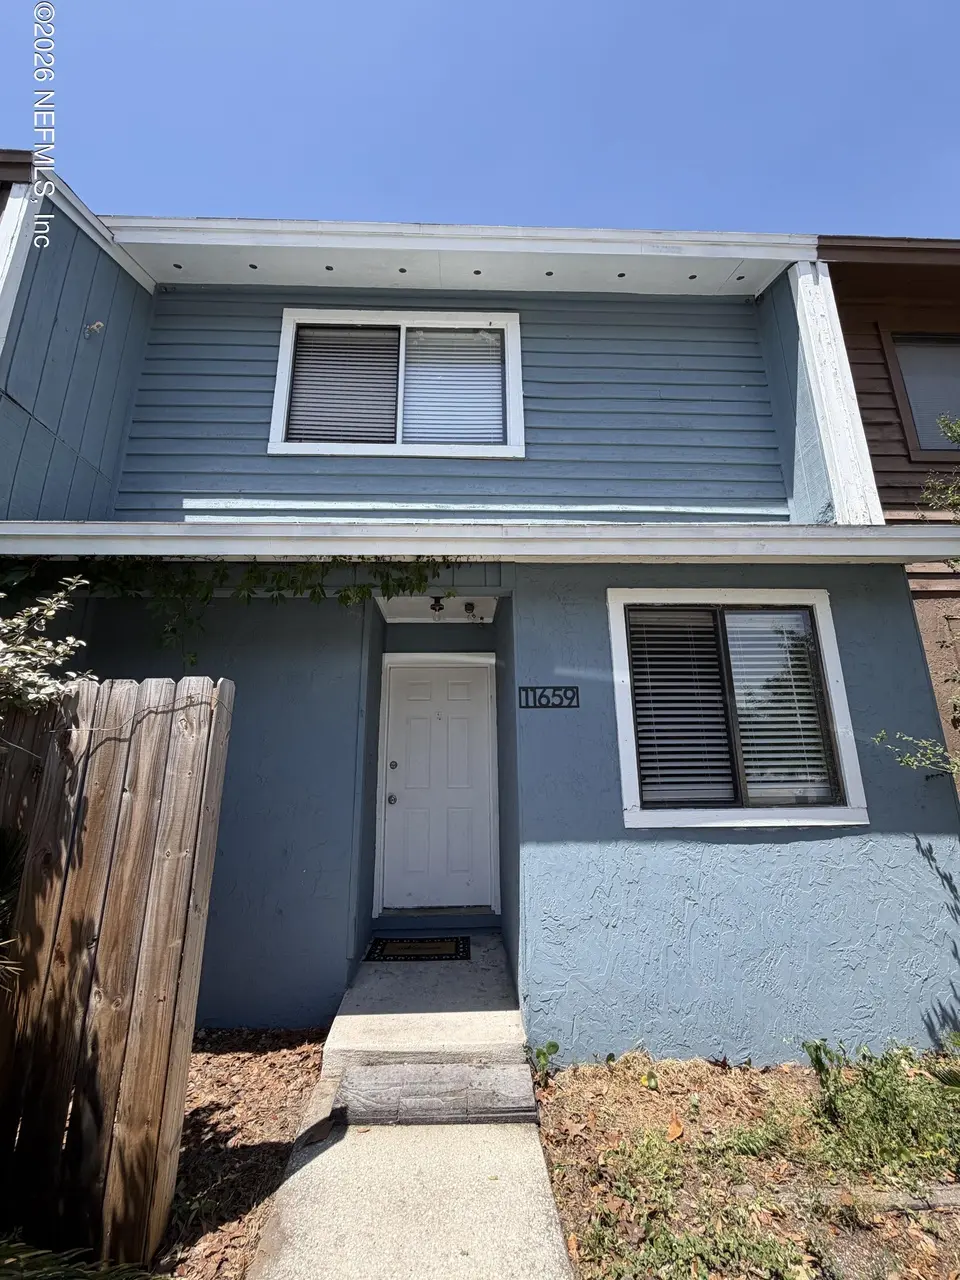
11659 Dunes Way Dr N · Jacksonville, FL
Flood risk 1/10 · Minimal
- FEMA flood zone
- X (unshaded)
- Chance of flooding over 30 yrs
- 0.0%
- Est. flood insurance / yr
- $507 – $1,088
Fire risk 4/10 · Minor
- Est. fire insurance / yr
- $947 – $1,759
Heat risk 10/10 · Severe
- Hot days now (above 105°F)
- 7 days/yr
- Hot days in 30 yrs
- 22 days/yr
Wind risk 9/10 · Severe
- Chance of severe wind over 30 yrs
- 99.0%
Air-quality risk 4/10 · Minor
- Unhealthy air days now
- 5 days/yr
- Unhealthy air days in 30 yrs
- 5 days/yr
Risk factors via First Street. Map © Google.
Why this score? — see what drove the B- grade
The composite is a weighted blend of 9 inputs, each scored 0–100. Each bar is that input's sub-score; the figure is the points it added to the 100-point composite (weight × sub-score).
- Cash flow +24.2/30.0
- ARV discount +15.0/15.0
- DSCR +7.8/10.0
- 1% rule +6.7/10.0
- Livability +4.2/5.0
- Schools +3.9/10.0
- Condition / age +2.5/5.0
- Rent growth +2.1/5.0
- Appreciation +0.0/10.0
$157,000
🖨 Deal sheet 📄 Offer letter ✓ Due diligence
Listing remarks
Affordable opportunity in a great Jacksonville location! This townhome has been well maintained and offers solid bones, with the potential to make it your own. It only needs light cosmetic updates to truly shine. Located in a desirable area with no HOA, this property is just a short drive to Jacksonville Beach, shopping, dining, and major roadways. Whether you're a first-time buyer, investor, or looking for a low-maintenance property in a convenient location, this home offers excellent value and upside potential.
Key facts
- Convenient location
- No hoa
- Built 1986
Tags
Property features AI
Finance
- Other: Unfurnished
- HOA & community: Not a senior community
Exterior
- Parking: Parking lot
- Utilities: Public sewer; Electricity connected; Sewer connected; Water connected
- Home design: Townhouse; Two stories; Attached property; Residential single-family use
- Exterior features: Back yard fencing
Interior
- Kitchen: Convection oven; Dishwasher; Microwave; Refrigerator
- Bedrooms: 2 bedrooms
- Flooring: Carpet; Laminate
- Bathrooms: 2 full bathrooms
- Heating & cooling: Central heating; Central air
- Interior features: Breakfast bar
- Laundry & utility: Washer; Dryer; Electric water heater
Neighborhood map
What this means for you Summary
Snapshot
- This is a 2-bed/3.0-bath townhouse listed at $157k.
Deal economics
- At list price, monthly cash flow is $312 ($4k/yr) — positive.
- The deal already cash-flows at list — no discount required.
- Meets the 1% rule at list price ($2k rent vs $157k).
- Recommended offer: $152k (3.0% below list) — sets the bar for market timing.
- Cap rate 8.7% vs local median 4.0% in Jacksonville — top-decile yield for the area; either an underpriced asset or a hidden risk that comps aren't pricing in. Stress-test before assuming the spread holds.
Location & tenants
- Location reads 83/100 on livability (#50 in FL, #911 nationally) — a professional / high-income tenant draw. Strengths: amenities A+, commute A+, housing A+.
- Duval (urban): math 46% / reading 45% proficiency, ranked #48 of 73 in FL (top 66%) — families likely to look elsewhere, expect single-tenant / working-renter base with shorter leases.
- Market conditions: Rents soft (-1.4%/yr); 222 active listings in the ZIP; 13 comparable units currently listed for rent nearby; rentals leasing fast (median 14d on market — plan ~1-2 weeks tenant-placement turnaround); solid renter incomes; 6,503 units permitted in Duval County in 2024 (1,131 in 5+ unit buildings).
Forward outlook
- Local home prices are declining (-3.0%/yr); year-one equity from $1k of loan paydown is wiped out by about $5k of value loss. Plan a longer hold.
- Duval County population projected at +19% by 2050 — long-run rental-demand tailwind backs the buy-and-hold thesis.
Negotiation context
- It's been on market 41 days — a 3% lower offer ($152k) is reasonable based on typical stale-listing flexibility.
- Current owner paid $54k; list at $157k implies a 190% gain — meaningful room to come down on a strong offer.
Risks & watch-outs
- Climate carrying-cost: severe wind risk, 99% chance of damaging wind over 30y; extreme-heat days projected 7→22/yr by 2055 (HVAC capex compounding) — expect insurance premiums to compound above CPI over the hold.
Questions for the listing agent
- It's been on market 41 days. Have you received any prior offers? Is the seller open to a 3% concession, seller financing, or rate buy-down credit?
- Is there a deadline driving the sale (1031 exchange, divorce, estate, relocation)? That informs how much negotiation room exists.
- Schools are B-rated — typically a magnet for longer-tenancy family renters. What's the average tenant stay here, and is there a school-zone premium baked into asking?
- What's the average days-on-market for RENTAL listings here right now (not sales)? A rising rental-DOM trend means longer vacancies and softer asking-rent achievability than the comps imply.
- What's the recent tenant-quality profile in this submarket — average credit score on applications, eviction rate, late-payment / NSF rate, and stable-employment percentage? A property-management company in the area should have these aggregated.
- How much new for-sale + rental construction is in the pipeline within 1–3 miles? Heavy new supply typically softens prices + rents 12–24 months out; constrained supply supports both.
Investment metrics
- 1% rule
- 1.17% ✓
- Cap rate
- 8.68%
- Cash-on-cash
- 8.52%
- DSCR
- 1.38
- GRM
- 7.1
CMA / ARV
- ARV (on-the-fly)
- $216,776
- Comps found
- 12
Show comp detail 12 sales within ~0.75 mi
| Address | Dist | Beds/Ba | Sqft | Sold | Price | $/sf | Match |
|---|---|---|---|---|---|---|---|
| 11651 Dunes Way Dr N | 0.01mi | 3/3.0 (+1) | 1,344 (-2%) | 5mo | $198,000 | $147 | 87 |
| 2104 Dunes Way Dr W | 0.16mi | 2/2.5 | 1,372 (0%) | 5mo | $160,000 | $117 | 86 |
| 12763 Ashbrook Cir W | 0.19mi | 2/2.0 | 1,345 (-2%) | 3mo | $220,000 | $164 | 81 |
| 11623 McCormick Rd | 0.05mi | 2/2.5 | 1,282 (-7%) | 6mo | $218,000 | $170 | 80 |
| 11870 Ashbrook Cir N | 0.25mi | 2/2.5 | 1,258 (-8%) | 1mo | $185,000 | $147 | 72 |
| 11322 Derringer Cir S | 0.34mi | 3/2.0 (+1) | 1,342 (-2%) | 3mo | $235,000 | $175 | 69 |
| 11671 Tanager Dr | 0.67mi | 3/2.5 (+1) | 1,404 (+2%) | 2mo | $142,500 | $101 | 56 |
| 3015 Cobblewood Ln E | 0.67mi | 3/2.5 (+1) | 1,322 (-4%) | 5mo | $225,000 | $170 | 51 |
| 11360 White Bay Ln | 0.51mi | 3/2.5 (+1) | 1,224 (-11%) | 2mo | $135,000 | $110 | 50 |
| 11712 Ft Caroline Lakes Ct | 0.65mi | 3/2.0 (+1) | 1,467 (+7%) | 5mo | $232,000 | $158 | 45 |
| 11371 Blue Teal Ct | 0.72mi | 3/2.0 (+1) | 1,453 (+6%) | 5mo | $255,000 | $175 | 43 |
| 2190 Monument Rd #103 | 0.48mi | 3/2.5 (+1) | 1,573 (+15%) | 6mo | $225,000 | $143 | 41 |
Match score weights: distance 35% · size 25% · config 20% · recency 20%. Top-matched comps best support the ARV.
Projected returns pro-forma
-3.0% appreciation · 0.0% rent growth · sell at horizon
- IRR
- -6.9%
- Equity multiple
- 0.75×
- Total profit
- $-10,875
- Equity at exit
- $23,409
- IRR
- -1.7%
- Equity multiple
- 0.90×
- Total profit
- $-4,402
- Equity at exit
- $13,574
Cash invested: $43,960 (down + closing). Projections, not guarantees.
Landlord ↔ Tenant lean methodology
- Overall (STATE)
- 87 Strongly Landlord-Friendly
- State Florida
- 87 Strongly Landlord-Friendly · R+3
- County
- — inherits STATE
- City
- — inherits STATE
ZIP-level market 32225
- Rents YoY
- -1.4%
- Active inventory
- 222
- Price-to-rent
- 7.1×
Monthly cashflow live
- Estimated rent
- $1,834 high interval (Pro) →
- Mortgage (P&I)
- −$823
- Tax from tax record
- −$248 /mo · $2,979/yr
- Insurance
- −$65
- HOA
- −$0
- Vacancy / Maint / Mgmt
- −$385
- Net cashflow
- $312
Break-even live
UW: 25.0% down · 7.5% · 30yr · 1.5% tax · 5.0% vac · 8.0% maint · 8.0% mgmt
Financing live
Cash to close
- Down payment
- $39,250
- Closing costs
- $4,710
- Reserves months
- —
- Total cash needed
- —
Loan-product check · same deal, 3 products live
Conventional
25% down · 7.5% · 30yr
- Down + closing
- —
- Monthly P&I
- —
- Monthly cashflow
- —
- DSCR
- —
- Eligible?
- —
Personal DTI + credit; lowest rate.
DSCR
20% down · 8.5% · 30yr
- Down + closing
- —
- Monthly P&I
- —
- Monthly cashflow
- —
- DSCR
- —
- Eligible?
- —
No personal income docs; deal must DSCR.
Hard money
10% down · 12.0% · 12mo
- Down + closing
- —
- Monthly P&I
- —
- Monthly cashflow
- —
- DSCR
- —
- Eligible?
- —
Short-term bridge; refi at stabilization.
Rent comps 13 comps
| Address | Beds | Baths | Sqft | Rent | $/sqft | DOM | Units | Dist |
|---|---|---|---|---|---|---|---|---|
| 3054 Cobblewood Ln W Jacksonville, FL | 2.0 | 2.5 | 1480 | $1,950 | $1.32 | 21d | 1 | 0.47mi |
| 12021 McCormick Rd Jacksonville, FL | 3.0 | 2.5 | 1214 | $1,570 | $1.29 | 2d | 4 | 0.47mi |
| 3333 Monument Rd Jacksonville, FL | 1.0–2.0 | 1.0–2.0 | 862 | $1,369 | $1.59 | 1d | 18 | 0.54mi |
| 11406 Bedford Oaks Dr Jacksonville, FL | 2.0 | 1.5 | 1122 | $1,500 | $1.34 | 4d | 1 | 0.55mi |
| 11728 Tanager Dr Jacksonville, FL | 3.0 | 3.0 | 1464 | $1,895 | $1.29 | 1d | 1 | 0.58mi |
| 12036 Arbor Lake Dr Jacksonville, FL | 2.0 | 2.0 | 1233 | $1,795 | $1.46 | 23d | 1 | 0.63mi |
| 11671 Tanager Dr Unit 1 Jacksonville, FL | 3.0 | 2.5 | 1404 | $1,900 | $1.35 | 13d | 1 | 0.67mi |
| 11172 Tanager Dr Jacksonville, FL | 3.0 | 2.5 | 1404 | $1,900 | $1.35 | 23d | 1 | 0.79mi |
| 11548 Willet Ct N Jacksonville, FL | 3.0 | 2.0 | 1633 | $1,800 | $1.10 | 16d | 1 | 0.88mi |
| 3363 Hampstead Dr Jacksonville, FL | 3.0 | 2.0 | 1551 | $2,350 | $1.52 | 17d | 1 | 0.89mi |
| 12423 Forest Lake Cir E Jacksonville, FL | 3.0 | 3.0 | 1597 | $2,375 | $1.49 | 3d | 1 | 1.40mi |
| 12423 Forest Lake Cir E Unit 1 1 Jacksonville, FL | 3.0 | 2.5 | 1597 | $2,375 | $1.49 | 17d | 1 | 1.40mi |
| 12423 Forest Lake Cir N #1 Jacksonville, FL | 3.0 | 2.5 | 1597 | $2,275 | $1.42 | 2d | 1 | 1.40mi |
Listing history 8 events
-
2026-06-05status $157,000 Pending 41 DOM
-
2026-06-03days on market $157,000 Active 41 DOM
-
2026-06-02days on market $157,000 Active 40 DOM
-
2026-06-01days on market $157,000 Active 39 DOM
-
2026-05-31days on market $157,000 Active 38 DOM
-
2026-05-11price $157,000
-
2026-04-23$167,000 Active
-
1986-12-01soldstatus $54,100
ⓘ Source: listings_history table (triggers on properties + properties_extension) + one-shot
backfill from property_details.listing_events for pre-trigger history.
Tax reassessment forecast FL · Resets to sale price
- Current annual tax
- $2,979 · $248/mo
- Projected year-2 tax
- $2,979 · $248/mo
- Expected delta
- $0/yr ($0/mo · 0.0%)
ⓘ Screening estimate from a state-policy table — verify with the county assessor before closing.
Climate risk First Street
- Flood 1/10 Low FEMA zone X (unshaded) · 0% chance over 30 yrs
- Wildfire 4/10 Moderate
- Heat 10/10 Extreme 7 d/yr ≥105°F today · 22 d/yr by 30 yrs out
- Wind 9/10 Extreme 99% chance of damaging wind over 30 yrs
- Air quality 4/10 Moderate 5 unhealthy d/yr today · 5 by 30 yrs out
Nearby sold comps map
Loading sold comps map…
Walkable amenities ~0.75 mi
Loading nearby amenities…
Taxation est. · year 1
- Rental income
- $22,013
- − Mortgage interest
- −$8,794
- − Property taxes
- −$2,979
- − Insurance
- −$785
- − Repairs & maintenance
- −$1,761
- − Management
- −$1,761
- − Depreciation
- −$4,567
- Taxable income
- $1,365
- Est. tax owed @ 24.0%
- −$328
- After-tax cash flow
- $3,418/yr
For passive investors: Depreciation is non-cash, so a rental often shows a tax loss while cash-flowing — sheltering income. Rental losses are passive: they offset passive income freely, and up to $25,000/yr can offset ordinary (W-2) income if you actively participate and your MAGI is under $100k (phasing out to $0 by $150k); unused losses carry forward. On sale, claimed depreciation is recaptured at up to 25%, and gains may owe capital-gains tax (a 1031 exchange can defer both). Figures are a year-1 estimate at your 24.0% rate — not tax advice; consult a CPA.
Schools (NCES district)
- District
- Duval
- NCES district ID
- 1200480
- Math proficiency
- 46% ▼ -11.00%
- Reading proficiency
- 45% ▼ -4.00%
- Median HH income
- $48,987
- Composite
- 38.97/100
- National rank
- #4076
- State rank
- #48 of 73 in FL
Livability — Jacksonville
- Score
- 83/100
- State rank
- #50
- US rank
- #911
Category grades
Schools grade is shown separately in the Schools card above.
Census & demographics
- Census place
- Jacksonville, FL
- County
- Duval County · 1,015,274 people
- City population
- 979,034
- Metro
- Jacksonville, FL
- Population (ZIP)
- 55,905
- Household income
- $90,559
- Rent vs Own
- Severe rent burden
- 1670.0
Population outlook (Duval County) Hauer SSP2
- Today (2025)
- 1,013,010 people
- By 2030
- 1,059,228 · +4.6%
- By 2040
- 1,141,439 · +12.7%
- By 2050
- 1,205,258 · +19.0%
- By 2075
- 1,324,282 · +30.7%
- By 2100
- 1,319,620 · +30.3%
Race, ethnicity, and origin ACS 2023
- Neighborhood character
- Diverse neighborhood (Simpson 0.61)
- Race & ethnicity
- White 59% Hispanic / Latino 14% Two or more races 14% Black 14% Asian 6%
- Hispanic origin (detail)
- Mexican 1% Puerto Rican 5% Cuban 1%
- Common ancestry
- Serbian 3% Slovak 2% Romanian 2%
- Foreign-born
- 13% · Canada, Jamaica, South Korea
- Languages at home
- 82% English-only · Spanish 9% Tagalog/Filipino 2% Other Indo-European 2%
Political lean MEDSL · Duval
- 2024 margin
- Toss-up / Even · D 48.7% · R 50.1% · Other 1.2%
- 2008→2024 swing
- +0.4pp no change · 2008: -1.9pp · 2024: -1.5pp
- All cycles
- 2024: R+1.5 2020: D+3.8 2016: R+1.5 2012: R+3.6 2008: R+1.9
Not yet ingested
- Civics
- —
Market trends
- HPI YoY
- ▼ -191.73%
- Current HPI
- 307.1292
- Rent YoY
- ▼ -1.45%
- Metro
- Jacksonville, FL
- State GDP YoY
- ▲ 3.28%
- F500 in state
- 36
Industry mix (Fortune 500 HQ in FL)
| Industry | F500 HQs | Revenue |
|---|---|---|
| Industrial Technology | 2 | $29B |
|
||
| Insurance | 2 | $17B |
|
||
| Retail | 1 | $60B |
|
||
| Technology Distribution | 1 | $58B |
|
||
| Homebuilding | 1 | $35B |
|
||
| Technology Manufacturing | 1 | $35B |
|
||
Price history
+190.2% since first listed3 events — show timeline
- 2026-05-11 Price Changed $157,000 realMLS
- 2026-04-23 Listed $167,000 realMLS
- 1986-12-01 Sold (Public Records) $54,100 Public Records
Property tax history
+17.9%/yrLatest (2025): $2,979 · +374.2% YoY. Source: county tax records.
Cash-flow waterfall
monthlySold comps — $/sqft
last 12 mo · ≤1 miLoading sold comps…