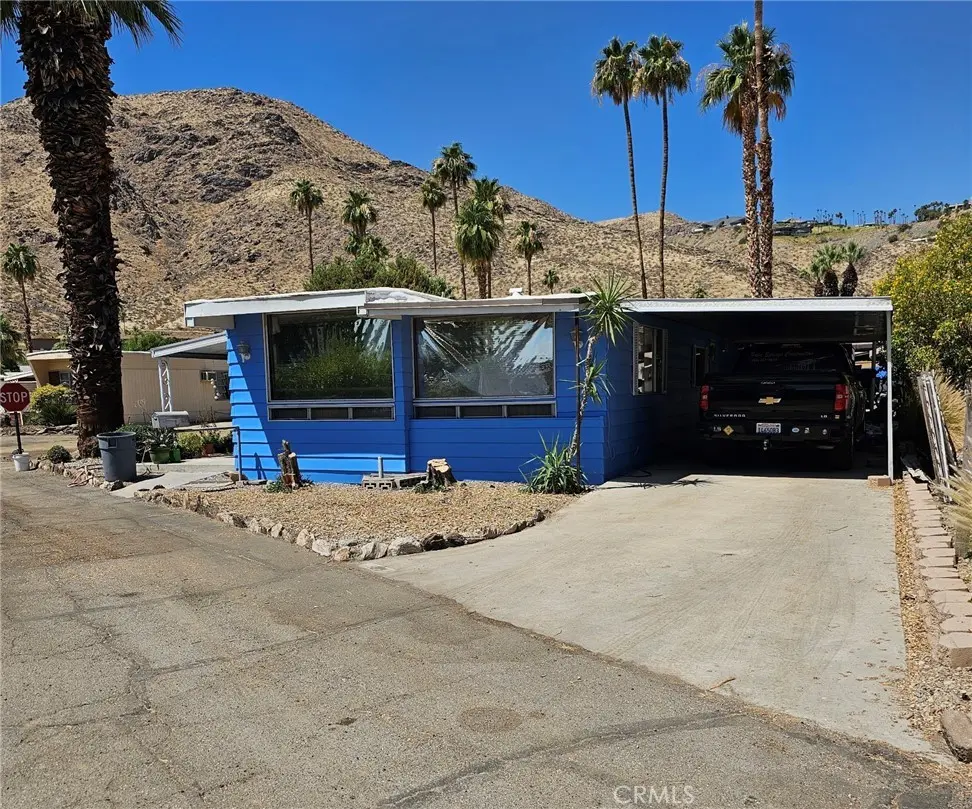
169 Balboa Dr · Palm Springs, CA
Flood risk 1/10 · Minimal
- FEMA flood zone
- X (unshaded)
- Chance of flooding over 30 yrs
- 0.0%
- Est. flood insurance / yr
- $507 – $1,088
Fire risk 5/10 · Moderate
- Est. fire insurance / yr
- $659 – $1,223
Heat risk 9/10 · Severe
- Hot days now (above 112°F)
- 7 days/yr
- Hot days in 30 yrs
- 21 days/yr
Wind risk 1/10 · Minimal
- Chance of severe wind over 30 yrs
- —
Air-quality risk 5/10 · Moderate
- Unhealthy air days now
- 6 days/yr
- Unhealthy air days in 30 yrs
- 8 days/yr
Risk factors via First Street. Map © Google.
Why this score? — see what drove the B- grade
The composite is a weighted blend of 9 inputs, each scored 0–100. Each bar is that input's sub-score; the figure is the points it added to the 100-point composite (weight × sub-score).
- Cash flow +30.0/30.0
- 1% rule +10.0/10.0
- DSCR +10.0/10.0
- ARV discount +4.4/15.0
- Livability +3.3/5.0
- Schools +2.7/10.0
- Rent growth +2.4/5.0
- Condition / age +2.2/5.0
- Appreciation +0.0/10.0
$100,000
🖨 Deal sheet 📄 Offer letter ✓ Due diligence
Listing remarks MLS
Spacious double wide mobilehome in Safari Park, a very sought after Palm Springs location. Home has a very large bedroom, walk-in closet, wardrobe closet, ensuite bath with a new tile and glass walk in shower with 3 heads on wall selector (rainhead, wand, and conventional), and a bench seat. Hall bathroom with a walk-in shower. All new flooring. Carpeted bedroom and hardwood floors. Central Air & Heating! Large corner lot with 2 covered areas. One carport and another side patio.
Key facts
- Large corner lot
- Ensuite bath
- Carport
Tags
Neighborhood map
What this means for you Summary
Snapshot
- This is a 1-bed/2.0-bath manufactured listed at $100k. Condition is rated fair.
Deal economics
- At list price, monthly cash flow is $1k ($16k/yr) — positive.
- The deal already cash-flows at list — no discount required.
- Meets the 1% rule at list price ($3k rent vs $100k).
- Recommended offer: $88k (12.0% below list) — sets the bar for market timing.
- Cap rate 22.3% vs local median 2.7% in Palm Springs — top-decile yield for the area; either an underpriced asset or a hidden risk that comps aren't pricing in. Stress-test before assuming the spread holds.
Location & tenants
- Location reads 66/100 on livability (#348 in CA) — a middle-class / working-renter tenant base. Strengths: amenities A+, commute A+; Watch: schools C-, crime F, cost of living F.
- Palm Springs Unified (suburban): math 21% / reading 42% proficiency, ranked #328 of 517 in CA (top 63%) — families likely to look elsewhere, expect single-tenant / working-renter base with shorter leases; 73% free/reduced lunch — lower-income household profile, screen leases tightly.
- Market conditions: Rents soft (-0.4%/yr); 492 active listings in the ZIP; 24 comparable units currently listed for rent nearby; rentals at typical pace (median 24d on market — plan ~3-4 weeks tenant-placement turnaround); solid renter incomes; 9,195 units permitted in Riverside County in 2024 (1,512 in 5+ unit buildings).
- This rent runs 40% of the median local income ($78k/yr) — at the standard rent-burdened threshold; future hikes will face affordability resistance.
Forward outlook
- Local home prices are declining (-3.0%/yr); year-one equity from $691 of loan paydown is wiped out by about $3k of value loss. Plan a longer hold.
- Riverside County population projected at +22% by 2050 — long-run rental-demand tailwind backs the buy-and-hold thesis.
- At projected returns (-3.0% appreciation + 0.0% rent growth), your $28k cash investment doubles in ~3 years — after that, you're playing with house money.
Negotiation context
- It's been on market 180 days — a 12% lower offer ($88k) is reasonable based on typical stale-listing flexibility.
Risks & watch-outs
- Climate carrying-cost: moderate wildfire risk; extreme-heat days projected 7→21/yr by 2055 (HVAC capex compounding) — expect insurance premiums to compound above CPI over the hold.
Questions for the listing agent
- It's been on market 180 days. Have you received any prior offers? Is the seller open to a 12% concession, seller financing, or rate buy-down credit?
- Have any recent inspections been done? Can we get a copy of the seller's disclosures and any deferred-maintenance estimates?
- Built in 1963 — when were the roof, HVAC, electrical panel, plumbing, and water heater last replaced?
- Why hasn't it sold? Are there any deal-killer items the seller is aware of (foundation, flood, title, zoning, code violations)?
- Is there a deadline driving the sale (1031 exchange, divorce, estate, relocation)? That informs how much negotiation room exists.
- Crime grade is F in this area — have there been break-ins, vandalism, or insurance claims at this property in the last 3 years? What carrier currently insures it and at what premium?
- What's the average days-on-market for RENTAL listings here right now (not sales)? A rising rental-DOM trend means longer vacancies and softer asking-rent achievability than the comps imply.
- What's the recent tenant-quality profile in this submarket — average credit score on applications, eviction rate, late-payment / NSF rate, and stable-employment percentage? A property-management company in the area should have these aggregated.
- How much new for-sale + rental construction is in the pipeline within 1–3 miles? Heavy new supply typically softens prices + rents 12–24 months out; constrained supply supports both.
Investment metrics
- 1% rule
- 2.56% ✓
- Cap rate
- 22.29%
- Cash-on-cash
- 57.13%
- DSCR
- 3.54
- GRM
- 3.3
CMA / ARV
- ARV (median comp)
- $93,595
- List price
- $100,000
- Delta
- 6.84%
- Verdict
- FAIR
- Comps
- 9 within 1.0 mi
Show comp detail 12 sales within ~0.75 mi
| Address | Dist | Beds/Ba | Sqft | Sold | Price | $/sf | Match |
|---|---|---|---|---|---|---|---|
| 147 Camarillo St | 0.10mi | 2/2.0 (+1) | 1,100 (+4%) | 2mo | $58,000 | $53 | 83 |
| 179 Balboa | 0.05mi | 2/2.0 (+1) | 1,060 (0%) | 15mo | $215,000 | $203 | 80 |
| 171 Balboa Dr | 0.02mi | 1/1.0 | 945 (-11%) | 1mo | $95,000 | $101 | 76 |
| 235 Newport | 0.13mi | 2/2.0 (+1) | 1,080 (+2%) | 13mo | $125,000 | $116 | 74 |
| 86 Santa Monica St | 0.06mi | 2/2.0 (+1) | 1,070 (+1%) | 22mo | $118,000 | $110 | 72 |
| 54 Santa Maria | 0.11mi | 2/2.0 (+1) | 1,000 (-6%) | 14mo | $147,000 | $147 | 69 |
| 257 Del Mar | 0.12mi | 2/2.0 (+1) | 1,200 (+13%) | 1mo | $125,000 | $104 | 67 |
| 7 Carmel | 0.16mi | 2/2.0 (+1) | 1,120 (+6%) | 15mo | $143,000 | $128 | 65 |
| 46 Santa Maria | 0.14mi | 1/2.0 | 920 (-13%) | 11mo | $95,000 | $103 | 62 |
| 226 Newport Dr | 0.09mi | 2/2.0 (+1) | 1,200 (+13%) | 18mo | $111,000 | $93 | 53 |
| 144 Jupiter St | 0.24mi | 2/2.0 (+1) | 1,152 (+9%) | 20mo | $225,000 | $195 | 53 |
| 136 Laguna | 0.04mi | 2/1.0 (+1) | 1,200 (+13%) | 24mo | $30,000 | $25 | 47 |
Match score weights: distance 35% · size 25% · config 20% · recency 20%. Top-matched comps best support the ARV.
Projected returns pro-forma
-3.0% appreciation · 0.0% rent growth · sell at horizon
- IRR
- 52.2%
- Equity multiple
- 3.19×
- Total profit
- $61,231
- Equity at exit
- $14,910
- IRR
- 56.3%
- Equity multiple
- 5.78×
- Total profit
- $133,786
- Equity at exit
- $8,646
Cash invested: $28,000 (down + closing). Projections, not guarantees.
Landlord ↔ Tenant lean methodology
- Overall (STATE)
- 18 Strongly Tenant-Friendly
- State California
- 18 Strongly Tenant-Friendly · D+13
- County
- — inherits STATE
- City
- — inherits STATE
ZIP-level market 92264
- Rents YoY
- -0.4%
- Active inventory
- 492
- Price-to-rent
- 3.3×
Monthly cashflow live
- Estimated rent
- $2,562 high interval (Pro) →
- Mortgage (P&I)
- −$524
- Tax est. 1.5%
- −$125 /mo · $1,500/yr
- Insurance
- −$42
- HOA
- −$0
- Vacancy / Maint / Mgmt
- −$538
- Net cashflow
- $1,333
Break-even live
UW: 25.0% down · 7.5% · 30yr · 1.5% tax · 5.0% vac · 8.0% maint · 8.0% mgmt
Financing live
Cash to close
- Down payment
- $25,000
- Closing costs
- $3,000
- Reserves months
- —
- Total cash needed
- —
Loan-product check · same deal, 3 products live
Conventional
25% down · 7.5% · 30yr
- Down + closing
- —
- Monthly P&I
- —
- Monthly cashflow
- —
- DSCR
- —
- Eligible?
- —
Personal DTI + credit; lowest rate.
DSCR
20% down · 8.5% · 30yr
- Down + closing
- —
- Monthly P&I
- —
- Monthly cashflow
- —
- DSCR
- —
- Eligible?
- —
No personal income docs; deal must DSCR.
Hard money
10% down · 12.0% · 12mo
- Down + closing
- —
- Monthly P&I
- —
- Monthly cashflow
- —
- DSCR
- —
- Eligible?
- —
Short-term bridge; refi at stabilization.
Rent comps 24 comps
| Address | Beds | Baths | Sqft | Rent | $/sqft | DOM | Units | Dist |
|---|---|---|---|---|---|---|---|---|
| 2391 Mira Monte Cir W Palm Springs, CA | 2.0 | 2.0 | 1180 | $2,850 | $2.42 | 43d | 1 | 0.32mi |
| 2350 Miramonte Cir E Unit A Palm Springs, CA | 2.0 | 2.0 | 1264 | $3,000 | $2.37 | 24d | 1 | 0.36mi |
| 2350 Miramonte Cir E Unit E Palm Springs, CA | 2.0 | 2.0 | 1241 | $4,500 | $3.63 | 43d | 1 | 0.36mi |
| 2601 S Broadmoor Dr Palm Springs, CA | 2.0 | 2.0 | 1178 | $2,050 | $1.74 | 43d | 2 | 0.56mi |
| 2441 S Birdie Way Unit E Palm Springs, CA | 2.0 | 2.0 | 1438 | $3,250 | $2.26 | 24d | 1 | 0.59mi |
| 4850 N Winners Cir Unit A Palm Springs, CA | 2.0 | 2.0 | 1275 | $2,700 | $2.12 | 16d | 1 | 0.61mi |
| 1700 S Araby Dr Palm Springs, CA | 1.0–2.0 | 1.0–2.0 | 871 | $2,217 | $2.54 | 1d | 3 | 0.72mi |
| 5225 E Waverly Dr #66 Palm Springs, CA | 1.0 | 2.0 | 887 | $3,600 | $4.06 | 43d | 1 | 0.73mi |
| 5300 E Waverly Dr Unit C4 Palm Springs, CA | 2.0 | 1.5 | 768 | $1,900 | $2.47 | 2d | 1 | 0.80mi |
| 5301 E Waverly Dr #192 Palm Springs, CA | 2.0 | 2.0 | 979 | $2,300 | $2.35 | 24d | 1 | 0.86mi |
| 5301 E Waverly Dr #120 Palm Springs, CA | 1.0 | 2.0 | 887 | $2,800 | $3.16 | 43d | 1 | 0.86mi |
| 5300 E Waverly Dr Palm Springs, CA | 1.0–2.0 | 1.5–2.0 | 768 | $1,750 | $2.28 | 24d | 2 | 0.89mi |
| 5301 E Waverly Dr Palm Springs, CA | 1.0–2.0 | 2.0 | 933 | $2,100 | $2.25 | 18d | 2 | 0.93mi |
| 5301 E Waverly Dr Palm Springs, CA | 1.0–2.0 | 2.0 | 933 | $2,100 | $2.25 | 15d | 2 | 0.93mi |
| 2800 Lawrence Crossley Rd Palm Springs, CA | 2.0 | 2.0 | 905 | $2,022 | $2.23 | 43d | 1 | 1.03mi |
| 2700 Lawrence Crossley Rd Unit B15 Palm Springs, CA | 2.0 | 2.0 | 885 | $1,950 | $2.20 | 43d | 1 | 1.04mi |
| 2700 Lawrence Crossley Rd #18 Palm Springs, CA | 2.0 | 2.0 | 885 | $2,050 | $2.32 | 18d | 1 | 1.04mi |
| 2701 E Mesquite Ave Palm Springs, CA | 2.0 | 2.0 | 1175 | $2,898 | $2.47 | 15d | 4 | 1.30mi |
| 2701 E Mesquite Ave Palm Springs, CA | 2.0 | 2.0 | 1175 | $3,435 | $2.92 | 20d | 4 | 1.30mi |
| 2701 E Mesquite Ave Palm Springs, CA | 2.0 | 2.0 | 1175 | $2,982 | $2.54 | 24d | 5 | 1.30mi |
| 2010 Lawrence Crossley Rd Unit 8 Palm Springs, CA | 2.0 | 1.5 | 993 | $1,895 | $1.91 | 14d | 1 | 1.32mi |
| 2700 E Mesquite Ave Palm Springs, CA | 2.0 | 2.0 | 1175 | $3,025 | $2.57 | 43d | 2 | 1.32mi |
| 6071 Hazeltine Plz Palm Springs, CA | 2.0 | 2.0 | 1168 | $3,200 | $2.74 | 43d | 1 | 1.46mi |
| 3737 E Calle De Carlos Unit 3 Palm Springs, CA | — | 1.0 | 705 | $1,499 | $2.13 | 20d | 1 | 1.48mi |
Listing history 15 events
-
2026-06-18days on market $100,000 Active 180 DOM
-
2026-06-17days on market $100,000 Active 179 DOM
-
2026-06-16days on market $100,000 Active 178 DOM
-
2026-06-15days on market $100,000 Active 177 DOM
-
2026-06-13days on market $100,000 Active 175 DOM
-
2026-06-13days on market $100,000 Active 174 DOM
-
2026-06-09days on market $100,000 Active 171 DOM
-
2026-06-08days on market $100,000 Active 170 DOM
-
2026-06-07days on market $100,000 Active 169 DOM
-
2026-06-04days on market $100,000 Active 166 DOM
-
2026-06-03days on market $100,000 Active 165 DOM
-
2026-06-02days on market $100,000 Active 164 DOM
-
2026-06-01days on market $100,000 Active 163 DOM
-
2026-05-31days on market $100,000 Active 162 DOM
-
2025-12-20$100,000 Active 489-char remark
Show marketing remark (489 chars)
Spacious double wide mobilehome in Safari Park, a very sought after Palm Springs location. Home has a very large bedroom, walk-in closet, wardrobe closet, ensuite bath with a new tile and glass walk in shower with 3 heads on wall selector (rainhead, wand, and conventional), and a bench seat. Hall bathroom with a walk-in shower. All new flooring. Carpeted bedroom and hardwood floors. Central Air & Heating! Large corner lot with 2 covered areas. One carport and another side patio.
ⓘ Source: listings_history table (triggers on properties + properties_extension) + one-shot
backfill from property_details.listing_events for pre-trigger history.
Climate risk First Street
- Flood 1/10 Low FEMA zone X (unshaded) · 0% chance over 30 yrs
- Wildfire 5/10 Major
- Heat 9/10 Extreme 7 d/yr ≥112°F today · 21 d/yr by 30 yrs out
- Wind 1/10 Low
- Air quality 5/10 Major 6 unhealthy d/yr today · 8 by 30 yrs out
Nearby sold comps map
Loading sold comps map…
Walkable amenities ~0.75 mi
Loading nearby amenities…
Taxation est. · year 1
- Rental income
- $30,747
- − Mortgage interest
- −$5,602
- − Property taxes
- −$1,500
- − Insurance
- −$500
- − Repairs & maintenance
- −$2,460
- − Management
- −$2,460
- − Depreciation
- −$2,909
- Taxable income
- $15,317
- Est. tax owed @ 24.0%
- −$3,676
- After-tax cash flow
- $12,321/yr
For passive investors: Depreciation is non-cash, so a rental often shows a tax loss while cash-flowing — sheltering income. Rental losses are passive: they offset passive income freely, and up to $25,000/yr can offset ordinary (W-2) income if you actively participate and your MAGI is under $100k (phasing out to $0 by $150k); unused losses carry forward. On sale, claimed depreciation is recaptured at up to 25%, and gains may owe capital-gains tax (a 1031 exchange can defer both). Figures are a year-1 estimate at your 24.0% rate — not tax advice; consult a CPA.
Condition & rehab AI · 12 photos
This double-wide mobile home requires moderate repairs and maintenance, with a focus on exterior siding and interior walls. Upgrades to the exterior and interior will significantly enhance its resale and rental value.
Repairs flagged
- Major exterior siding — Significant wear and tear
- Major interior walls — Peeling paint
- Minor bathroom fixtures — Dated fixtures
Value-add opportunities
- Resale Paint exterior siding — Enhances curb appeal
- Both Replace carpet with hardwood flooring — Improves both resale and rental value
- Resale Replace dated bathroom fixtures — Modernizes the bathroom
Renovation cost estimate screening
| Repair item | Severity | Est. cost |
|---|---|---|
| exterior siding · Significant wear and tear | Major | $15,000–50,000 |
| interior walls · Peeling paint | Major | $15,000–50,000 |
| bathroom fixtures · Dated fixtures | Minor | $500–3,000 |
| Total estimated repair cost · 3 items | $30,500–103,000 |
Value-add ROI direction
- Resale Paint exterior siding — Enhances curb appeal ↑
- Both Replace carpet with hardwood flooring — Improves both resale and rental value ↑
- Resale Replace dated bathroom fixtures — Modernizes the bathroom ↑
ⓘ Cost ranges are severity-bucket heuristics (US national rule-of-thumb). Get contractor quotes + a written scope before underwriting a rehab budget.
Schools (NCES district)
- District
- Palm Springs Unified
- NCES district ID
- 0629550
- Math proficiency
- 21% ▼ -7.00%
- Reading proficiency
- 42% ▬ 0.00%
- Median HH income
- $43,638
- Composite
- 26.76/100
- National rank
- #7131
- State rank
- #328 of 517 in CA
Livability — Palm Springs
- Score
- 66/100
- State rank
- #348
- US rank
- #11850
Category grades
Schools grade is shown separately in the Schools card above.
Census & demographics
- Census place
- Palm Springs, CA
- County
- Riverside County · 2,287,001 people
- City population
- 46,786
- Metro
- Riverside-San Bernardino-Ontario, CA
- Population (ZIP)
- 19,899
- Household income
- $77,688
- Rent vs Own
- Severe rent burden
- 1215.0
Population outlook (Riverside County) Hauer SSP2
- Today (2025)
- 2,664,475 people
- By 2030
- 2,802,692 · +5.2%
- By 2040
- 3,050,904 · +14.5%
- By 2050
- 3,256,783 · +22.2%
- By 2075
- 3,655,058 · +37.2%
- By 2100
- 3,766,594 · +41.4%
Race, ethnicity, and origin ACS 2023
- Neighborhood character
- Predominantly White (68%)
- Race & ethnicity
- White 68% Hispanic / Latino 20% Two or more races 12% Asian 6% Black 2% Native American 1%
- Hispanic origin (detail)
- Mexican 16%
- Common ancestry
- Lithuanian 4% Romanian 3% Slovak 3%
- Foreign-born
- 16% · Canada, China, South Korea
- Languages at home
- 81% English-only · Spanish 13% Tagalog/Filipino 2% Other Asian/Pacific 1%
Political lean MEDSL · Riverside
- 2024 margin
- Toss-up / Even · D 48.0% · R 49.3% · Other 2.6%
- 2008→2024 swing
- -3.6pp toward R · 2008: 2.3pp · 2024: -1.3pp
- All cycles
- 2024: R+1.3 2020: D+8.0 2016: D+4.3 2012: R+0.4 2008: D+2.3
Not yet ingested
- Civics
- —
Market trends
- HPI YoY
- ▼ -489.04%
- Current HPI
- 357.0969
- Rent YoY
- ▼ -0.43%
- Metro
- Riverside-San Bernardino-Ontario, CA
- State GDP YoY
- ▲ 3.21%
- F500 in state
- 116
Industry mix (Fortune 500 HQ in CA)
| Industry | F500 HQs | Revenue |
|---|---|---|
| Technology | 27 | $1,492B |
|
||
| Financial Services | 3 | $174B |
|
||
| Retail | 3 | $44B |
|
||
| Insurance | 3 | $26B |
|
||
| Media / Entertainment | 2 | $115B |
|
||
| Pharmaceuticals / Biotech | 2 | $62B |
|
||
Price history
1 event — show timeline
- 2025-12-20 Listed $100,000 CRMLS
Cash-flow waterfall
monthlySold comps — $/sqft
last 12 mo · ≤1 miLoading sold comps…