101 Mulberry St #314 · Springfield, MA
Flood risk 1/10 · Minimal
- FEMA flood zone
- X (unshaded)
- Chance of flooding over 30 yrs
- 0.0%
- Est. flood insurance / yr
- $507 – $1,088
Fire risk 1/10 · Minimal
- Est. fire insurance / yr
- $915 – $1,699
Heat risk 4/10 · Minor
- Hot days now (above 98°F)
- 7 days/yr
- Hot days in 30 yrs
- 16 days/yr
Wind risk 5/10 · Moderate
- Chance of severe wind over 30 yrs
- 26.0%
Air-quality risk 2/10 · Minimal
- Unhealthy air days now
- 1 days/yr
- Unhealthy air days in 30 yrs
- 2 days/yr
Risk factors via First Street. Map © Google.
Why this score? — see what drove the C- grade
The composite is a weighted blend of 9 inputs, each scored 0–100. Each bar is that input's sub-score; the figure is the points it added to the 100-point composite (weight × sub-score).
- Cash flow +15.4/30.0
- ARV discount +7.5/15.0
- 1% rule +7.0/10.0
- Appreciation +5.5/10.0
- DSCR +4.7/10.0
- Livability +3.7/5.0
- Rent growth +2.5/5.0
- Condition / age +2.5/5.0
- Schools +1.6/10.0
$137,000
🖨 Deal sheet (PDF) 📄 Offer letter ✓ Due diligence
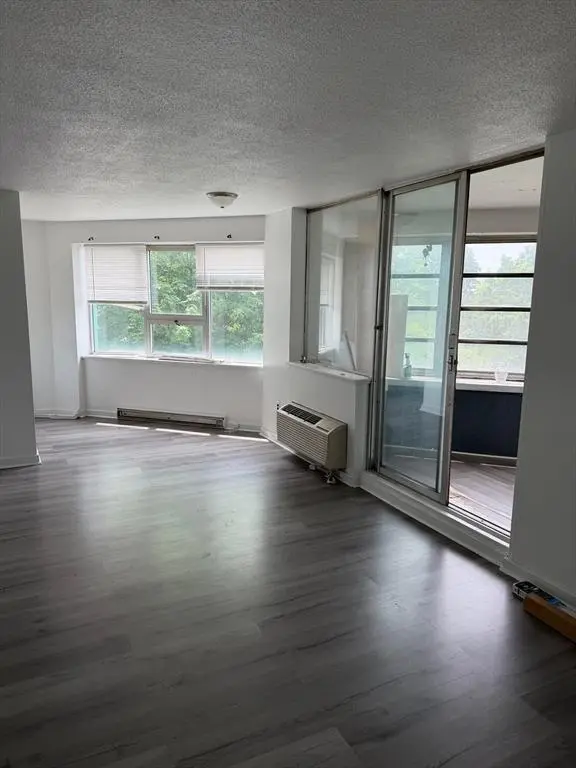
Listing remarks
Nice two bedroom one bathroom condo on Mulberry Street! Convenient to local amenities, casino, and highways! Don't miss out!
Key facts
- $357 HOA
- Parking
- Built 1955
Property features AI
Finance
- Other: Condominium is active in listings
- HOA & community: Monthly association fee of $357; HOA covers water, sewer, insurance, security, building maintenance, grounds maintenance, snow removal, and trash; Building amenities include hot water and elevator(s); Not a senior community
Exterior
- Parking: 1 covered garage space (1 total garage space); No open parking spaces
- Utilities: Public water supply; Public sewer
- Home design: Condominium (attached); Mid-rise building; Single-story unit; Entry on level 3
- Construction: Built according to public records; Actual year built reported
- Exterior features: Public water; Public sewer; Off Maple Street location
Interior
- Bathrooms: 1 full bathroom
- Heating & cooling: Electric heating; Wall unit cooling
- Interior features: Total of 4 rooms; No basement
Neighborhood map
What this means for you Summary
Snapshot
- This is a 2-bed/1.0-bath condo listed at $137k.
Deal economics
- At list price, monthly cash flow is $53 ($637/yr) — positive.
- The deal already cash-flows at list — no discount required.
- Meets the 1% rule at list price ($2k rent vs $137k).
- Recommended offer: $135k (1.5% below list) — sets the bar for market timing.
- Cap rate 6.8% vs local median 5.1% in Springfield — top-decile yield for the area; either an underpriced asset or a hidden risk that comps aren't pricing in. Stress-test before assuming the spread holds.
Location & tenants
- Location reads 73/100 on livability (#97 in MA) — a middle-class / working-renter tenant base. Strengths: commute A+, health & safety A+, amenities A; Watch: schools D, crime F, employment D-.
- Springfield (urban): math 13% / reading 25% proficiency, ranked #296 of 302 in MA (top 98%) — low school quality limits family demand, transient renter base, plan for 1-2y turnover; 81% free/reduced lunch — lower-income household profile, screen leases tightly.
- Market conditions: 18 active listings in the ZIP; 40 comparable units currently listed for rent nearby; rentals at typical pace (median 23d on market — plan ~3-4 weeks tenant-placement turnaround); 40% of comp listings sitting > 30 days — soft ceiling on asking rent; 453 units permitted in Hampden County in 2024 (116 in 5+ unit buildings).
Forward outlook
- In year one you build about $2k of equity ($947 loan paydown + $1k appreciation (1.1% local appreciation)).
- Hampden County population projected at +5% by 2050 — modest demand growth; plan on rents tracking national, not racing it.
- At projected returns (1.1% appreciation + 3.0% rent growth), your $38k cash investment doubles in ~9 years — after that, you're playing with house money.
Negotiation context
- It's been on market 26 days — a 2% lower offer ($135k) is reasonable based on typical stale-listing flexibility.
- Current owner paid $17k; list at $137k implies a 706% gain — meaningful room to come down on a strong offer.
Risks & watch-outs
- Watch-outs: HOA is 22% of rent; built in 1955 — expect roof / HVAC / electrical / plumbing capex.
- Climate carrying-cost: moderate wind risk, 26% chance of damaging wind over 30y — expect insurance premiums to compound above CPI over the hold.
Questions for the listing agent
- Built in 1955 — when were the roof, HVAC, electrical panel, plumbing, and water heater last replaced?
- What does the HOA fee cover, when was the last increase, and are there any pending special assessments or reserve-fund shortfalls?
- Any open or pending special assessments — roof, HVAC, plumbing, elevator, façade? What's the per-unit balance and payoff schedule, and is the seller paying it off at close or rolling it to the buyer?
- Is there a deadline driving the sale (1031 exchange, divorce, estate, relocation)? That informs how much negotiation room exists.
- Schools are D-rated, which usually means shorter tenancies and higher turnover. Who's the typical renter profile here, and what's been the actual vacancy rate?
- Crime grade is F in this area — have there been break-ins, vandalism, or insurance claims at this property in the last 3 years? What carrier currently insures it and at what premium?
- What's the average days-on-market for RENTAL listings here right now (not sales)? A rising rental-DOM trend means longer vacancies and softer asking-rent achievability than the comps imply.
- What's the recent tenant-quality profile in this submarket — average credit score on applications, eviction rate, late-payment / NSF rate, and stable-employment percentage? A property-management company in the area should have these aggregated.
- How much new apartment / multifamily construction is in the pipeline within 1–3 miles? Heavy new supply (>2% of stock underway) typically softens rents 12–24 months out; light construction supports rent growth.
Investment metrics
- 1% rule
- 1.20% ✓
- Cap rate
- 6.76%
- Cash-on-cash
- 1.66%
- DSCR
- 1.07
- GRM
- 6.9
CMA / ARV
No comps found within radius.
Projected returns pro-forma
1.08% appreciation · 3.0% rent growth · sell at horizon
- IRR
- 3.4%
- Equity multiple
- 1.17×
- Total profit
- $6,689
- Equity at exit
- $47,339
- IRR
- 7.9%
- Equity multiple
- 1.98×
- Total profit
- $37,418
- Equity at exit
- $63,351
Cash invested: $38,360 (down + closing). Projections, not guarantees.
Landlord ↔ Tenant lean methodology
- Overall (STATE)
- 20 Strongly Tenant-Friendly
- State Massachusetts
- 20 Strongly Tenant-Friendly · D+15
- County
- — inherits STATE
- City
- — inherits STATE
ZIP-level market 01105
- Home prices YoY
- 0.3%
- Active inventory
- 18
- Price-to-rent
- 6.9×
Monthly cashflow live
- Estimated rent
- $1,646 high interval (Pro) →
- Mortgage (P&I)
- −$718
- Tax from tax record
- −$114 /mo · $1,374/yr
- Insurance
- −$57
- HOA
- −$357
- Vacancy / Maint / Mgmt
- −$346
- Net cashflow
- $53
Break-even live
Sensitivity live
| Price | -10% $131 | -5% $92 | +0% $53 | +5% $14 | +10% $-24 |
|---|---|---|---|---|---|
| Rent | -10% $-77 | -5% $-12 | +0% $53 | +5% $118 | +10% $183 |
| Rate | -1.0pp $122 | -0.5pp $88 | base $53 | +0.5pp $18 | +1.0pp $-19 |
UW: 25.0% down · 7.5% · 30yr · 1.5% tax · 5.0% vac · 8.0% maint · 8.0% mgmt
Financing live
Cash to close
- Down payment
- $34,250
- Closing costs
- $4,110
- Reserves months
- —
- Total cash needed
- —
Loan-product check · same deal, 3 products live
Conventional
25% down · 7.5% · 30yr
- Down + closing
- —
- Monthly P&I
- —
- Monthly cashflow
- —
- DSCR
- —
- Eligible?
- —
Personal DTI + credit; lowest rate.
DSCR
20% down · 8.5% · 30yr
- Down + closing
- —
- Monthly P&I
- —
- Monthly cashflow
- —
- DSCR
- —
- Eligible?
- —
No personal income docs; deal must DSCR.
Hard money
10% down · 12.0% · 12mo
- Down + closing
- —
- Monthly P&I
- —
- Monthly cashflow
- —
- DSCR
- —
- Eligible?
- —
Short-term bridge; refi at stabilization.
Rent comps 40 comps
| Address | Beds | Baths | Sqft | Rent | $/sqft | DOM | Units | Dist |
|---|---|---|---|---|---|---|---|---|
| 101 Mulberry St #519 Springfield, MA | 2.0 | 1.0 | 840 | $1,700 | $2.02 | 22d | 1 | 0.02mi |
| 26 Avon Pl Unit 26 Springfield, MA | 1.0 | 1.0 | 950 | $1,350 | $1.42 | 45d | 1 | 0.20mi |
| 141 Maple St Unit 143-23 Springfield, MA | 1.0 | 1.0 | 625 | $1,000 | $1.60 | 45d | 1 | 0.23mi |
| 76 Maple St Unit 2 Springfield, MA | 3.0 | 1.0 | 850 | $1,850 | $2.18 | 15d | 1 | 0.28mi |
| 76 Maple St Springfield, MA | 2.0 | 1.0 | 800 | $1,700 | $2.12 | 22d | 1 | 0.28mi |
| 44 Dale St Springfield, MA | 2.0 | 1.0 | 900 | $1,600 | $1.78 | 15d | 1 | 0.35mi |
| 11-31 Park St Unit 302 Springfield, MA | 1.0 | 1.0 | 800 | $1,800 | $2.25 | 45d | 1 | 0.43mi |
| 15 Park St Unit 201 Springfield, MA | 1.0 | 1.0 | 900 | $1,699 | $1.89 | 22d | 1 | 0.43mi |
| 87 Quincy St Unit 2R Springfield, MA | 2.0 | 1.0 | 984 | $1,695 | $1.72 | 22d | 1 | 0.44mi |
| 14 Adams St Unit 2 Springfield, MA | 2.0 | 1.0 | 890 | $1,800 | $2.02 | 15d | 1 | 0.51mi |
| 14 Adams St Unit 1 Springfield, MA | 3.0 | 1.0 | 880 | $1,800 | $2.05 | 22d | 1 | 0.51mi |
| 114 William St Unit 1R Springfield, MA | 1.0 | 1.0 | 600 | $1,500 | $2.50 | 45d | 1 | 0.54mi |
| 70 Chestnut St Springfield, MA | 1.0 | 1.0 | 572 | $1,344 | $2.35 | 13d | 2 | 0.55mi |
| 38 Greenacre Sq Unit 2 Springfield, MA | 2.0 | 1.0 | 900 | $1,900 | $2.11 | 22d | 1 | 0.57mi |
| 38 Greenacre Sq Unit 3 Springfield, MA | 2.0 | 1.0 | 900 | $1,700 | $1.89 | 45d | 1 | 0.57mi |
| 27 Loring St Apt 1L Springfield, MA | 2.0 | 1.0 | 800 | $1,350 | $1.69 | 22d | 1 | 0.59mi |
| 122 Chestnut St Springfield, MA | 2.0 | 1.0 | 867 | $1,899 | $2.19 | 11d | 6 | 0.60mi |
| 140 Chestnut St Springfield, MA | 1.0 | 1.0 | 728 | $1,525 | $2.09 | 45d | 3 | 0.64mi |
| 140 Chestnut St Springfield, MA | 1.0 | 1.0 | 728 | $1,600 | $2.20 | 22d | 2 | 0.64mi |
| 241 Tyler St Springfield, MA | 3.0 | 1.0 | 1082 | $2,200 | $2.03 | 15d | 1 | 0.69mi |
| 21 Chapel St Unit 2 Springfield, MA | 3.0 | 1.0 | 1000 | $1,700 | $1.70 | 45d | 1 | 0.79mi |
| 77 Chester St Unit 77 Springfield, MA | 2.0 | 1.0 | 900 | $1,670 | $1.86 | 45d | 1 | 0.80mi |
| 240 Locust St Apt 4L Springfield, MA | 2.0 | 1.0 | 800 | $1,734 | $2.17 | 45d | 1 | 0.81mi |
| 15 Taylor St Springfield, MA | 2.0 | 1.0–1.5 | 797 | $2,251 | $2.82 | 15d | 21 | 0.84mi |
| 17 Leyfred Ter Unit 1 R Springfield, MA | 2.0 | 1.0 | 800 | $1,650 | $2.06 | 15d | 1 | 0.92mi |
| 65 Belmont Ave Unit 4 L Springfield, MA | 2.0 | 1.0 | 800 | $1,650 | $2.06 | 22d | 1 | 0.93mi |
| 51 Vinton St #3 Springfield, MA | 2.0 | 1.0 | 875 | $2,000 | $2.29 | 45d | 1 | 0.96mi |
| 7 Ledyard St Unit 7 Springfield, MA | 3.0 | 1.0 | 1000 | $1,920 | $1.92 | 45d | 1 | 1.01mi |
| 106 Malden St Springfield, MA | 2.0 | 1.0 | 664 | $1,545 | $2.33 | 12d | 2 | 1.01mi |
| 888 State St Apt 44 Springfield, MA | 2.0 | 1.0 | 800 | $1,500 | $1.88 | 45d | 1 | 1.03mi |
| 186 Belmont Ave Unit 186-4R Springfield, MA | 3.0 | 1.0 | 910 | $1,300 | $1.43 | 45d | 1 | 1.06mi |
| 122 Fort Pleasant Ave Unit Third Floor Springfield, MA | 3.0 | 1.0 | 1000 | $1,700 | $1.70 | 22d | 1 | 1.09mi |
| 37 Chase Ave Unit 2nd Floor Springfield, MA | 2.0 | 1.0 | 1000 | $1,700 | $1.70 | 45d | 1 | 1.13mi |
| 180 Oakland St Apt 7 Springfield, MA | 2.0 | 1.0 | 750 | $1,600 | $2.13 | 15d | 1 | 1.13mi |
| 72 Kensington Ave Unit 2L Springfield, MA | 2.0 | 1.0 | 1000 | $1,595 | $1.59 | 15d | 1 | 1.14mi |
| 72 Kensington Ave Unit 2L Springfield, MA | 2.0 | 1.0 | 1000 | $1,595 | $1.59 | 22d | 1 | 1.14mi |
| 144 White St Springfield, MA | 2.0 | 1.0 | 1100 | $1,500 | $1.36 | 15d | 1 | 1.17mi |
| 414 Chestnut St Springfield, MA | 1.0–2.0 | 1.0 | 530 | $1,615 | $3.04 | 45d | 1 | 1.24mi |
| 52 Warner St Springfield, MA | 1.0 | 1.0 | 900 | $1,500 | $1.67 | 15d | 1 | 1.29mi |
| 54 Clantoy St Unit 2 Springfield, MA | 3.0 | 1.0 | 1000 | $1,700 | $1.70 | 45d | 1 | 1.31mi |
HOA detail condo
- Monthly dues
- $357 · $4,284/yr
- Assessments
- None detected in remarks — confirm with the listing agent.
Listing history 21 events
-
2026-06-18days on market $137,000 Active 26 DOM
-
2026-06-17days on market $137,000 Active 25 DOM
-
2026-06-16days on market $137,000 Active 24 DOM
-
2026-06-15days on market $137,000 Active 23 DOM
-
2026-06-14days on market $137,000 Active 21 DOM
-
2026-06-13days on market $137,000 Active 20 DOM
-
2026-06-10days on market $137,000 Active 18 DOM
-
2026-06-09days on market $137,000 Active 17 DOM
-
2026-06-08days on market $137,000 Active 16 DOM
-
2026-06-07days on market $137,000 Active 15 DOM
-
2026-06-05days on market $137,000 Active 12 DOM
-
2026-06-03days on market $137,000 Active 11 DOM
-
2026-06-02days on market $137,000 Active 10 DOM
-
2026-06-01days on market $137,000 Active 9 DOM
-
2026-05-31days on market $137,000 Active 8 DOM
-
2026-05-30days on market $137,000 Active 7 DOM
-
2026-05-23$137,000 New
-
2003-09-09soldstatus $17,000
-
1998-10-07soldstatus $22,000
-
1991-12-16soldstatus $30,000
-
1991-04-17soldstatus $31,500
ⓘ Source: listings_history table (triggers on properties + properties_extension) + one-shot
backfill from property_details.listing_events for pre-trigger history.
Tax reassessment forecast MA · Partial reset (capped growth)
- Current annual tax
- $1,374 · $114/mo
- Projected year-2 tax
- $1,530 · $127/mo
- Expected delta
- +$156/yr (+$13/mo · 11.3%)
ⓘ Screening estimate from a state-policy table — verify with the county assessor before closing.
Climate risk First Street
- Flood 1/10 Low FEMA zone X (unshaded) · 0% chance over 30 yrs
- Wildfire 1/10 Low
- Heat 4/10 Moderate 7 d/yr ≥98°F today · 16 d/yr by 30 yrs out
- Wind 5/10 Major 26% chance of damaging wind over 30 yrs
- Air quality 2/10 Low 1 unhealthy d/yr today · 2 by 30 yrs out
Nearby sold comps map
Loading sold comps map…
Walkable amenities ~0.75 mi
Loading nearby amenities…
Taxation est. · year 1
- Rental income
- $19,749
- − Mortgage interest
- −$7,674
- − Property taxes
- −$1,374
- − Insurance
- −$685
- − Repairs & maintenance
- −$1,580
- − Management
- −$1,580
- − HOA
- −$4,284
- − Depreciation
- −$3,985
- Taxable loss
- −$1,414
- Est. tax savings @ 24.0%
- +$339
- After-tax cash flow
- $977/yr
For passive investors: Depreciation is non-cash, so a rental often shows a tax loss while cash-flowing — sheltering income. Rental losses are passive: they offset passive income freely, and up to $25,000/yr can offset ordinary (W-2) income if you actively participate and your MAGI is under $100k (phasing out to $0 by $150k); unused losses carry forward. On sale, claimed depreciation is recaptured at up to 25%, and gains may owe capital-gains tax (a 1031 exchange can defer both). Figures are a year-1 estimate at your 24.0% rate — not tax advice; consult a CPA.
Schools (NCES district)
- District
- Springfield
- NCES district ID
- 2511130
- Math proficiency
- 13% ▼ -12.00%
- Reading proficiency
- 25% ▼ -5.00%
- Median HH income
- $34,938
- Composite
- 15.6/100
- National rank
- #9293
- State rank
- #296 of 302 in MA
Livability — Springfield
- Score
- 73/100
- State rank
- #97
- US rank
- #5195
Category grades
Schools grade is shown separately in the Schools card above.
Census & demographics
- Census place
- Springfield, MA
- City population
- 61,006
- Population (ZIP)
- 11,469
Population outlook (Hampden County) Hauer SSP2
- Today (2025)
- 485,646 people
- By 2030
- 491,517 · +1.2%
- By 2040
- 500,539 · +3.1%
- By 2050
- 508,827 · +4.8%
- By 2075
- 539,167 · +11.0%
- By 2100
- 545,698 · +12.4%
Race, ethnicity, and origin ACS 2023
- Neighborhood character
- Predominantly Hispanic (74%)
- Race & ethnicity
- Hispanic / Latino 74% Two or more races 37% Black 14% White 10%
- Hispanic origin (detail)
- Puerto Rican 63% Dominican 5%
- Common ancestry
- Lithuanian 1% Romanian 1%
- Foreign-born
- 8% · Canada
- Languages at home
- 44% English-only · Spanish 53% Other Indo-European 2% French/Haitian/Cajun 1%
Political lean MEDSL · Hampden
- 2024 margin
- Lean D (+8.9) · D 53.4% · R 44.5% · Other 2.1%
- 2008→2024 swing
- -16.4pp toward R · 2008: 25.3pp · 2024: 8.9pp
- All cycles
- 2024: D+8.9 2020: D+17.7 2016: D+16.0 2012: D+25.4 2008: D+25.3
Not yet ingested
- Civics
- —
Market trends
- HPI YoY
- ▲ 1.08%
- Current HPI
- 322.6127
- Rent YoY
- —
- Metro
- —
- State GDP YoY
- ▲ 2.28%
- F500 in state
- 38
Industry mix (Fortune 500 HQ in MA)
| Industry | F500 HQs | Revenue |
|---|---|---|
| Technology | 3 | $17B |
|
||
| Insurance | 2 | $84B |
|
||
| Retail | 2 | $76B |
|
||
| Life Sciences | 1 | $43B |
|
||
| Energy Technology | 1 | $31B |
|
||
| Aerospace / Defense | 1 | $18B |
|
||
Price history
+334.9% since first listed5 events — show timeline
- 2026-05-23 Listed $137,000 MLS PIN
- 2003-09-09 Sold (Public Records) $17,000 Public Records
- 1998-10-07 Sold (Public Records) $22,000 Public Records
- 1991-12-16 Sold (Public Records) $30,000 Public Records
- 1991-04-17 Sold (Public Records) $31,500 Public Records
Property tax history
+1.7%/yrLatest (2023): $1,374 · +16.6% YoY. Source: county tax records.
Cash-flow waterfall
monthlySold comps — $/sqft
last 12 mo · ≤1 miLoading sold comps…