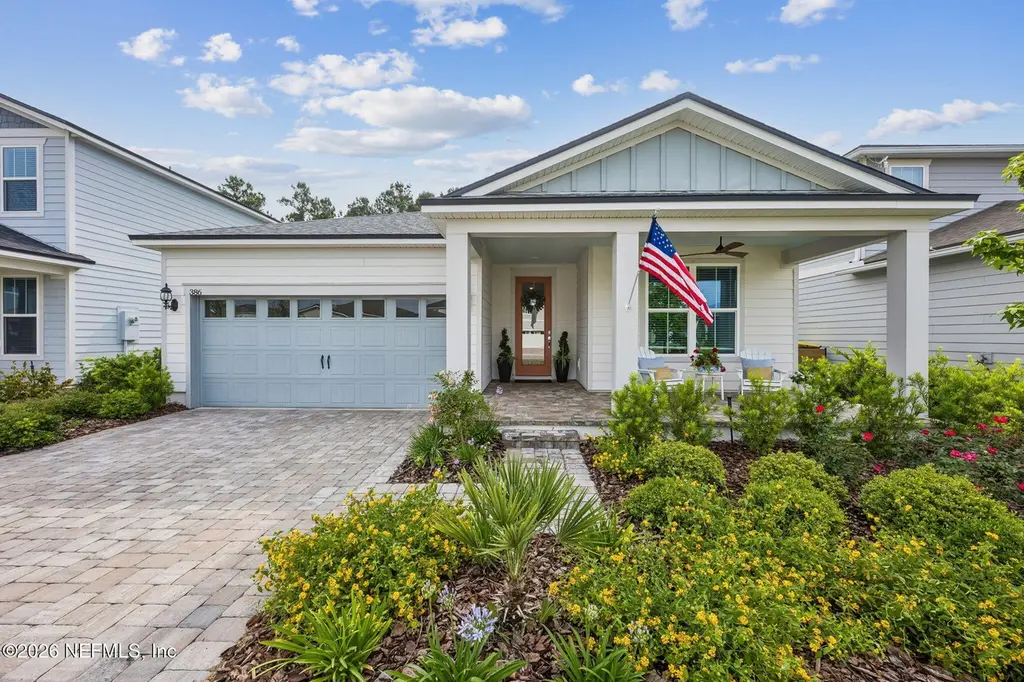
386 Saw Palmetto St · Yulee, FL
Flood risk 1/10 · Minimal
- FEMA flood zone
- X (unshaded)
- Chance of flooding over 30 yrs
- 0.0%
- Est. flood insurance / yr
- $507 – $1,088
Fire risk 5/10 · Moderate
- Est. fire insurance / yr
- $947 – $1,759
Heat risk 9/10 · Severe
- Hot days now (above 106°F)
- 7 days/yr
- Hot days in 30 yrs
- 20 days/yr
Wind risk 9/10 · Severe
- Chance of severe wind over 30 yrs
- 99.0%
Air-quality risk 5/10 · Moderate
- Unhealthy air days now
- 6 days/yr
- Unhealthy air days in 30 yrs
- 7 days/yr
Risk factors via First Street. Map © Google.
Why this score? — see what drove the D grade
The composite is a weighted blend of 9 inputs, each scored 0–100. Each bar is that input's sub-score; the figure is the points it added to the 100-point composite (weight × sub-score).
- ARV discount +12.6/15.0
- Appreciation +10.0/10.0
- Schools +6.0/10.0
- Cash flow +4.5/30.0
- Livability +3.3/5.0
- Rent growth +3.2/5.0
- Condition / age +2.5/5.0
- 1% rule +0.7/10.0
- DSCR +0.0/10.0
$499,900
🖨 Deal sheet 📄 Offer letter ✓ Due diligence
Listing remarks
Welcome to this better-than-new 2023 home in the highly sought-after Wildlight community! This meticulously maintained and extensively upgraded 3-bedroom, 2-bath home with flex room with more than 2,000 square feet of luxury living. Inside, you'll find upgraded wood flooring, designer Ballard Designs lighting and drapery, upgraded ceiling fans, and a bright open-concept layout for entertaining. The gourmet kitchen features top-of-the-line appliances, induction cooktop, modern finishes, ample prep space, and expansive three-panel sliding glass doors for seamless indoor/outdoor living. Relax on the electric screened lanai overlooking peaceful preserve views with no rear neighbors. Additional
Key facts
- Induction cooktop
- Preserve views
- Gourmet kitchen
Tags
Property features AI
Finance
- HOA & community: Community association with a monthly fee of $105; CDD fee applicable ($1,542)
Exterior
- Parking: 2-car garage with garage door opener; Has garage
- Utilities: Public sewer; Cable available; Electricity connected; Natural gas connected; Sewer connected; Water connected
- Home design: Single-family residence; Used for residential purposes
- Exterior features: Other exterior features
Interior
- Kitchen: Dishwasher; Electric oven; Induction cooktop; Microwave; Refrigerator; Tankless water heater
- Bedrooms: 3 bedrooms on main level (two 11 x 12 rooms and one 11 x 12 room)
- Bathrooms: 2 full bathrooms
- Heating & cooling: Central heating; Central air conditioning
- Interior features: 4 total rooms; Family room on main level (15 x 19)
- Laundry & utility: Tankless water heater (listed with appliances)
Neighborhood map
What this means for you Summary
Snapshot
- This is a 3-bed/2.0-bath single-family listed at $500k.
Deal economics
- At list price, monthly cash flow is $-1k ($-15k/yr) — negative.
- To cash-flow at today's rent, offer at most $274k (45.2% below list).
- To meet the 1% rule (rent ≥ 1% of price), the offer needs to be $285k (43.1% below list).
- Recommended offer: $274k (45.2% below list) — sets the bar for cash-flow.
Location & tenants
- Location reads 66/100 on livability (#605 in FL) — a middle-class / working-renter tenant base. Strengths: housing A+, cost of living A-, crime B+; Watch: amenities F, commute F, health & safety F.
- Nassau (town): math 74% / reading 65% proficiency, ranked #4 of 73 in FL (top 6%) — acceptable for families but not a draw, mixed tenant base, ~2y average lease.
- Market conditions: Rents rising (+2.9%/yr); 596 active listings in the ZIP; 5 comparable units currently listed for rent nearby; rentals at typical pace (median 22d on market — plan ~3-4 weeks tenant-placement turnaround); solid renter incomes; 953 units permitted in Nassau County in 2024 (24 in 5+ unit buildings).
- This rent runs 37% of the median local income ($93k/yr) — at the standard rent-burdened threshold; future hikes will face affordability resistance.
Forward outlook
- In year one you build about $53k of equity ($3k loan paydown + $50k appreciation (10.0% local appreciation)).
- Nassau County population projected at +17% by 2050 — long-run rental-demand tailwind backs the buy-and-hold thesis.
- By year 2, paydown + projected appreciation supports a ~$86k cash-out refi (75% LTV) — recoverable capital for the next deal without selling this one.
Negotiation context
- It's been on market 36 days — a 3% lower offer ($485k) is reasonable based on typical stale-listing flexibility.
- 5 sale attempts since 3y ago with the ask held roughly flat each time — persistent listings suggest the price (not the market) is what's stuck; bring a comps-based counter.
Risks & watch-outs
- Climate carrying-cost: severe wind risk, 99% chance of damaging wind over 30y; moderate wildfire risk; extreme-heat days projected 7→20/yr by 2055 (HVAC capex compounding) — expect insurance premiums to compound above CPI over the hold.
Questions for the listing agent
- What do current leases actually rent for vs. the listed asking? Can we see a recent rent roll and the last 12 months of T-12 income?
- It's been on market 36 days. Have you received any prior offers? Is the seller open to a 45% concession, seller financing, or rate buy-down credit?
- What does the HOA fee cover, when was the last increase, and are there any pending special assessments or reserve-fund shortfalls?
- Is there a deadline driving the sale (1031 exchange, divorce, estate, relocation)? That informs how much negotiation room exists.
- Schools are B-rated — typically a magnet for longer-tenancy family renters. What's the average tenant stay here, and is there a school-zone premium baked into asking?
- The area grade is low — what's the realistic commute time and amenity access for the typical tenant pool here? Any planned neighborhood developments (good or bad) we should know about?
- What's the average days-on-market for RENTAL listings here right now (not sales)? A rising rental-DOM trend means longer vacancies and softer asking-rent achievability than the comps imply.
- What's the recent tenant-quality profile in this submarket — average credit score on applications, eviction rate, late-payment / NSF rate, and stable-employment percentage? A property-management company in the area should have these aggregated.
- How much new for-sale + rental construction is in the pipeline within 1–3 miles? Heavy new supply typically softens prices + rents 12–24 months out; constrained supply supports both.
Investment metrics
- 1% rule
- 0.57% ✗
- Cap rate
- 3.23%
- Cash-on-cash
- -10.96%
- DSCR
- 0.51
- GRM
- 14.6
CMA / ARV
- ARV (on-the-fly)
- $563,584
- Comps found
- 12
Show comp detail 12 sales within ~0.75 mi
| Address | Dist | Beds/Ba | Sqft | Sold | Price | $/sf | Match |
|---|---|---|---|---|---|---|---|
| 314 Continuum Loop | 0.39mi | 3/2.5 | 2,183 (+5%) | 4mo | $738,316 | $338 | 67 |
| 729 Continuum Loop | 0.43mi | 2/2.0 (-1) | 1,973 (-5%) | 1mo | $465,000 | $236 | 66 |
| 292 Hawthorn Pk Cir | 0.41mi | 3/3.0 | 2,139 (+3%) | 8mo | $498,000 | $233 | 65 |
| 493 Continuum Loop | 0.29mi | 2/2.0 (-1) | 1,812 (-12%) | 2mo | $492,000 | $272 | 59 |
| 250 Daydream Ave | 0.53mi | 3/2.0 | 1,864 (-10%) | 1mo | $413,325 | $222 | 58 |
| 1404 Del Webb Pkwy | 0.64mi | 3/2.5 | 1,989 (-4%) | 4mo | $659,990 | $332 | 58 |
| 1065 Del Webb Pkwy | 0.60mi | 2/2.5 (-1) | 1,989 (-4%) | 2mo | $845,019 | $425 | 57 |
| 768 Continuum Lp | 0.46mi | 2/2.5 (-1) | 1,977 (-5%) | 9mo | $525,000 | $266 | 56 |
| 553 Stillwater Ln | 0.34mi | 3/2.5 | 1,820 (-12%) | 8mo | $390,990 | $215 | 55 |
| 241 Coveted Pl | 0.63mi | 3/2.5 | 2,179 (+5%) | 7mo | $725,000 | $333 | 54 |
| 277 Continuum | 0.40mi | 3/2.0 | 1,809 (-13%) | 8mo | $519,730 | $287 | 53 |
| 255 Julep St | 0.52mi | 3/2.0 | 1,763 (-15%) | 5mo | $435,000 | $247 | 47 |
Match score weights: distance 35% · size 25% · config 20% · recency 20%. Top-matched comps best support the ARV.
Projected returns pro-forma
10.0% appreciation · 2.88% rent growth · sell at horizon
- IRR
- 16.6%
- Equity multiple
- 2.36×
- Total profit
- $190,606
- Equity at exit
- $450,350
- IRR
- 15.8%
- Equity multiple
- 5.46×
- Total profit
- $624,794
- Equity at exit
- $971,196
Cash invested: $139,972 (down + closing). Projections, not guarantees.
Landlord ↔ Tenant lean methodology
- Overall (STATE)
- 87 Strongly Landlord-Friendly
- State Florida
- 87 Strongly Landlord-Friendly · R+3
- County
- — inherits STATE
- City
- — inherits STATE
ZIP-level market 32097
- Home prices YoY
- 19.5%
- Rents YoY
- 2.9%
- Active inventory
- 596
- Price-to-rent
- 14.6×
Monthly cashflow live
- Estimated rent
- $2,846 high interval (Pro) →
- Mortgage (P&I)
- −$2,622
- Tax from tax record
- −$592 /mo · $7,101/yr
- Insurance
- −$208
- HOA
- −$105
- Vacancy / Maint / Mgmt
- −$598
- Net cashflow
- $-1,278
Break-even live
UW: 25.0% down · 7.5% · 30yr · 1.5% tax · 5.0% vac · 8.0% maint · 8.0% mgmt
Financing live
Cash to close
- Down payment
- $124,975
- Closing costs
- $14,997
- Reserves months
- —
- Total cash needed
- —
Loan-product check · same deal, 3 products live
Conventional
25% down · 7.5% · 30yr
- Down + closing
- —
- Monthly P&I
- —
- Monthly cashflow
- —
- DSCR
- —
- Eligible?
- —
Personal DTI + credit; lowest rate.
DSCR
20% down · 8.5% · 30yr
- Down + closing
- —
- Monthly P&I
- —
- Monthly cashflow
- —
- DSCR
- —
- Eligible?
- —
No personal income docs; deal must DSCR.
Hard money
10% down · 12.0% · 12mo
- Down + closing
- —
- Monthly P&I
- —
- Monthly cashflow
- —
- DSCR
- —
- Eligible?
- —
Short-term bridge; refi at stabilization.
Rent comps 5 comps
| Address | Beds | Baths | Sqft | Rent | $/sqft | DOM | Units | Dist |
|---|---|---|---|---|---|---|---|---|
| 722 Cool Breeze Way Yulee, FL | 2.0 | 2.0 | 1541 | $3,100 | $2.01 | 21d | 1 | 0.41mi |
| 719 Cool Breeze Way Yulee, FL | 3.0 | 2.0 | 1575 | $2,995 | $1.90 | 12d | 1 | 0.44mi |
| 504 Blue Daze St Yulee, FL | 3.0 | 2.5 | 2038 | $2,595 | $1.27 | 23d | 1 | 0.50mi |
| 213 Daydream Ave Yulee, FL | 3.0 | 2.5 | 1876 | $2,950 | $1.57 | 23d | 1 | 0.55mi |
| 305 Whitby Dr Yulee, FL | 1.0–3.0 | 1.0–2.5 | 1279 | $2,815 | $2.20 | 2d | 45 | 0.75mi |
HOA detail
- Monthly dues
- $105 · $1,260/yr
- Likely covers
- electric
Listing history 30 events
-
2026-06-18days on market $499,900 Active 36 DOM
-
2026-06-17days on market $499,900 Active 35 DOM
-
2026-06-16days on market $499,900 Active 34 DOM
-
2026-06-15days on market $499,900 Active 33 DOM
-
2026-06-13days on market $499,900 Active 31 DOM
-
2026-06-13days on market $499,900 Active 30 DOM
-
2026-06-09days on market $499,900 Active 27 DOM
-
2026-06-08days on market $499,900 Active 26 DOM
-
2026-06-07days on market $499,900 Active 25 DOM
-
2026-06-05days on market $499,900 Active 22 DOM
-
2026-06-03days on market $499,900 Active 21 DOM
-
2026-06-02days on market $499,900 Active 20 DOM
-
2026-06-01days on market $499,900 Active 19 DOM
-
2026-05-31days on market $499,900 Active 18 DOM
-
2026-05-13$499,900 Active
-
2025-11-11historical
-
2025-10-06price $563,000
-
2025-10-06price $563,000
-
2025-07-11price $564,000
-
2025-07-11price $564,000
-
2025-06-13price $569,000
-
2025-06-13price $569,000
-
2025-06-02price $579,000
-
2025-06-02price $579,000
-
2025-04-11$589,000 Active
-
2025-04-11$589,000 Active
-
2024-03-23$593,000 Active
-
2023-08-14soldstatus $522,020
-
2023-04-01$522,020
-
2022-12-09soldstatus $845,000
ⓘ Source: listings_history table (triggers on properties + properties_extension) + one-shot
backfill from property_details.listing_events for pre-trigger history.
Tax reassessment forecast FL · Resets to sale price
- Current annual tax
- $7,101 · $592/mo
- Projected year-2 tax
- $7,101 · $592/mo
- Expected delta
- $0/yr ($0/mo · 0.0%)
ⓘ Screening estimate from a state-policy table — verify with the county assessor before closing.
Climate risk First Street
- Flood 1/10 Low FEMA zone X (unshaded) · 0% chance over 30 yrs
- Wildfire 5/10 Major
- Heat 9/10 Extreme 7 d/yr ≥106°F today · 20 d/yr by 30 yrs out
- Wind 9/10 Extreme 99% chance of damaging wind over 30 yrs
- Air quality 5/10 Major 6 unhealthy d/yr today · 7 by 30 yrs out
Nearby sold comps map
Loading sold comps map…
Walkable amenities ~0.75 mi
Loading nearby amenities…
Taxation est. · year 1
- Rental income
- $34,156
- − Mortgage interest
- −$28,002
- − Property taxes
- −$7,101
- − Insurance
- −$2,500
- − Repairs & maintenance
- −$2,732
- − Management
- −$2,732
- − HOA
- −$1,260
- − Depreciation
- −$14,543
- Taxable loss
- −$24,715
- Est. tax savings @ 24.0%
- +$5,931
- After-tax cash flow
- $-9,404/yr
For passive investors: Depreciation is non-cash, so a rental often shows a tax loss while cash-flowing — sheltering income. Rental losses are passive: they offset passive income freely, and up to $25,000/yr can offset ordinary (W-2) income if you actively participate and your MAGI is under $100k (phasing out to $0 by $150k); unused losses carry forward. On sale, claimed depreciation is recaptured at up to 25%, and gains may owe capital-gains tax (a 1031 exchange can defer both). Figures are a year-1 estimate at your 24.0% rate — not tax advice; consult a CPA.
Schools (NCES district)
- District
- Nassau
- NCES district ID
- 1201350
- Math proficiency
- 74% ▼ -2.00%
- Reading proficiency
- 65% ▼ -2.00%
- Median HH income
- $58,267
- Composite
- 59.79/100
- National rank
- #899
- State rank
- #4 of 73 in FL
Livability — Yulee
- Score
- 66/100
- State rank
- #605
- US rank
- #11615
Category grades
Schools grade is shown separately in the Schools card above.
Census & demographics
- County
- Nassau County · 67,729 people
- City population
- 26,700
- Metro
- Jacksonville, FL
- Population (ZIP)
- 26,700
- Household income
- $93,161
- Rent vs Own
- Severe rent burden
- 404.0
Population outlook (Nassau County) Hauer SSP2
- Today (2025)
- 88,419 people
- By 2030
- 92,679 · +4.8%
- By 2040
- 99,257 · +12.3%
- By 2050
- 103,378 · +16.9%
- By 2075
- 109,726 · +24.1%
- By 2100
- 107,006 · +21.0%
Race, ethnicity, and origin ACS 2023
- Neighborhood character
- Predominantly White (75%)
- Race & ethnicity
- White 75% Two or more races 9% Black 9% Hispanic / Latino 8% Asian 1% Native American 1%
- Hispanic origin (detail)
- Mexican 2% Puerto Rican 2%
- Common ancestry
- Lithuanian 4% Italian 3% Romanian 2%
- Foreign-born
- 4% · Canada, Vietnam
- Languages at home
- 93% English-only · Spanish 5% Vietnamese 1%
Political lean MEDSL · Nassau
- 2024 margin
- Solid R (+46.9) · D 26.1% · R 73.1%
- 2008→2024 swing
- -3.1pp toward R · 2008: -43.8pp · 2024: -46.9pp
- All cycles
- 2024: R+46.9 2020: R+45.9 2016: R+50.2 2012: R+48.6 2008: R+43.8
Not yet ingested
- Civics
- —
Market trends
- HPI YoY
- ▲ 49.35%
- Current HPI
- 301.9299
- Rent YoY
- ▲ 2.88%
- Metro
- Jacksonville, FL
- State GDP YoY
- ▲ 3.28%
- F500 in state
- 36
Industry mix (Fortune 500 HQ in FL)
| Industry | F500 HQs | Revenue |
|---|---|---|
| Industrial Technology | 2 | $29B |
|
||
| Insurance | 2 | $17B |
|
||
| Retail | 1 | $60B |
|
||
| Technology Distribution | 1 | $58B |
|
||
| Homebuilding | 1 | $35B |
|
||
| Technology Manufacturing | 1 | $35B |
|
||
Price history
-40.8% since first listed16 events — show timeline
- 2026-05-13 Listed $499,900 realMLS
- 2025-11-11 Listing Removed — realMLS
- 2025-10-06 Price Changed $563,000 realMLS
- 2025-10-06 Price Changed $563,000 AINCAR
- 2025-07-11 Price Changed $564,000 realMLS
- 2025-07-11 Price Changed $564,000 AINCAR
- 2025-06-13 Price Changed $569,000 realMLS
- 2025-06-13 Price Changed $569,000 AINCAR
- 2025-06-02 Price Changed $579,000 realMLS
- 2025-06-02 Price Changed $579,000 AINCAR
- 2025-04-11 Listed $589,000 realMLS
- 2025-04-11 Listed $589,000 AINCAR
- 2024-03-23 Listed $593,000 AINCAR
- 2023-08-14 Sold (MLS) $522,020 realMLS
- 2023-04-01 Listed $522,020 realMLS
- 2022-12-09 Sold (Public Records) $845,000 Public Records
Property tax history
+37.5%/yrLatest (2025): $7,101 · +1.6% YoY. Source: county tax records.
Cash-flow waterfall
monthlySold comps — $/sqft
last 12 mo · ≤1 miLoading sold comps…