 11-Plex
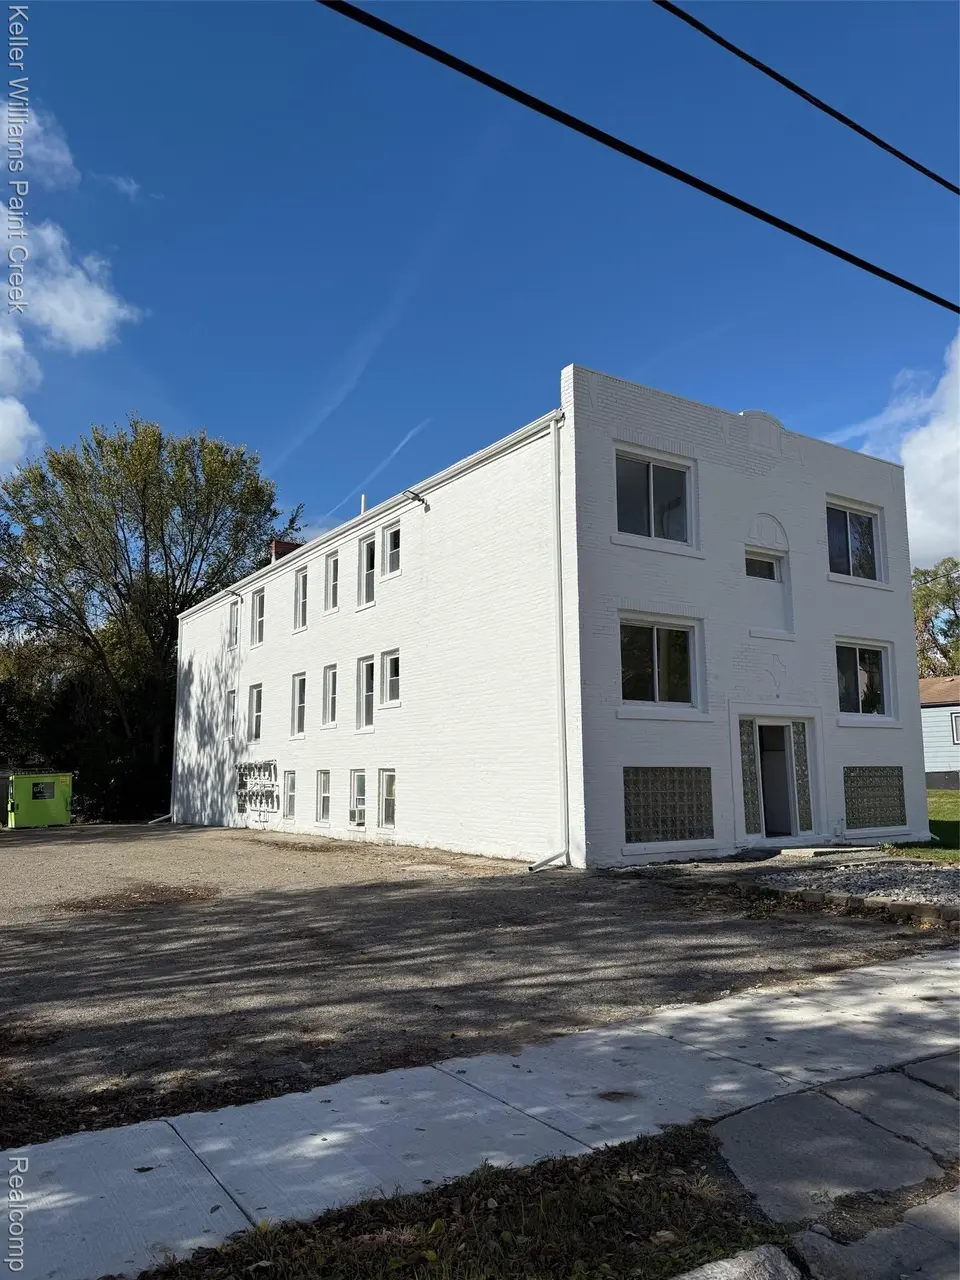
98 S Edith St · Pontiac, MI
Flood risk 3/10 · Minor
- FEMA flood zone
- X (unshaded)
- Chance of flooding over 30 yrs
- 0.2%
- Est. flood insurance / yr
- $473 – $860
Fire risk 1/10 · Minimal
- Est. fire insurance / yr
- $784 – $1,456
Heat risk 2/10 · Minimal
- Hot days now (above 96°F)
- 7 days/yr
- Hot days in 30 yrs
- 15 days/yr
Wind risk 2/10 · Minimal
- Chance of severe wind over 30 yrs
- —
Air-quality risk 3/10 · Minor
- Unhealthy air days now
- 2 days/yr
- Unhealthy air days in 30 yrs
- 4 days/yr
Risk factors via First Street. Map © Google.
Why this score? — see what drove the B- grade
The composite is a weighted blend of 9 inputs, each scored 0–100. Each bar is that input's sub-score; the figure is the points it added to the 100-point composite (weight × sub-score).
- Cash flow +30.0/30.0
- 1% rule +10.0/10.0
- DSCR +10.0/10.0
- ARV discount +7.5/15.0
- Livability +3.2/5.0
- Rent growth +2.5/5.0
- Condition / age +2.5/5.0
- Schools +1.0/10.0
- Appreciation +0.0/10.0
$700,000
🖨 Deal sheet 📄 Offer letter ✓ Due diligence
Multi-family units
County records classify this as Multi-Family (5+ Unit). Listing-text estimate: 11 units. confirmed
5+ unit building — per-unit beds/baths from public records are typically unavailable; the breakdown below (if shown) is an estimate from the listing text.
Listing remarks MLS
Great investment property in a highly profitable area! This 11-unit apartment building just had renovations finished last week. 10 out of the 11 units were fully renovated. The building has updated breaker boxes, and the roof was just recoated in the fall. There are laundry hook-ups on site with the potential for coin laundry. All units have separate gas and electric meters. Total Market Rent- $10,225 (One beds $975, Studios $875) Utilities not paid by tenants - $740-840/month Insurance - $525/month Taxes - $7,300/year
Key facts
- New kitchens
- New pex plumbing
- New flooring
Tags
Neighborhood map
What this means for you Summary
Snapshot
- This is a 11 × 1-bed/1-bath units multifamily listed at $700k.
Deal economics
- At list price, monthly cash flow is $4k ($50k/yr) — positive. Per door: $377/mo.
- The deal already cash-flows at list — no discount required.
- Meets the 1% rule at list price ($11k rent vs $700k).
- Recommended offer: $616k (12.0% below list) — sets the bar for market timing.
- Cap rate 13.4% vs local median 6.7% in Pontiac — top-decile yield for the area; either an underpriced asset or a hidden risk that comps aren't pricing in. Stress-test before assuming the spread holds.
Location & tenants
- Location reads 64/100 on livability (#499 in MI) — a middle-class / working-renter tenant base. Strengths: commute A+, cost of living A+, housing A+; Watch: health & safety D, schools F, crime F.
- Pontiac City School District (urban): math 8% / reading 17% proficiency, ranked #514 of 540 in MI (top 95%) — low school quality limits family demand, transient renter base, plan for 1-2y turnover; 81% free/reduced lunch — lower-income household profile, screen leases tightly.
- Market conditions: 87 active listings in the ZIP; 2,614 units permitted in Oakland County in 2024 (721 in 5+ unit buildings).
Forward outlook
- Local home prices are declining (-3.0%/yr); year-one equity from $5k of loan paydown is wiped out by about $21k of value loss. Plan a longer hold.
- Oakland County population projected at +10% by 2050 — modest demand growth; plan on rents tracking national, not racing it.
- At projected returns (-3.0% appreciation + 3.0% rent growth), your $196k cash investment doubles in ~5 years — after that, you're playing with house money.
Negotiation context
- It's been on market 123 days — a 12% lower offer ($616k) is reasonable based on typical stale-listing flexibility.
- 5 sale attempts since 5y ago; this cycle's ask has dropped $125k (15%) from the opening price — seller is motivated, your offer sets the floor, not the list.
- Current owner paid $310k; list at $700k implies a 126% gain — meaningful room to come down on a strong offer.
Risks & watch-outs
- Watch-outs: built in 1930 — expect roof / HVAC / electrical / plumbing capex.
Questions for the listing agent
- It's been on market 123 days. Have you received any prior offers? Is the seller open to a 12% concession, seller financing, or rate buy-down credit?
- Can we see the unit-by-unit rent roll, current vacancy, and any below-market leases? What's the average tenancy length?
- What capital expenditures (roof, boiler, parking lot, exteriors) have been made in the last 5 years, and what's planned in the next 2?
- Built in 1930 — when were the roof, HVAC, electrical panel, plumbing, and water heater last replaced?
- Why hasn't it sold? Are there any deal-killer items the seller is aware of (foundation, flood, title, zoning, code violations)?
- Is there a deadline driving the sale (1031 exchange, divorce, estate, relocation)? That informs how much negotiation room exists.
- Schools are F-rated, which usually means shorter tenancies and higher turnover. Who's the typical renter profile here, and what's been the actual vacancy rate?
- Crime grade is F in this area — have there been break-ins, vandalism, or insurance claims at this property in the last 3 years? What carrier currently insures it and at what premium?
- What's the average days-on-market for RENTAL listings here right now (not sales)? A rising rental-DOM trend means longer vacancies and softer asking-rent achievability than the comps imply.
- What's the recent tenant-quality profile in this submarket — average credit score on applications, eviction rate, late-payment / NSF rate, and stable-employment percentage? A property-management company in the area should have these aggregated.
- How much new apartment / multifamily construction is in the pipeline within 1–3 miles? Heavy new supply (>2% of stock underway) typically softens rents 12–24 months out; light construction supports rent growth.
Investment metrics
- 1% rule
- 1.57% ✓
- Cap rate
- 13.40%
- Cash-on-cash
- 25.38%
- DSCR
- 2.13
- GRM
- 5.3
CMA / ARV
- ARV (median comp)
- $277,207
- List price
- $700,000
- Delta
- 152.52%
- Verdict
- OVERPRICED
- Comps
- 2 within 2.0 mi
Projected returns pro-forma
-3.0% appreciation · 3.0% rent growth · sell at horizon
- IRR
- 18.9%
- Equity multiple
- 1.77×
- Total profit
- $150,600
- Equity at exit
- $104,372
- IRR
- 27.3%
- Equity multiple
- 3.40×
- Total profit
- $471,089
- Equity at exit
- $60,523
Cash invested: $196,000 (down + closing). Projections, not guarantees.
Landlord ↔ Tenant lean methodology
- Overall (STATE)
- 62 Landlord-Friendly
- State Michigan
- 62 Landlord-Friendly · EVEN
- County
- — inherits STATE
- City
- — inherits STATE
ZIP-level market 48342
- Home prices YoY
- -33.8%
- Active inventory
- 87
- Price-to-rent
- 58.3×
Monthly cashflow live
- Estimated rent
- $11,006 medium interval (Pro) →
- Mortgage (P&I)
- −$3,671
- Tax from tax record
- −$587 /mo · $7,038/yr
- Insurance
- −$292
- HOA
- −$0
- Vacancy / Maint / Mgmt
- −$2,311
- Net cashflow
- $4,146
Break-even live
11-unit breakdown (identical units grouped — click to expand)
| Units | Beds | Baths | Est. rent |
|---|---|---|---|
| 11× units | 1 | 1 | $11,011 |
| #1 | 1 | 1 | $1,001 |
| #2 | 1 | 1 | $1,001 |
| #3 | 1 | 1 | $1,001 |
| #4 | 1 | 1 | $1,001 |
| #5 | 1 | 1 | $1,001 |
| #6 | 1 | 1 | $1,001 |
| #7 | 1 | 1 | $1,001 |
| #8 | 1 | 1 | $1,001 |
| #9 | 1 | 1 | $1,001 |
| #10 | 1 | 1 | $1,001 |
| #11 | 1 | 1 | $1,001 |
| Total (11 units) | $11,006 | ||
UW: 25.0% down · 7.5% · 30yr · 1.5% tax · 5.0% vac · 8.0% maint · 8.0% mgmt
Financing live
Cash to close
- Down payment
- $175,000
- Closing costs
- $21,000
- Reserves months
- —
- Total cash needed
- —
Loan-product check · same deal, 3 products live
Conventional
25% down · 7.5% · 30yr
- Down + closing
- —
- Monthly P&I
- —
- Monthly cashflow
- —
- DSCR
- —
- Eligible?
- —
Personal DTI + credit; lowest rate.
DSCR
20% down · 8.5% · 30yr
- Down + closing
- —
- Monthly P&I
- —
- Monthly cashflow
- —
- DSCR
- —
- Eligible?
- —
No personal income docs; deal must DSCR.
Hard money
10% down · 12.0% · 12mo
- Down + closing
- —
- Monthly P&I
- —
- Monthly cashflow
- —
- DSCR
- —
- Eligible?
- —
Short-term bridge; refi at stabilization.
Listing history 32 events
-
2026-06-18days on market $700,000 Active 123 DOM
-
2026-06-17days on market $700,000 Active 122 DOM
-
2026-06-16days on market $700,000 Active 121 DOM
-
2026-06-15days on market $700,000 Active 120 DOM
-
2026-06-13days on market $700,000 Active 118 DOM
-
2026-06-13days on market $700,000 Active 117 DOM
-
2026-06-09days on market $700,000 Active 114 DOM
-
2026-06-08days on market $700,000 Active 113 DOM
-
2026-06-07days on market $700,000 Active 112 DOM
-
2026-06-04days on market $700,000 Active 109 DOM
-
2026-06-03days on market $700,000 Active 108 DOM
-
2026-06-02days on market $700,000 Active 107 DOM
-
2026-06-01days on market $700,000 Active 106 DOM
-
2026-05-31days on market $700,000 Active 105 DOM
-
2026-03-05price $700,000 524-char remark
Show marketing remark (525 chars)
Great investment property in a highly profitable area! This 11-unit apartment building just had renovations finished last week. 10 out of the 11 units were fully renovated. The building has updated breaker boxes, and the roof was just recoated in the fall. There are laundry hook-ups on site with the potential for coin laundry. All units have separate gas and electric meters. Total Market Rent- $10,225 (One beds $975, Studios $875) Utilities not paid by tenants - $740-840/month Insurance - $525/month Taxes - $7,300/year
-
2026-03-05price $700,000 525-char remark
Show marketing remark (525 chars)
Great investment property in a highly profitable area! This 11-unit apartment building just had renovations finished last week. 10 out of the 11 units were fully renovated. The building has updated breaker boxes, and the roof was just recoated in the fall. There are laundry hook-ups on site with the potential for coin laundry. All units have separate gas and electric meters. Total Market Rent- $10,225 (One beds $975, Studios $875) Utilities not paid by tenants - $740-840/month Insurance - $525/month Taxes - $7,300/year
-
2026-02-16$825,000 Active 525-char remark
Show marketing remark (525 chars)
Great investment property in a highly profitable area! This 11-unit apartment building just had renovations finished last week. 10 out of the 11 units were fully renovated. The building has updated breaker boxes, and the roof was just recoated in the fall. There are laundry hook-ups on site with the potential for coin laundry. All units have separate gas and electric meters. Total Market Rent- $10,225 (One beds $975, Studios $875) Utilities not paid by tenants - $740-840/month Insurance - $525/month Taxes - $7,300/year
-
2026-02-15$825,000 Active 524-char remark
Show marketing remark (524 chars)
Great investment property in a highly profitable area! This 11-unit apartment building just had renovations finished last week. 10 out of the 11 units were fully renovated. The building has updated breaker boxes, and the roof was just recoated in the fall. There are laundry hook-ups on site with the potential for coin laundry. All units have separate gas and electric meters. Total Market Rent- $10,225 (One beds $975, Studios $875) Utilities not paid by tenants - $740-840/month Insurance - $525/month Taxes - $7,300/year
-
2025-02-07historical
-
2024-12-17status Pending
-
2024-10-04status Pending
-
2024-10-04status Pending
-
2024-10-04historical
-
2024-08-23price $370,000
-
2024-08-23price $370,000
-
2024-07-25$399,900 Active
-
2024-07-25$399,900 Active
-
2021-09-03soldstatus $310,000
-
2021-05-21soldstatus $310,000
-
2021-04-26$319,000
-
2002-07-01soldstatus $48,500
-
1993-06-01soldstatus $44,000
ⓘ Source: listings_history table (triggers on properties + properties_extension) + one-shot
backfill from property_details.listing_events for pre-trigger history.
Tax reassessment forecast MI · Partial reset (capped growth)
- Current annual tax
- $7,038 · $587/mo
- Projected year-2 tax
- $8,909 · $742/mo
- Expected delta
- +$1,871/yr (+$156/mo · 26.6%)
ⓘ Screening estimate from a state-policy table — verify with the county assessor before closing.
Climate risk First Street
- Flood 3/10 Moderate FEMA zone X (unshaded) · 20% chance over 30 yrs
- Wildfire 1/10 Low
- Heat 2/10 Low 7 d/yr ≥96°F today · 15 d/yr by 30 yrs out
- Wind 2/10 Low
- Air quality 3/10 Moderate 2 unhealthy d/yr today · 4 by 30 yrs out
Nearby sold comps map
Loading sold comps map…
Walkable amenities ~0.75 mi
Loading nearby amenities…
Taxation est. · year 1
- Rental income
- $132,072
- − Mortgage interest
- −$39,211
- − Property taxes
- −$7,038
- − Insurance
- −$3,500
- − Repairs & maintenance
- −$10,566
- − Management
- −$10,566
- − Depreciation
- −$20,364
- Taxable income
- $40,828
- Est. tax owed @ 24.0%
- −$9,799
- After-tax cash flow
- $39,950/yr
For passive investors: Depreciation is non-cash, so a rental often shows a tax loss while cash-flowing — sheltering income. Rental losses are passive: they offset passive income freely, and up to $25,000/yr can offset ordinary (W-2) income if you actively participate and your MAGI is under $100k (phasing out to $0 by $150k); unused losses carry forward. On sale, claimed depreciation is recaptured at up to 25%, and gains may owe capital-gains tax (a 1031 exchange can defer both). Figures are a year-1 estimate at your 24.0% rate — not tax advice; consult a CPA.
Schools (NCES district)
- District
- Pontiac City School District
- NCES district ID
- 2628740
- Math proficiency
- 8% ▼ -5.00%
- Reading proficiency
- 17% ▼ -3.00%
- Median HH income
- $33,888
- Composite
- 10.12/100
- National rank
- #9802
- State rank
- #514 of 540 in MI
Livability — Pontiac
- Score
- 64/100
- State rank
- #499
- US rank
- #14703
Category grades
Schools grade is shown separately in the Schools card above.
Census & demographics
- Census place
- Pontiac, MI
- City population
- 44,593
- Population (ZIP)
- 17,227
Population outlook (Oakland County) Hauer SSP2
- Today (2025)
- 1,335,747 people
- By 2030
- 1,375,100 · +2.9%
- By 2040
- 1,435,385 · +7.5%
- By 2050
- 1,469,250 · +10.0%
- By 2075
- 1,531,946 · +14.7%
- By 2100
- 1,450,485 · +8.6%
Race, ethnicity, and origin ACS 2023
- Neighborhood character
- Diverse neighborhood (Simpson 0.62)
- Race & ethnicity
- Black 57% Hispanic / Latino 19% White 13% Two or more races 13% Asian 4%
- Hispanic origin (detail)
- Mexican 11% Puerto Rican 2%
- Common ancestry
- Romanian 1% Lithuanian 1% Italian 1%
- Foreign-born
- 10% · Canada, Vietnam
- Languages at home
- 79% English-only · Spanish 15% Other Asian/Pacific 4% Other Indo-European 1%
Political lean MEDSL · Oakland
- 2024 margin
- D (+10.6) · D 54.4% · R 43.8% · Other 1.9%
- 2008→2024 swing
- -3.9pp toward R · 2008: 14.5pp · 2024: 10.6pp
- All cycles
- 2024: D+10.6 2020: D+14.1 2016: D+8.1 2012: D+8.1 2008: D+14.5
Not yet ingested
- Civics
- —
Market trends
- HPI YoY
- ▼ -109.18%
- Current HPI
- 214.3258
- Rent YoY
- —
- Metro
- —
- State GDP YoY
- ▲ 1.37%
- F500 in state
- 28
Industry mix (Fortune 500 HQ in MI)
| Industry | F500 HQs | Revenue |
|---|---|---|
| Automotive Parts | 3 | $48B |
|
||
| Automotive | 2 | $372B |
|
||
| Chemicals | 1 | $45B |
|
||
| Automotive Retail | 1 | $29B |
|
||
| Healthcare / Medical Devices | 1 | $23B |
|
||
| Automotive Technology | 1 | $20B |
|
||
Price history
+1490.9% since first listed18 events — show timeline
- 2026-03-05 Price Changed $700,000 MiRealSource-MiMLS
- 2026-03-05 Price Changed $700,000 REALCOMP
- 2026-02-16 Listed $825,000 REALCOMP
- 2026-02-15 Listed $825,000 MiRealSource-MiMLS
- 2025-02-07 Listing Removed — REALCOMP
- 2024-12-17 Pending — REALCOMP
- 2024-10-04 Pending — REALCOMP
- 2024-10-04 Pending — MiRealSource-MiMLS
- 2024-10-04 Listing Removed — MiRealSource-MiMLS
- 2024-08-23 Price Changed $370,000 MiRealSource-MiMLS
- 2024-08-23 Price Changed $370,000 REALCOMP
- 2024-07-25 Listed $399,900 MiRealSource-MiMLS
- 2024-07-25 Listed $399,900 REALCOMP
- 2021-09-03 Sold (Public Records) $310,000 Public Records
- 2021-05-21 Sold (MLS) $310,000 MiRealSource-MiMLS
- 2021-04-26 Listed $319,000 MiRealSource-MiMLS
- 2002-07-01 Sold (Public Records) $48,500 Public Records
- 1993-06-01 Sold (Public Records) $44,000 Public Records
Property tax history
+3.6%/yrLatest (2025): $7,038 · -26.3% YoY. Source: county tax records.
Cash-flow waterfall
monthlySold comps — $/sqft
last 12 mo · ≤1 miLoading sold comps…