12530 Royal Rd #46 · Winter Gardens, CA
Flood risk 5/10 · Moderate
- FEMA flood zone
- X (unshaded)
- Chance of flooding over 30 yrs
- 0.27%
- Est. flood insurance / yr
- $507 – $1,088
Fire risk 6/10 · Moderate
- Est. fire insurance / yr
- $659 – $1,223
Heat risk 5/10 · Moderate
- Hot days now (above 98°F)
- 5 days/yr
- Hot days in 30 yrs
- 13 days/yr
Wind risk 1/10 · Minimal
- Chance of severe wind over 30 yrs
- —
Air-quality risk 4/10 · Minor
- Unhealthy air days now
- 6 days/yr
- Unhealthy air days in 30 yrs
- 7 days/yr
Risk factors via First Street. Map © Google.
Why this score? — see what drove the B- grade
The composite is a weighted blend of 9 inputs, each scored 0–100. Each bar is that input's sub-score; the figure is the points it added to the 100-point composite (weight × sub-score).
- Cash flow +30.0/30.0
- DSCR +10.0/10.0
- 1% rule +9.9/10.0
- ARV discount +7.1/15.0
- Schools +4.0/10.0
- Livability +3.1/5.0
- Condition / age +2.5/5.0
- Rent growth +2.3/5.0
- Appreciation +0.0/10.0
$204,995
🖨 Deal sheet 📄 Offer letter ✓ Due diligence
Listing remarks
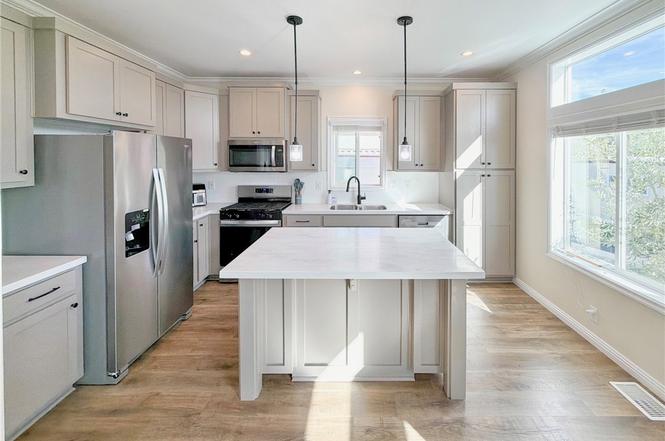
2024 Silvercrest home offering approx. 1,092 sq. ft. of bright, open living with 3 bedrooms and 2 baths. This well-appointed residence features new kitchen appliances, in-home washer/dryer connections, two-car parking, and professionally maintained landscaping. Enjoy community amenities including a swimming pool, laundry room, clubhouse and professional on-site management. Located in a quiet residential neighborhood close to restaurants, shopping and local conveniences — ideal for comfortable SoCal living.
Key facts
- Clubhouse
- Community amenities
- Laundry room
Tags
Property features AI
Finance
- Other: Park name: Knolls' Mobile Estates; Manager approval required; Located at top of the hill per directions
- HOA & community: Land lease community - land lease $1,750
Exterior
- Parking: Located in Knolls' Mobile Estates
- Utilities: Public sewer; District/Public water
- Home design: Single-story mobile home; Front entry; Mobile home remains on lot
- Construction: Mobile home approximately 13 ft by 42 ft; One story; Year built listed by builder
- Exterior features: Community pool; Yard; Street lighting
Interior
- Bathrooms: 2 full bathrooms
- Interior features: Front entry
- Laundry & utility: Washer hookup; Gas dryer hookup
Neighborhood map
What this means for you Summary
Snapshot
- This is a 3-bed/2.0-bath manufactured listed at $205k.
Deal economics
- At list price, monthly cash flow is $994 ($12k/yr) — positive.
- The deal already cash-flows at list — no discount required.
- Meets the 1% rule at list price ($3k rent vs $205k).
- Recommended offer: $180k (12.0% below list) — sets the bar for market timing.
- Cap rate 12.1% vs local median 2.7% in Winter Gardens — top-decile yield for the area; either an underpriced asset or a hidden risk that comps aren't pricing in. Stress-test before assuming the spread holds.
Location & tenants
- Location reads 61/100 on livability (#515 in CA) — a middle-class / working-renter tenant base. Strengths: commute A+, employment A-, housing A-; Watch: crime D-, amenities F, cost of living F.
- Grossmont Union High (suburban): math 31% / reading 60% proficiency, ranked #173 of 517 in CA (top 34%) — families likely to look elsewhere, expect single-tenant / working-renter base with shorter leases; only 17% free/reduced lunch — higher-income household profile.
- Zoned schools: El Capitan High (math 20% / reading 54%, grade F, #578 of 1,170 statewide, top 51%, 1,825 students, 52% FRL) — zoned schools average 52% FRL vs 17% district-wide (36 pts higher); higher-poverty schools than district average — tighter screening recommended.
- Market conditions: Rents soft (-0.8%/yr); 238 active listings in the ZIP; 10 comparable units currently listed for rent nearby; rentals leasing fast (median 2d on market — plan ~1-2 weeks tenant-placement turnaround); 11,759 units permitted in San Diego County in 2024 (7,244 in 5+ unit buildings).
- At $3,051/mo this rent would consume 49% of the median local household income ($74k/yr) (locally 4178% of renters already pay >50% of income on rent) — very limited rent-growth headroom before tenants either downsize or default.
Forward outlook
- Local home prices are declining (-3.0%/yr); year-one equity from $1k of loan paydown is wiped out by about $6k of value loss. Plan a longer hold.
- San Diego County population projected at +20% by 2050 — long-run rental-demand tailwind backs the buy-and-hold thesis.
- At projected returns (-3.0% appreciation + 0.0% rent growth), your $57k cash investment doubles in ~8 years — after that, you're playing with house money.
Negotiation context
- It's been on market 136 days — a 12% lower offer ($180k) is reasonable based on typical stale-listing flexibility.
Risks & watch-outs
- Climate carrying-cost: moderate flood risk; major wildfire risk; extreme-heat days projected 5→13/yr by 2055 (HVAC capex compounding) — expect insurance premiums to compound above CPI over the hold.
Questions for the listing agent
- It's been on market 136 days. Have you received any prior offers? Is the seller open to a 12% concession, seller financing, or rate buy-down credit?
- Why hasn't it sold? Are there any deal-killer items the seller is aware of (foundation, flood, title, zoning, code violations)?
- Is there a deadline driving the sale (1031 exchange, divorce, estate, relocation)? That informs how much negotiation room exists.
- Crime grade is D in this area — have there been break-ins, vandalism, or insurance claims at this property in the last 3 years? What carrier currently insures it and at what premium?
- What's the average days-on-market for RENTAL listings here right now (not sales)? A rising rental-DOM trend means longer vacancies and softer asking-rent achievability than the comps imply.
- What's the recent tenant-quality profile in this submarket — average credit score on applications, eviction rate, late-payment / NSF rate, and stable-employment percentage? A property-management company in the area should have these aggregated.
- How much new for-sale + rental construction is in the pipeline within 1–3 miles? Heavy new supply typically softens prices + rents 12–24 months out; constrained supply supports both.
Investment metrics
- 1% rule
- 1.49% ✓
- Cap rate
- 12.11%
- Cash-on-cash
- 20.78%
- DSCR
- 1.92
- GRM
- 5.6
CMA / ARV
- ARV (on-the-fly)
- $203,112
- Comps found
- 12
Show comp detail 12 sales within ~0.75 mi
| Address | Dist | Beds/Ba | Sqft | Sold | Price | $/sf | Match |
|---|---|---|---|---|---|---|---|
| 12970 Highway 8 Business #35 | 0.35mi | 2/2.0 (-1) | 1,040 (-5%) | 16mo | $125,000 | $120 | 57 |
| 13162 Highway 8 Business SPC 4 | 0.61mi | 3/2.0 | 1,147 (+5%) | 8mo | $213,000 | $186 | 57 |
| 12970 Highway 8 Business #104 | 0.39mi | 3/2.0 | 1,190 (+9%) | 13mo | $150,000 | $126 | 56 |
| 13162 Highway Business 8 #198 | 0.61mi | 3/2.0 | 1,040 (-5%) | 12mo | $230,000 | $221 | 53 |
| 12044 Royal Rd #63 | 0.63mi | 3/2.0 | 1,000 (-8%) | 5mo | $257,321 | $257 | 52 |
| 12250 Vista Del Cajon Rd #17 | 0.31mi | 3/2.0 | 1,248 (+14%) | 14mo | $275,000 | $220 | 49 |
| 12250 Vista Del Cajon Rd Spc 45 | 0.37mi | 3/2.0 | 1,248 (+14%) | 14mo | $183,000 | $147 | 47 |
| 12044 Royal Rd #28 | 0.63mi | 3/2.0 | 1,128 (+3%) | 22mo | $180,000 | $160 | 46 |
| 13162 Highway 8 Business Spc 94 | 0.73mi | 3/2.0 | 1,120 (+3%) | 20mo | $230,000 | $205 | 45 |
| 12250 Vista Del Cajon Rd #37 | 0.37mi | 3/2.0 | 1,248 (+14%) | 24mo | $315,000 | $252 | 39 |
| 13162 Highway 8 Business #115 | 0.61mi | 2/2.0 (-1) | 1,020 (-7%) | 20mo | $130,500 | $128 | 38 |
| 13162 Highway 8 Business #52 | 0.61mi | 3/2.0 | 1,248 (+14%) | 22mo | $205,000 | $164 | 29 |
Match score weights: distance 35% · size 25% · config 20% · recency 20%. Top-matched comps best support the ARV.
Projected returns pro-forma
-3.0% appreciation · 0.0% rent growth · sell at horizon
- IRR
- 9.7%
- Equity multiple
- 1.37×
- Total profit
- $21,188
- Equity at exit
- $30,565
- IRR
- 16.2%
- Equity multiple
- 2.14×
- Total profit
- $65,591
- Equity at exit
- $17,724
Cash invested: $57,399 (down + closing). Projections, not guarantees.
Landlord ↔ Tenant lean methodology
- Overall (STATE)
- 18 Strongly Tenant-Friendly
- State California
- 18 Strongly Tenant-Friendly · D+13
- County
- — inherits STATE
- City
- — inherits STATE
ZIP-level market 92021
- Rents YoY
- -0.8%
- Active inventory
- 238
- Price-to-rent
- 5.6×
Monthly cashflow live
- Estimated rent
- $3,051 high interval (Pro) →
- Mortgage (P&I)
- −$1,075
- Tax est. 1.5%
- −$256 /mo · $3,075/yr
- Insurance
- −$85
- HOA
- −$0
- Vacancy / Maint / Mgmt
- −$641
- Net cashflow
- $994
Break-even live
UW: 25.0% down · 7.5% · 30yr · 1.5% tax · 5.0% vac · 8.0% maint · 8.0% mgmt
Financing live
Cash to close
- Down payment
- $51,249
- Closing costs
- $6,150
- Reserves months
- —
- Total cash needed
- —
Loan-product check · same deal, 3 products live
Conventional
25% down · 7.5% · 30yr
- Down + closing
- —
- Monthly P&I
- —
- Monthly cashflow
- —
- DSCR
- —
- Eligible?
- —
Personal DTI + credit; lowest rate.
DSCR
20% down · 8.5% · 30yr
- Down + closing
- —
- Monthly P&I
- —
- Monthly cashflow
- —
- DSCR
- —
- Eligible?
- —
No personal income docs; deal must DSCR.
Hard money
10% down · 12.0% · 12mo
- Down + closing
- —
- Monthly P&I
- —
- Monthly cashflow
- —
- DSCR
- —
- Eligible?
- —
Short-term bridge; refi at stabilization.
Rent comps 10 comps
| Address | Beds | Baths | Sqft | Rent | $/sqft | DOM | Units | Dist |
|---|---|---|---|---|---|---|---|---|
| 2000 E Main St El Cajon, CA | 3.0 | 1.5–2.5 | 1165 | $3,300 | $2.83 | 2d | 1 | 0.46mi |
| 12171 Winter Gardens Dr Lakeside, CA | 2.0 | 1.0 | 862 | $2,500 | $2.90 | 2d | 1 | 0.56mi |
| 8424 Pueblo Rd Unit 8424 Lakeside, CA | 3.0 | 1.0 | 1000 | $2,750 | $2.75 | 2d | 1 | 0.67mi |
| 8031 Winter Gardens Blvd El Cajon, CA | 3.0 | 2.0 | 1124 | $2,995 | $2.66 | 2d | 1 | 0.70mi |
| 8410 Los Coches Rd El Cajon, CA | 2.0 | 2.0 | 900 | $2,239 | $2.49 | 2d | 1 | 0.98mi |
| 8809 Los Coches Rd Lakeside, CA | 4.0 | 2.0 | 1350 | $3,800 | $2.81 | 2d | 1 | 1.10mi |
| 9092 Los Coches Rd Lakeside, CA | 3.0 | 2.5 | 1300 | $4,000 | $3.08 | 2d | 1 | 1.15mi |
| 9094 Los Coches Rd Lakeside, CA | 3.0 | 2.5 | 1200 | $4,000 | $3.33 | 2d | 1 | 1.15mi |
| 1365 Broadway El Cajon, CA | 3.0 | 2.0 | 1000 | $3,478 | $3.48 | 2d | 1 | 1.40mi |
| 1221 Oro St El Cajon, CA | 2.0 | 1.5 | 1020 | $2,575 | $2.52 | 2d | 1 | 1.42mi |
Listing history 19 events
-
2026-06-18days on market $204,995 Active 136 DOM
-
2026-06-17days on market $204,995 Active 135 DOM
-
2026-06-16days on market $204,995 Active 134 DOM
-
2026-06-15pricedays on market $204,995 Active 133 DOM
-
2026-06-13days on market $204,999 Active 131 DOM
-
2026-06-13days on market $204,999 Active 130 DOM
-
2026-06-09days on market $204,999 Active 127 DOM
-
2026-06-08days on market $204,999 Active 126 DOM
-
2026-06-07days on market $204,999 Active 125 DOM
-
2026-06-04days on market $204,999 Active 122 DOM
-
2026-06-03days on market $204,999 Active 121 DOM
-
2026-06-02days on market $204,999 Active 120 DOM
-
2026-06-01days on market $204,999 Active 119 DOM
-
2026-05-31days on market $204,999 Active 118 DOM
-
2026-04-28price $204,999
-
2026-04-10price $214,999
-
2026-03-23price $221,990
-
2026-03-02price $229,990
-
2026-02-02$229,995 Active
ⓘ Source: listings_history table (triggers on properties + properties_extension) + one-shot
backfill from property_details.listing_events for pre-trigger history.
Climate risk First Street
- Flood 5/10 Major FEMA zone X (unshaded) · 27% chance over 30 yrs
- Wildfire 6/10 Major
- Heat 5/10 Major 5 d/yr ≥98°F today · 13 d/yr by 30 yrs out
- Wind 1/10 Low
- Air quality 4/10 Moderate 6 unhealthy d/yr today · 7 by 30 yrs out
Nearby sold comps map
Loading sold comps map…
Walkable amenities ~0.75 mi
Loading nearby amenities…
Taxation est. · year 1
- Rental income
- $36,616
- − Mortgage interest
- −$11,483
- − Property taxes
- −$3,075
- − Insurance
- −$1,025
- − Repairs & maintenance
- −$2,929
- − Management
- −$2,929
- − Depreciation
- −$5,963
- Taxable income
- $9,212
- Est. tax owed @ 24.0%
- −$2,211
- After-tax cash flow
- $9,716/yr
For passive investors: Depreciation is non-cash, so a rental often shows a tax loss while cash-flowing — sheltering income. Rental losses are passive: they offset passive income freely, and up to $25,000/yr can offset ordinary (W-2) income if you actively participate and your MAGI is under $100k (phasing out to $0 by $150k); unused losses carry forward. On sale, claimed depreciation is recaptured at up to 25%, and gains may owe capital-gains tax (a 1031 exchange can defer both). Figures are a year-1 estimate at your 24.0% rate — not tax advice; consult a CPA.
Schools (NCES district)
- District
- Grossmont Union High
- NCES district ID
- 0616230
- Math proficiency
- 31% ▼ -1.00%
- Reading proficiency
- 60% ▲ 5.00%
- Median HH income
- $61,801
- Composite
- 40.07/100
- National rank
- #3810
- State rank
- #173 of 517 in CA
Livability — Winter Gardens
- Score
- 61/100
- State rank
- #515
- US rank
- #17448
Category grades
Schools grade is shown separately in the Schools card above.
Census & demographics
- Census place
- Winter Gardens, CA
- County
- San Diego County · 3,178,799 people
- Metro
- San Diego-Chula Vista-Carlsbad, CA
- Population (ZIP)
- 70,501
- Household income
- $74,013
- Rent vs Own
- Severe rent burden
- 4178.0
Population outlook (San Diego County) Hauer SSP2
- Today (2025)
- 3,678,185 people
- By 2030
- 3,856,546 · +4.8%
- By 2040
- 4,171,407 · +13.4%
- By 2050
- 4,421,607 · +20.2%
- By 2075
- 4,831,599 · +31.4%
- By 2100
- 4,832,502 · +31.4%
Race, ethnicity, and origin ACS 2023
- Neighborhood character
- Diverse neighborhood (Simpson 0.62)
- Race & ethnicity
- White 54% Hispanic / Latino 28% Two or more races 14% Black 6% Asian 5% Native American 2%
- Hispanic origin (detail)
- Mexican 24%
- Common ancestry
- Arab 6% Italian 2% Lithuanian 2%
- Foreign-born
- 22% · Canada
- Languages at home
- 65% English-only · Spanish 18% Arabic 7% Other Indo-European 3%
Political lean MEDSL · San Diego
- 2024 margin
- D (+16.8) · D 56.9% · R 40.1% · Other 2.9%
- 2008→2024 swing
- +6.6pp toward D · 2008: 10.2pp · 2024: 16.8pp
- All cycles
- 2024: D+16.8 2020: D+22.8 2016: D+17.8 2012: D+5.1 2008: D+10.2
Not yet ingested
- Civics
- —
Market trends
- HPI YoY
- ▼ -654.88%
- Current HPI
- 335.0617
- Rent YoY
- ▼ -0.83%
- Metro
- San Diego-Chula Vista-Carlsbad, CA
- State GDP YoY
- ▲ 3.21%
- F500 in state
- 116
Industry mix (Fortune 500 HQ in CA)
| Industry | F500 HQs | Revenue |
|---|---|---|
| Technology | 27 | $1,492B |
|
||
| Financial Services | 3 | $174B |
|
||
| Retail | 3 | $44B |
|
||
| Insurance | 3 | $26B |
|
||
| Media / Entertainment | 2 | $115B |
|
||
| Pharmaceuticals / Biotech | 2 | $62B |
|
||
Price history
-10.9% since first listed5 events — show timeline
- 2026-04-28 Price Changed $204,999 CRMLS
- 2026-04-10 Price Changed $214,999 CRMLS
- 2026-03-23 Price Changed $221,990 CRMLS
- 2026-03-02 Price Changed $229,990 CRMLS
- 2026-02-02 Listed $229,995 CRMLS
Cash-flow waterfall
monthlySold comps — $/sqft
last 12 mo · ≤1 miLoading sold comps…