 🏗️ New Construction
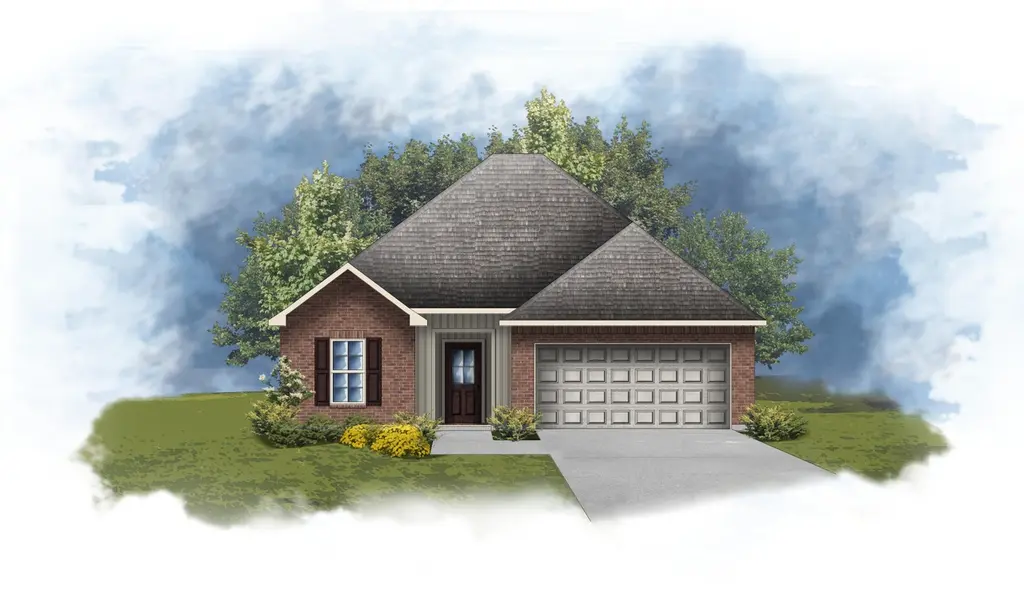
Wendell IV G Plan · Hammond, LA
Flood risk No data
- FEMA flood zone
- —
- Chance of flooding over 30 yrs
- —
- Est. flood insurance / yr
- —
Fire risk No data
- Est. fire insurance / yr
- —
Heat risk No data
- Hot days now (above threshold)
- —
- Hot days in 30 yrs
- —
Wind risk No data
- Chance of severe wind over 30 yrs
- —
Air-quality risk No data
- Unhealthy air days now
- —
- Unhealthy air days in 30 yrs
- —
Risk factors via First Street. Map © Google.
Why this score? — see what drove the F grade
The composite is a weighted blend of 9 inputs, each scored 0–100. Each bar is that input's sub-score; the figure is the points it added to the 100-point composite (weight × sub-score).
- ARV discount +7.5/15.0
- Cash flow +6.8/30.0
- Appreciation +6.6/10.0
- Livability +3.5/5.0
- Rent growth +2.5/5.0
- Condition / age +2.5/5.0
- Schools +2.0/10.0
- 1% rule +1.8/10.0
- DSCR +1.1/10.0
$216,990
🖨 Deal sheet 📄 Offer letter ✓ Due diligence
Listing remarks MLS
Open Floor Plan Three Bedroom, Two Bathroom Two Car Garage Brick and siding Covered patio Recessed lighting Single master vanity Walk-in master closet Optional Fireplace
Key facts
- Open floor plan
- Single master vanity
- Covered patio
Tags
Neighborhood map
What this means for you Summary
Snapshot
- This is a 3-bed/2.0-bath single-family listed at $217k.
Deal economics
- At list price, monthly cash flow is $-362 ($-4k/yr) — negative.
- To cash-flow at today's rent, offer at most $183k (15.7% below list).
- To meet the 1% rule (rent ≥ 1% of price), the offer needs to be $160k (26.3% below list).
- Recommended offer: $160k (26.3% below list) — sets the bar for 1% rule.
Location & tenants
- Location reads 69/100 on livability (#77 in LA) — a middle-class / working-renter tenant base. Strengths: cost of living A+, health & safety A+; Watch: amenities C-, commute D+, schools D.
- Tangipahoa Parish (rural): math 18% / reading 29% proficiency, ranked #63 of 98 in LA (top 64%) — low school quality limits family demand, transient renter base, plan for 1-2y turnover; 73% free/reduced lunch — lower-income household profile, screen leases tightly.
- Market conditions: 86 active listings in the ZIP; 1 comparable units currently listed for rent nearby; 1,085 units permitted in Tangipahoa Parish in 2024 (378 in 5+ unit buildings).
Forward outlook
- In year one you build about $9k of equity ($2k loan paydown + $8k appreciation (3.2% local appreciation)).
- Tangipahoa County population projected at +22% by 2050 — long-run rental-demand tailwind backs the buy-and-hold thesis.
- By year 4, paydown + projected appreciation supports a ~$31k cash-out refi (75% LTV) — recoverable capital for the next deal without selling this one.
Negotiation context
- It's been on market 134 days — a 12% lower offer ($191k) is reasonable based on typical stale-listing flexibility.
Questions for the listing agent
- What do current leases actually rent for vs. the listed asking? Can we see a recent rent roll and the last 12 months of T-12 income?
- It's been on market 134 days. Have you received any prior offers? Is the seller open to a 26% concession, seller financing, or rate buy-down credit?
- Why hasn't it sold? Are there any deal-killer items the seller is aware of (foundation, flood, title, zoning, code violations)?
- Is there a deadline driving the sale (1031 exchange, divorce, estate, relocation)? That informs how much negotiation room exists.
- Schools are D-rated, which usually means shorter tenancies and higher turnover. Who's the typical renter profile here, and what's been the actual vacancy rate?
- Crime grade is F in this area — have there been break-ins, vandalism, or insurance claims at this property in the last 3 years? What carrier currently insures it and at what premium?
- The area grade is low — what's the realistic commute time and amenity access for the typical tenant pool here? Any planned neighborhood developments (good or bad) we should know about?
- What's the average days-on-market for RENTAL listings here right now (not sales)? A rising rental-DOM trend means longer vacancies and softer asking-rent achievability than the comps imply.
- What's the recent tenant-quality profile in this submarket — average credit score on applications, eviction rate, late-payment / NSF rate, and stable-employment percentage? A property-management company in the area should have these aggregated.
- How much new for-sale + rental construction is in the pipeline within 1–3 miles? Heavy new supply typically softens prices + rents 12–24 months out; constrained supply supports both.
Investment metrics
- 1% rule
- 0.68% ✗
- Cap rate
- 4.45%
- Cash-on-cash
- -6.59%
- DSCR
- 0.71
- GRM
- 12.3
CMA / ARV
- ARV (median comp)
- $235,272
- List price
- $216,990
- Delta
- -7.77%
- Verdict
- FAIR
- Comps
- 20 within 1.0 mi
Show comp detail 12 sales within ~0.75 mi
| Address | Dist | Beds/Ba | Sqft | Sold | Price | $/sf | Match |
|---|---|---|---|---|---|---|---|
| 23093 Serengeti Dr | 0.00mi | 3/2.0 | 1,363 (0%) | 0mo | $216,010 | $158 | 100 |
| 23023 Savannahwood Dr | 0.10mi | 3/2.0 | 1,343 (-2%) | 3mo | $214,900 | $160 | 90 |
| 47594 Cathy Ln | 0.52mi | 3/2.0 | 1,369 (+0%) | 10mo | $220,000 | $161 | 66 |
| 23015 Mills Blvd | 0.34mi | 3/2.0 | 1,258 (-8%) | 12mo | $200,000 | $159 | 61 |
| 47715 Cathy Ln | 0.60mi | 3/2.0 | 1,472 (+8%) | 10mo | $220,000 | $149 | 50 |
| 47488 Cathy Ln | 0.47mi | 4/2.0 (+1) | 1,562 (+15%) | 1mo | $220,000 | $141 | 48 |
| 47602 Cathy Ln | 0.53mi | 4/2.0 (+1) | 1,539 (+13%) | 2mo | $235,000 | $153 | 47 |
| 47633 Cathy Ln | 0.51mi | 3/2.0 | 1,508 (+11%) | 16mo | $220,000 | $146 | 46 |
| 47612 Cathy Ln | 0.54mi | 3/2.0 | 1,530 (+12%) | 15mo | $215,000 | $141 | 42 |
| 47417 Myra Cv | 0.68mi | 3/2.0 | 1,510 (+11%) | 10mo | $219,500 | $145 | 42 |
| 47385 Myra Cv | 0.73mi | 4/2.0 (+1) | 1,562 (+15%) | 4mo | $235,000 | $150 | 33 |
| 47389 Myra Cv | 0.73mi | 4/2.0 (+1) | 1,561 (+14%) | 16mo | $215,000 | $138 | 24 |
Match score weights: distance 35% · size 25% · config 20% · recency 20%. Top-matched comps best support the ARV.
Projected returns pro-forma
3.21% appreciation · 3.0% rent growth · sell at horizon
- IRR
- 2.1%
- Equity multiple
- 1.12×
- Total profit
- $7,985
- Equity at exit
- $108,628
- IRR
- 5.6%
- Equity multiple
- 1.87×
- Total profit
- $57,519
- Equity at exit
- $169,651
Cash invested: $65,876 (down + closing). Projections, not guarantees.
Landlord ↔ Tenant lean methodology
- Overall (STATE)
- 90 Strongly Landlord-Friendly
- State Louisiana
- 90 Strongly Landlord-Friendly · R+12
- County
- — inherits STATE
- City
- — inherits STATE
ZIP-level market 70455
- Home prices YoY
- 2.0%
- Active inventory
- 86
- Price-to-rent
- 11.3×
Monthly cashflow live
- Estimated rent
- $1,600 medium interval (Pro) →
- Mortgage (P&I)
- −$1,234
- Tax est. 1.5%
- −$294 /mo · $3,529/yr
- Insurance
- −$98
- HOA
- −$0
- Vacancy / Maint / Mgmt
- −$336
- Net cashflow
- $-362
Break-even live
UW: 25.0% down · 7.5% · 30yr · 1.5% tax · 5.0% vac · 8.0% maint · 8.0% mgmt
Financing live
Cash to close
- Down payment
- $58,818
- Closing costs
- $7,058
- Reserves months
- —
- Total cash needed
- —
Loan-product check · same deal, 3 products live
Conventional
25% down · 7.5% · 30yr
- Down + closing
- —
- Monthly P&I
- —
- Monthly cashflow
- —
- DSCR
- —
- Eligible?
- —
Personal DTI + credit; lowest rate.
DSCR
20% down · 8.5% · 30yr
- Down + closing
- —
- Monthly P&I
- —
- Monthly cashflow
- —
- DSCR
- —
- Eligible?
- —
No personal income docs; deal must DSCR.
Hard money
10% down · 12.0% · 12mo
- Down + closing
- —
- Monthly P&I
- —
- Monthly cashflow
- —
- DSCR
- —
- Eligible?
- —
Short-term bridge; refi at stabilization.
Rent comps 1 comps
| Address | Beds | Baths | Sqft | Rent | $/sqft | DOM | Units | Dist |
|---|---|---|---|---|---|---|---|---|
| 47376-0 Johns Cv Robert, LA | 3.0 | 2.0 | 1508 | $1,600 | $1.06 | 44d | 1 | 0.66mi |
Listing history 18 events
-
2026-06-19days on market $216,990 Active 134 DOM
-
2026-06-18days on market $216,990 Active 133 DOM
-
2026-06-17days on market $216,990 Active 132 DOM
-
2026-06-16days on market $216,990 Active 131 DOM
-
2026-06-15days on market $216,990 Active 130 DOM
-
2026-06-14days on market $216,990 Active 128 DOM
-
2026-06-13days on market $216,990 Active 127 DOM
-
2026-06-10days on market $216,990 Active 125 DOM
-
2026-06-09days on market $216,990 Active 124 DOM
-
2026-06-08days on market $216,990 Active 123 DOM
-
2026-06-07days on market $216,990 Active 122 DOM
-
2026-06-05days on market $216,990 Active 119 DOM
-
2026-06-03days on market $216,990 Active 118 DOM
-
2026-06-02pricedays on market $216,990 Active 117 DOM
-
2026-06-01days on market $213,990 Active 116 DOM
-
2026-05-31days on market $213,990 Active 115 DOM
-
2026-05-30days on market $213,990 Active 114 DOM
-
2026-02-05$213,990 Active 171-char remark
Show marketing remark (171 chars)
Open Floor Plan Three Bedroom, Two Bathroom Two Car Garage Brick and siding Covered patio Recessed lighting Single master vanity Walk-in master closet Optional Fireplace
ⓘ Source: listings_history table (triggers on properties + properties_extension) + one-shot
backfill from property_details.listing_events for pre-trigger history.
Nearby sold comps map
Loading sold comps map…
Walkable amenities ~0.75 mi
Loading nearby amenities…
Taxation est. · year 1
- Rental income
- $19,200
- − Mortgage interest
- −$13,179
- − Property taxes
- −$3,529
- − Insurance
- −$1,176
- − Repairs & maintenance
- −$1,536
- − Management
- −$1,536
- − Depreciation
- −$6,844
- Taxable loss
- −$8,601
- Est. tax savings @ 24.0%
- +$2,064
- After-tax cash flow
- $-2,279/yr
For passive investors: Depreciation is non-cash, so a rental often shows a tax loss while cash-flowing — sheltering income. Rental losses are passive: they offset passive income freely, and up to $25,000/yr can offset ordinary (W-2) income if you actively participate and your MAGI is under $100k (phasing out to $0 by $150k); unused losses carry forward. On sale, claimed depreciation is recaptured at up to 25%, and gains may owe capital-gains tax (a 1031 exchange can defer both). Figures are a year-1 estimate at your 24.0% rate — not tax advice; consult a CPA.
Schools (NCES district)
- District
- Tangipahoa Parish
- NCES district ID
- 2201680
- Math proficiency
- 18% ▼ -32.00%
- Reading proficiency
- 29% ▼ -31.00%
- Median HH income
- $41,283
- Composite
- 19.94/100
- National rank
- #8676
- State rank
- #63 of 98 in LA
Livability — Hammond
- Score
- 69/100
- State rank
- #77
- US rank
- #8868
Category grades
Schools grade is shown separately in the Schools card above.
Census & demographics
- City population
- 51,394
- Population (ZIP)
- 2,456
Population outlook (Tangipahoa County) Hauer SSP2
- Today (2025)
- 144,204 people
- By 2030
- 151,413 · +5.0%
- By 2040
- 164,374 · +14.0%
- By 2050
- 175,427 · +21.7%
- By 2075
- 195,165 · +35.3%
- By 2100
- 201,641 · +39.8%
Race, ethnicity, and origin ACS 2023
- Neighborhood character
- Predominantly White (80%)
- Race & ethnicity
- White 80% Asian 19%
- Common ancestry
- Lithuanian 15% Slovak 1% Italian 1%
- Foreign-born
- 14% · Philippines, Canada
- Languages at home
- 83% English-only · Other Asian/Pacific 17%
Political lean MEDSL · Tangipahoa
- 2024 margin
- Solid R (+37.4) · D 30.6% · R 68.0% · Other 1.3%
- 2008→2024 swing
- -6.5pp toward R · 2008: -30.9pp · 2024: -37.4pp
- All cycles
- 2024: R+37.4 2020: R+32.8 2016: R+32.6 2012: R+27.7 2008: R+30.9
Not yet ingested
- Civics
- —
Market trends
- HPI YoY
- ▲ 3.21%
- Current HPI
- 166.5078
- Rent YoY
- —
- Metro
- —
- State GDP YoY
- ▲ 3.29%
- F500 in state
- 10
Industry mix (Fortune 500 HQ in LA)
| Industry | F500 HQs | Revenue |
|---|---|---|
| Telecommunications | 2 | $23B |
|
||
| Utilities | 1 | $12B |
|
||
| Wholesale / Distribution | 1 | $5B |
|
||
| Advertising | 1 | $2B |
|
||
Price history
1 event — show timeline
- 2026-02-05 Listed $213,990 Zillow
Cash-flow waterfall
monthlySold comps — $/sqft
last 12 mo · ≤1 miLoading sold comps…