 8-Plex
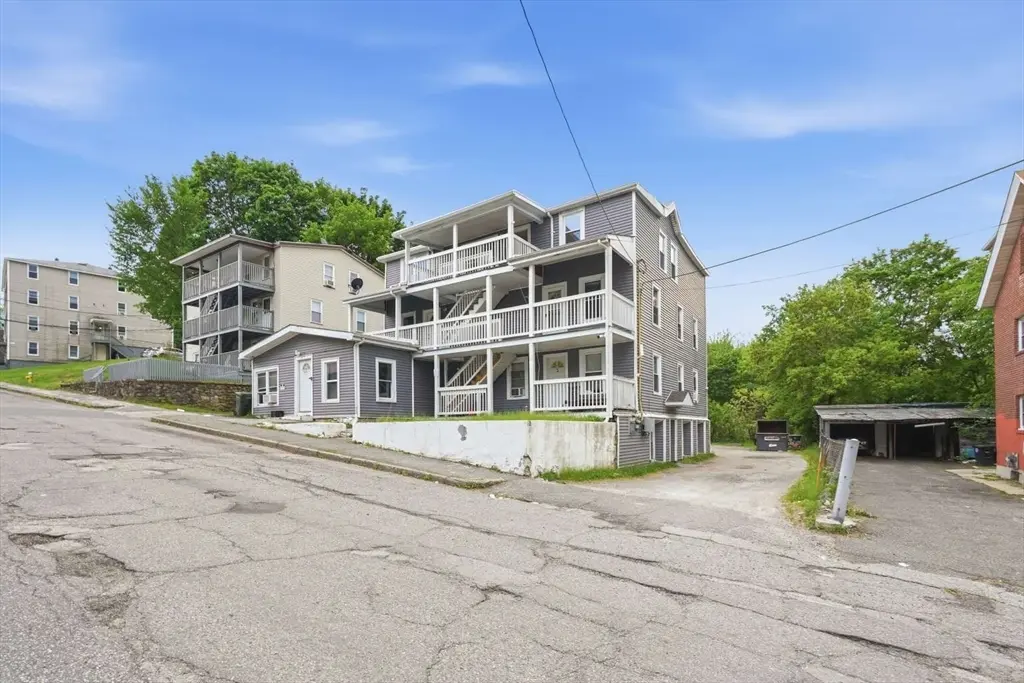
88 Cross St · Southbridge Town, MA
Flood risk 1/10 · Minimal
- FEMA flood zone
- X (unshaded)
- Chance of flooding over 30 yrs
- 0.0%
- Est. flood insurance / yr
- $473 – $860
Fire risk 1/10 · Minimal
- Est. fire insurance / yr
- $915 – $1,699
Heat risk 4/10 · Minor
- Hot days now (above 94°F)
- 7 days/yr
- Hot days in 30 yrs
- 17 days/yr
Wind risk 6/10 · Moderate
- Chance of severe wind over 30 yrs
- 27.0%
Air-quality risk 2/10 · Minimal
- Unhealthy air days now
- 2 days/yr
- Unhealthy air days in 30 yrs
- 2 days/yr
Risk factors via First Street. Map © Google.
Why this score? — see what drove the C- grade
The composite is a weighted blend of 9 inputs, each scored 0–100. Each bar is that input's sub-score; the figure is the points it added to the 100-point composite (weight × sub-score).
- Cash flow +24.7/30.0
- DSCR +8.0/10.0
- ARV discount +7.5/15.0
- 1% rule +5.3/10.0
- Livability +2.8/5.0
- Rent growth +2.5/5.0
- Condition / age +2.5/5.0
- Schools +1.0/10.0
- Appreciation +0.0/10.0
$1,320,000
🖨 Deal sheet 📄 Offer letter ✓ Due diligence
Multi-family units
County records classify this as Multi-Family (5+ Unit). Listing-text estimate: 8 units. confirmed
5+ unit building — per-unit beds/baths from public records are typically unavailable; the breakdown below (if shown) is an estimate from the listing text.
Listing remarks MLS
8 - Family can be purchased as a package deal of 6 properties total for the purchase price of $1,207,405. See MLS#s 71997046, 71997082, 71997064, 71990679, & 71991903.
Key facts
- Below-market rents
- Multifamily property
- Easy highway access
Tags
Property features AI
Finance
- Other: Some units are leased (units 1 and 2 leased; units 3 and 4 not leased); Total of 4 described units, each primarily single-level
- Financial info: Total building area approximately 5,224; Lot size about 0.21 acre
- HOA & community: Not a senior community
Exterior
- Parking: 7 off-street parking spaces
- Utilities: Public water; Public sewer; Electric service with circuit breakers and 100 Amp service (other details see remarks); Gas and electric oven hookups
- Home design: 5–9 family multi-unit property; 6 stories
- Construction: Frame construction (see remarks); Stone foundation; Shingle, rubber and other roof materials; Year built: Unknown/mixed (source: public records); Lead paint present; certified treated
- Exterior features: Porch; Unimproved road frontage on a public road
Interior
- Kitchen: Gas and electric oven capability
- Bedrooms: Multiple rental units (see unit details) — units are primarily single-level
- Flooring: Vinyl; Carpet; Hardwood
- Bathrooms: 8 full bathrooms
- Interior features: 21 total rooms; Partial, unfinished basement; Washer hookup available
- Laundry & utility: Washer hookup
Neighborhood map
What this means for you Summary
Snapshot
- This is a 6×2bd/1.0ba + 2×3bd/1.0ba units multifamily listed at $1.32M.
Deal economics
- At list price, monthly cash flow is $3k ($33k/yr) — positive. Per door: $344/mo.
- The deal already cash-flows at list — no discount required.
- Meets the 1% rule at list price ($14k rent vs $1.32M).
- Recommended offer: $1.30M (1.5% below list) — sets the bar for market timing.
- Cap rate 8.8% vs local median 3.7% in Southbridge Town — top-decile yield for the area; either an underpriced asset or a hidden risk that comps aren't pricing in. Stress-test before assuming the spread holds.
Location & tenants
- Location reads 56/100 on livability (#235 in MA) — a working-class tenant base; expect higher turnover. Strengths: housing A+; Watch: cost of living C-, employment D, schools F.
- Southbridge (suburban): math 5% / reading 17% proficiency, ranked #301 of 302 in MA (top 100%) — low school quality limits family demand, transient renter base, plan for 1-2y turnover; 63% free/reduced lunch — lower-income household profile, screen leases tightly.
- Market conditions: 35 active listings in the ZIP; 2,293 units permitted in Worcester County in 2024 (1,205 in 5+ unit buildings).
- At $13,559/mo this rent would consume 245% of the median local household income ($66k/yr) (locally 1217% of renters already pay >50% of income on rent) — very limited rent-growth headroom before tenants either downsize or default.
Forward outlook
- Local home prices are declining (-3.0%/yr); year-one equity from $9k of loan paydown is wiped out by about $40k of value loss. Plan a longer hold.
Negotiation context
- It's been on market 23 days — a 2% lower offer ($1.30M) is reasonable based on typical stale-listing flexibility.
- 5 sale attempts since 13y ago with the ask held roughly flat each time — persistent listings suggest the price (not the market) is what's stuck; bring a comps-based counter.
- Current owner paid $190k; list at $1.32M implies a 595% gain — meaningful room to come down on a strong offer.
Risks & watch-outs
- Watch-outs: built in 1900 — expect roof / HVAC / electrical / plumbing capex.
- Climate carrying-cost: major wind risk, 27% chance of damaging wind over 30y — expect insurance premiums to compound above CPI over the hold.
Questions for the listing agent
- Can we see the unit-by-unit rent roll, current vacancy, and any below-market leases? What's the average tenancy length?
- What capital expenditures (roof, boiler, parking lot, exteriors) have been made in the last 5 years, and what's planned in the next 2?
- Built in 1900 — when were the roof, HVAC, electrical panel, plumbing, and water heater last replaced?
- Is there a deadline driving the sale (1031 exchange, divorce, estate, relocation)? That informs how much negotiation room exists.
- Schools are F-rated, which usually means shorter tenancies and higher turnover. Who's the typical renter profile here, and what's been the actual vacancy rate?
- What's the average days-on-market for RENTAL listings here right now (not sales)? A rising rental-DOM trend means longer vacancies and softer asking-rent achievability than the comps imply.
- What's the recent tenant-quality profile in this submarket — average credit score on applications, eviction rate, late-payment / NSF rate, and stable-employment percentage? A property-management company in the area should have these aggregated.
- How much new apartment / multifamily construction is in the pipeline within 1–3 miles? Heavy new supply (>2% of stock underway) typically softens rents 12–24 months out; light construction supports rent growth.
Investment metrics
- 1% rule
- 1.03% ✓
- Cap rate
- 8.79%
- Cash-on-cash
- 8.93%
- DSCR
- 1.40
- GRM
- 8.1
CMA / ARV
- ARV (on-the-fly)
- $517,176
- Comps found
- 3
Show comp detail 3 sales within ~0.75 mi
| Address | Dist | Beds/Ba | Sqft | Sold | Price | $/sf | Match |
|---|---|---|---|---|---|---|---|
| 14 South St | 0.15mi | 8/— (-1) | 5,625 (+8%) | 23mo | $350,000 | $62 | 56 |
| 77 Off Hamilton St | 0.27mi | 10/4.5 (+1) | 4,575 (-12%) | 1mo | $555,000 | $121 | 47 |
| 103 Elm St | 0.57mi | 9/3.0 | 4,722 (-10%) | 23mo | $466,000 | $99 | 18 |
Match score weights: distance 35% · size 25% · config 20% · recency 20%. Top-matched comps best support the ARV.
Projected returns pro-forma
-3.0% appreciation · 3.0% rent growth · sell at horizon
- IRR
- -2.8%
- Equity multiple
- 0.89×
- Total profit
- $-39,253
- Equity at exit
- $196,816
- IRR
- 6.8%
- Equity multiple
- 1.51×
- Total profit
- $189,289
- Equity at exit
- $114,129
Cash invested: $369,600 (down + closing). Projections, not guarantees.
Landlord ↔ Tenant lean methodology
- Overall (STATE)
- 20 Strongly Tenant-Friendly
- State Massachusetts
- 20 Strongly Tenant-Friendly · D+15
- County
- — inherits STATE
- City
- — inherits STATE
ZIP-level market 01550
- Home prices YoY
- -7.8%
- Active inventory
- 35
- Price-to-rent
- 67.4×
Monthly cashflow live
- Estimated rent
- $13,559 medium interval (Pro) →
- Mortgage (P&I)
- −$6,922
- Tax from tax record
- −$489 /mo · $5,872/yr
- Insurance
- −$550
- HOA
- −$0
- Vacancy / Maint / Mgmt
- −$2,847
- Net cashflow
- $2,750
Break-even live
8-unit breakdown (identical units grouped — click to expand)
| Units | Beds | Baths | Est. rent |
|---|---|---|---|
| 6× units | 2 | 1 | $9,792 |
| #1 | 2 | 1 | $1,632 |
| #2 | 2 | 1 | $1,632 |
| #3 | 2 | 1 | $1,632 |
| #4 | 2 | 1 | $1,632 |
| #5 | 2 | 1 | $1,632 |
| #6 | 2 | 1 | $1,632 |
| 2× units | 3 | 1 | $3,768 |
| #7 | 3 | 1 | $1,884 |
| #8 | 3 | 1 | $1,884 |
| Total (8 units) | $13,559 | ||
UW: 25.0% down · 7.5% · 30yr · 1.5% tax · 5.0% vac · 8.0% maint · 8.0% mgmt
Financing live
Cash to close
- Down payment
- $330,000
- Closing costs
- $39,600
- Reserves months
- —
- Total cash needed
- —
Loan-product check · same deal, 3 products live
Conventional
25% down · 7.5% · 30yr
- Down + closing
- —
- Monthly P&I
- —
- Monthly cashflow
- —
- DSCR
- —
- Eligible?
- —
Personal DTI + credit; lowest rate.
DSCR
20% down · 8.5% · 30yr
- Down + closing
- —
- Monthly P&I
- —
- Monthly cashflow
- —
- DSCR
- —
- Eligible?
- —
No personal income docs; deal must DSCR.
Hard money
10% down · 12.0% · 12mo
- Down + closing
- —
- Monthly P&I
- —
- Monthly cashflow
- —
- DSCR
- —
- Eligible?
- —
Short-term bridge; refi at stabilization.
Listing history 29 events
-
2026-06-18days on market $1,320,000 Active 23 DOM
-
2026-06-17days on market $1,320,000 Active 22 DOM
-
2026-06-16days on market $1,320,000 Active 21 DOM
-
2026-06-15days on market $1,320,000 Active 20 DOM
-
2026-06-14days on market $1,320,000 Active 18 DOM
-
2026-06-10days on market $1,320,000 Active 15 DOM
-
2026-06-09days on market $1,320,000 Active 14 DOM
-
2026-06-08days on market $1,320,000 Active 13 DOM
-
2026-06-07days on market $1,320,000 Active 12 DOM
-
2026-06-05days on market $1,320,000 Active 9 DOM
-
2026-06-03days on market $1,320,000 Active 8 DOM
-
2026-06-02days on market $1,320,000 Active 7 DOM
-
2026-06-01days on market $1,320,000 Active 6 DOM
-
2026-05-31days on market $1,320,000 Active 5 DOM
-
2026-05-31statusdays on market $1,320,000 Active 4 DOM
-
2026-05-26$1,320,000 New
-
2024-11-14historical $1,600
-
2024-10-23$1,600
-
2024-10-23historical $1,525
-
2024-10-22$1,525
-
2017-03-10soldstatus $190,000 Sold 172-char remark
Show marketing remark (172 chars)
8 - Family can be purchased as a package deal of 6 properties total for the purchase price of $1,207,405. See MLS#s 71997046, 71997082, 71997064, 71990679, & 71991903.
-
2017-03-10soldstatus $190,000
Show marketing remark (172 chars)
8 - Family can be purchased as a package deal of 6 properties total for the purchase price of $1,207,405. See MLS#s 71997046, 71997082, 71997064, 71990679, & 71991903.
-
2017-02-22status Under Agreement 172-char remark
Show marketing remark (172 chars)
8 - Family can be purchased as a package deal of 6 properties total for the purchase price of $1,207,405. See MLS#s 71997046, 71997082, 71997064, 71990679, & 71991903.
-
2016-04-29$239,000 New 172-char remark
Show marketing remark (172 chars)
8 - Family can be purchased as a package deal of 6 properties total for the purchase price of $1,207,405. See MLS#s 71997046, 71997082, 71997064, 71990679, & 71991903.
-
2013-05-16soldstatus $105,000 Sold 68-char remark
Show marketing remark (68 chars)
Great investment opportunity! 8 family, 32 rooms, 9 total bedrooms.
-
2013-03-16historical Under Agreement 68-char remark
Show marketing remark (68 chars)
Great investment opportunity! 8 family, 32 rooms, 9 total bedrooms.
-
2013-03-13$189,900 New 68-char remark
Show marketing remark (68 chars)
Great investment opportunity! 8 family, 32 rooms, 9 total bedrooms.
-
1991-07-25soldstatus $148,000
-
1988-02-19soldstatus $100,000
ⓘ Source: listings_history table (triggers on properties + properties_extension) + one-shot
backfill from property_details.listing_events for pre-trigger history.
Tax reassessment forecast MA · Partial reset (capped growth)
- Current annual tax
- $5,872 · $489/mo
- Projected year-2 tax
- $11,054 · $921/mo
- Expected delta
- +$5,182/yr (+$432/mo · 88.2%)
ⓘ Screening estimate from a state-policy table — verify with the county assessor before closing.
Climate risk First Street
- Flood 1/10 Low FEMA zone X (unshaded) · 0% chance over 30 yrs
- Wildfire 1/10 Low
- Heat 4/10 Moderate 7 d/yr ≥94°F today · 17 d/yr by 30 yrs out
- Wind 6/10 Major 27% chance of damaging wind over 30 yrs
- Air quality 2/10 Low 2 unhealthy d/yr today · 2 by 30 yrs out
Nearby sold comps map
Loading sold comps map…
Walkable amenities ~0.75 mi
Loading nearby amenities…
Taxation est. · year 1
- Rental income
- $162,708
- − Mortgage interest
- −$73,941
- − Property taxes
- −$5,872
- − Insurance
- −$6,600
- − Repairs & maintenance
- −$13,017
- − Management
- −$13,017
- − Depreciation
- −$38,400
- Taxable income
- $11,862
- Est. tax owed @ 24.0%
- −$2,847
- After-tax cash flow
- $30,154/yr
For passive investors: Depreciation is non-cash, so a rental often shows a tax loss while cash-flowing — sheltering income. Rental losses are passive: they offset passive income freely, and up to $25,000/yr can offset ordinary (W-2) income if you actively participate and your MAGI is under $100k (phasing out to $0 by $150k); unused losses carry forward. On sale, claimed depreciation is recaptured at up to 25%, and gains may owe capital-gains tax (a 1031 exchange can defer both). Figures are a year-1 estimate at your 24.0% rate — not tax advice; consult a CPA.
Schools (NCES district)
- District
- Southbridge
- NCES district ID
- 2511010
- Math proficiency
- 5% ▼ -5.00%
- Reading proficiency
- 17% ▼ -1.00%
- Median HH income
- $45,438
- Composite
- 9.97/100
- National rank
- #9814
- State rank
- #301 of 302 in MA
Livability — Southbridge Town
- Score
- 56/100
- State rank
- #235
- US rank
- #22429
Category grades
Schools grade is shown separately in the Schools card above.
Census & demographics
- Census place
- Southbridge Town, MA
- County
- Worcester County · 487,911 people
- City population
- 17,806
- Metro
- Worcester, MA-CT
- Population (ZIP)
- 17,928
- Household income
- $66,287
- Rent vs Own
- Severe rent burden
- 1217.0
Population outlook (Worcester County) Hauer SSP2
- Today (2025)
- 850,858 people
- By 2030
- 860,403 · +1.1%
- By 2040
- 869,902 · +2.2%
- By 2050
- 869,110 · +2.1%
- By 2075
- 870,120 · +2.3%
- By 2100
- 829,703 · -2.5%
Race, ethnicity, and origin ACS 2023
- Neighborhood character
- Majority White (54%)
- Race & ethnicity
- White 54% Hispanic / Latino 40% Two or more races 21% Black 3%
- Hispanic origin (detail)
- Puerto Rican 35% Dominican 2%
- Common ancestry
- Lithuanian 13% Romanian 4% German 1%
- Foreign-born
- 4% · Canada
- Languages at home
- 65% English-only · Spanish 31% French/Haitian/Cajun 1% Other Indo-European 1%
Political lean MEDSL · Worcester
- 2024 margin
- D (+10.0) · D 53.9% · R 43.9% · Other 2.2%
- 2008→2024 swing
- -3.8pp toward R · 2008: 13.8pp · 2024: 10.0pp
- All cycles
- 2024: D+10.0 2020: D+17.8 2016: D+10.5 2012: D+9.2 2008: D+13.8
Not yet ingested
- Civics
- —
Market trends
- HPI YoY
- ▼ -23.80%
- Current HPI
- 280.5379
- Rent YoY
- —
- Metro
- Worcester, MA-CT
- State GDP YoY
- ▲ 2.28%
- F500 in state
- 38
Industry mix (Fortune 500 HQ in MA)
| Industry | F500 HQs | Revenue |
|---|---|---|
| Technology | 3 | $17B |
|
||
| Insurance | 2 | $84B |
|
||
| Retail | 2 | $76B |
|
||
| Life Sciences | 1 | $43B |
|
||
| Energy Technology | 1 | $31B |
|
||
| Aerospace / Defense | 1 | $18B |
|
||
Price history
+1220.0% since first listed14 events — show timeline
- 2026-05-26 Listed $1,320,000 MLS PIN
- 2024-11-14 Rental Removed $1,600 BUILDIUM
- 2024-10-23 Listed for Rent $1,600 BUILDIUM
- 2024-10-23 Rental Removed $1,525 BUILDIUM
- 2024-10-22 Listed for Rent $1,525 BUILDIUM
- 2017-03-10 Sold (Public Records) $190,000 Public Records
- 2017-03-10 Sold (MLS) $190,000 MLS PIN
- 2017-02-22 Pending — MLS PIN
- 2016-04-29 Listed $239,000 MLS PIN
- 2013-05-16 Sold (MLS) $105,000 MLS PIN
- 2013-03-16 Contingent — MLS PIN
- 2013-03-13 Listed $189,900 MLS PIN
- 1991-07-25 Sold (Public Records) $148,000 Public Records
- 1988-02-19 Sold (Public Records) $100,000 Public Records
Property tax history
+3.5%/yrLatest (2023): $5,872 · +8.3% YoY. Source: county tax records.
Cash-flow waterfall
monthlySold comps — $/sqft
last 12 mo · ≤1 miLoading sold comps…