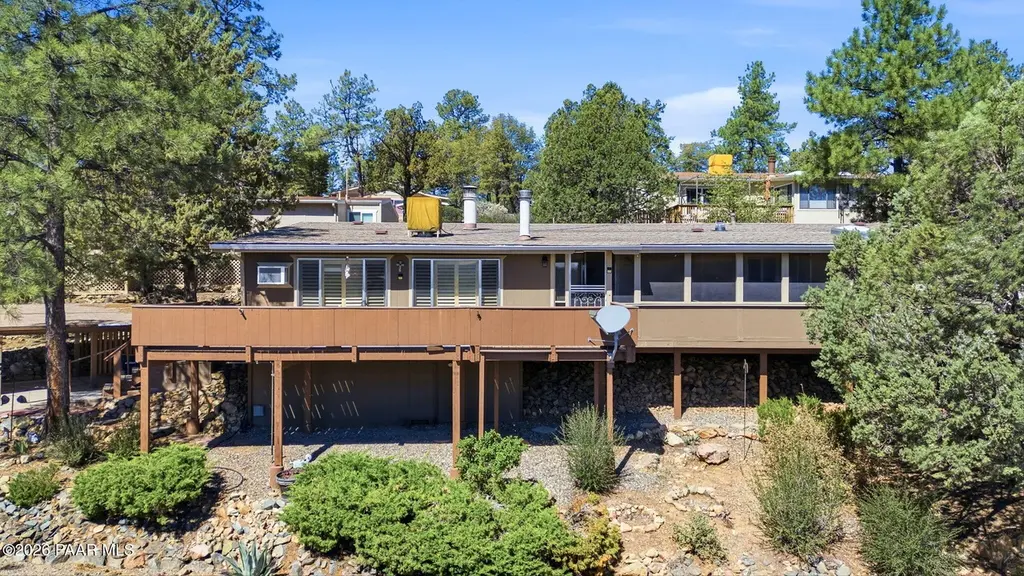
112 Alpine · Prescott, AZ
Flood risk 9/10 · Severe
- FEMA flood zone
- X (unshaded)
- Chance of flooding over 30 yrs
- 0.99%
- Est. flood insurance / yr
- $507 – $1,088
Fire risk 5/10 · Moderate
- Est. fire insurance / yr
- $610 – $1,132
Heat risk 3/10 · Minor
- Hot days now (above 91°F)
- 8 days/yr
- Hot days in 30 yrs
- 22 days/yr
Wind risk 1/10 · Minimal
- Chance of severe wind over 30 yrs
- —
Air-quality risk 1/10 · Minimal
- Unhealthy air days now
- 0 days/yr
- Unhealthy air days in 30 yrs
- 0 days/yr
Risk factors via First Street. Map © Google.
Why this score? — see what drove the C- grade
The composite is a weighted blend of 9 inputs, each scored 0–100. Each bar is that input's sub-score; the figure is the points it added to the 100-point composite (weight × sub-score).
- Cash flow +21.1/30.0
- ARV discount +7.5/15.0
- DSCR +6.7/10.0
- 1% rule +5.5/10.0
- Condition / age +3.8/5.0
- Livability +3.7/5.0
- Schools +3.3/10.0
- Rent growth +2.8/5.0
- Appreciation +0.0/10.0
$169,900
🖨 Deal sheet (PDF) 📄 Offer letter ✓ Due diligence
Listing remarks MLS
Welcome to this beautifully situated corner lot home in Prescott offering versatility and scenic Arizona living. Enjoy stunning mountain views and mature trees right from your doorstep, creating a peaceful setting.Inside, you'll find a spacious living room ideal for entertaining or relaxing, along with multiple Arizona rooms that provide endless possibilities for additional living, dining, or hobby spaces filled with natural light. The primary suite features a unique hidden flex space within the closet, perfect for a home office, private retreat, or extra storage.Located in a desirable community, residents enjoy access to amenities including a clubhouse, fitness center, pool, and hot tub.Don't miss this versatile home with incredible views and standout features!
Key facts
- 2 garage spots
- Community pool
- Built 1982
Neighborhood map
What this means for you Summary
Snapshot
- This is a 2-bed/2.0-bath manufactured listed at $170k. Condition is rated good.
Deal economics
- At list price, monthly cash flow is $175 ($2k/yr) — positive.
- The deal already cash-flows at list — no discount required.
- Meets the 1% rule at list price ($2k rent vs $170k).
- Recommended offer: $160k (6.0% below list) — sets the bar for market timing.
- Cap rate 8.0% vs local median 2.4% in Prescott — top-decile yield for the area; either an underpriced asset or a hidden risk that comps aren't pricing in. Stress-test before assuming the spread holds.
Location & tenants
- Location reads 73/100 on livability (#22 in AZ) — a middle-class / working-renter tenant base. Strengths: health & safety A+, amenities A; Watch: cost of living D, commute F.
- Prescott Unified District (4466) (urban): math 34% / reading 44% proficiency, ranked #70 of 249 in AZ (top 28%) — families likely to look elsewhere, expect single-tenant / working-renter base with shorter leases.
- Zoned schools: Prescott Mile High Middle School (math 26% / reading 42%, grade F, #67 of 218 statewide, top 31%, 578 students, 33% FRL).
- Market conditions: Rents rising (+1.0%/yr); 707 active listings in the ZIP; solid renter incomes; 2,062 units permitted in Yavapai County in 2024 (98 in 5+ unit buildings).
Forward outlook
- Local home prices are declining (-3.0%/yr); year-one equity from $1k of loan paydown is wiped out by about $5k of value loss. Plan a longer hold.
- Yavapai County population projected at +10% by 2050 — modest demand growth; plan on rents tracking national, not racing it.
Negotiation context
- It's been on market 87 days — a 6% lower offer ($160k) is reasonable based on typical stale-listing flexibility.
- Current owner paid $80k; list at $170k implies a 113% gain — meaningful room to come down on a strong offer.
Risks & watch-outs
- Watch-outs: flood insurance adds $66/mo.
- Climate carrying-cost: severe flood risk; moderate wildfire risk — expect insurance premiums to compound above CPI over the hold.
Questions for the listing agent
- It's been on market 87 days. Have you received any prior offers? Is the seller open to a 6% concession, seller financing, or rate buy-down credit?
- What's the actual annual flood-insurance premium (NFIP or private), and is the property in a SFHA with mandatory coverage?
- Why hasn't it sold? Are there any deal-killer items the seller is aware of (foundation, flood, title, zoning, code violations)?
- Is there a deadline driving the sale (1031 exchange, divorce, estate, relocation)? That informs how much negotiation room exists.
- Schools are A-rated — typically a magnet for longer-tenancy family renters. What's the average tenant stay here, and is there a school-zone premium baked into asking?
- What's the average days-on-market for RENTAL listings here right now (not sales)? A rising rental-DOM trend means longer vacancies and softer asking-rent achievability than the comps imply.
- What's the recent tenant-quality profile in this submarket — average credit score on applications, eviction rate, late-payment / NSF rate, and stable-employment percentage? A property-management company in the area should have these aggregated.
- How much new for-sale + rental construction is in the pipeline within 1–3 miles? Heavy new supply typically softens prices + rents 12–24 months out; constrained supply supports both.
Investment metrics
- 1% rule
- 1.05% ✓
- Cap rate
- 8.00%
- Cash-on-cash
- 6.10%
- DSCR
- 1.27
- GRM
- 7.9
CMA / ARV
- ARV (median comp)
- $513,461
- List price
- $169,900
- Delta
- -66.91%
- Verdict
- UNDERPRICED
- Comps
- 20 within 1.0 mi
Projected returns pro-forma
-3.0% appreciation · 1.01% rent growth · sell at horizon
- IRR
- -11.7%
- Equity multiple
- 0.58×
- Total profit
- $-19,813
- Equity at exit
- $25,333
- IRR
- -5.9%
- Equity multiple
- 0.65×
- Total profit
- $-16,470
- Equity at exit
- $14,690
Cash invested: $47,572 (down + closing). Projections, not guarantees.
Landlord ↔ Tenant lean methodology
- Overall (STATE)
- 87 Strongly Landlord-Friendly
- State Arizona
- 87 Strongly Landlord-Friendly · R+3
- County
- — inherits STATE
- City
- — inherits STATE
ZIP-level market 86305
- Home prices YoY
- -18.7%
- Rents YoY
- 1.0%
- Active inventory
- 707
- Price-to-rent
- 7.9×
Monthly cashflow live
- Estimated rent
- $1,792 medium interval (Pro) →
- Mortgage (P&I)
- −$891
- Tax est. 1.5%
- −$212 /mo · $2,548/yr
- Insurance
- −$71
- Flood insurance flood zone
- −$66 /mo · $798/yr
- HOA
- −$0
- Vacancy / Maint / Mgmt
- −$376
- Net cashflow
- $175
Break-even live
Sensitivity live
| Price | -10% $293 | -5% $234 | +0% $175 | +5% $117 | +10% $58 |
|---|---|---|---|---|---|
| Rent | -10% $34 | -5% $105 | +0% $175 | +5% $246 | +10% $317 |
| Rate | -1.0pp $261 | -0.5pp $219 | base $175 | +0.5pp $131 | +1.0pp $87 |
UW: 25.0% down · 7.5% · 30yr · 1.5% tax · 5.0% vac · 8.0% maint · 8.0% mgmt
Financing live
Cash to close
- Down payment
- $42,475
- Closing costs
- $5,097
- Reserves months
- —
- Total cash needed
- —
Loan-product check · same deal, 3 products live
Conventional
25% down · 7.5% · 30yr
- Down + closing
- —
- Monthly P&I
- —
- Monthly cashflow
- —
- DSCR
- —
- Eligible?
- —
Personal DTI + credit; lowest rate.
DSCR
20% down · 8.5% · 30yr
- Down + closing
- —
- Monthly P&I
- —
- Monthly cashflow
- —
- DSCR
- —
- Eligible?
- —
No personal income docs; deal must DSCR.
Hard money
10% down · 12.0% · 12mo
- Down + closing
- —
- Monthly P&I
- —
- Monthly cashflow
- —
- DSCR
- —
- Eligible?
- —
Short-term bridge; refi at stabilization.
Listing history 18 events
-
2026-06-21days on market $169,900 Active 87 DOM
-
2026-06-18days on market $169,900 Active 84 DOM
-
2026-06-17days on market $169,900 Active 83 DOM
-
2026-06-16days on market $169,900 Active 82 DOM
-
2026-06-15days on market $169,900 Active 81 DOM
-
2026-06-14days on market $169,900 Active 79 DOM
-
2026-06-13days on market $169,900 Active 78 DOM
-
2026-06-10days on market $169,900 Active 76 DOM
-
2026-06-09days on market $169,900 Active 75 DOM
-
2026-06-08days on market $169,900 Active 74 DOM
-
2026-06-07days on market $169,900 Active 73 DOM
-
2026-06-05days on market $169,900 Active 70 DOM
-
2026-06-02days on market $169,900 Active 68 DOM
-
2026-06-01days on market $169,900 Active 67 DOM
-
2026-05-31days on market $169,900 Active 66 DOM
-
2026-05-30days on market $169,900 Active 65 DOM
-
2026-03-25$169,900 Active 772-char remark
Show marketing remark (772 chars)
Welcome to this beautifully situated corner lot home in Prescott offering versatility and scenic Arizona living. Enjoy stunning mountain views and mature trees right from your doorstep, creating a peaceful setting.Inside, you'll find a spacious living room ideal for entertaining or relaxing, along with multiple Arizona rooms that provide endless possibilities for additional living, dining, or hobby spaces filled with natural light. The primary suite features a unique hidden flex space within the closet, perfect for a home office, private retreat, or extra storage.Located in a desirable community, residents enjoy access to amenities including a clubhouse, fitness center, pool, and hot tub.Don't miss this versatile home with incredible views and standout features!
-
2018-07-31soldstatus $79,900 443-char remark
Show marketing remark (443 chars)
This is a 55+ community. Land is leased. One title holder must be 55 or older. This home has a great view of about 40 miles. There is a screened porch plus two additional rooms not counted in the square footage. So this home lives like a triple wide. Amenities include pool, spa, clubhouse, tennis court, billiard room, workout room, community kitchen and meeting room, 2 lakes, dog park, miles of hiking trails and nature trails nearby.
ⓘ Source: listings_history table (triggers on properties + properties_extension) + one-shot
backfill from property_details.listing_events for pre-trigger history.
Climate risk First Street
- Flood 9/10 Extreme FEMA zone X (unshaded) · 99% chance over 30 yrs
- Wildfire 5/10 Major
- Heat 3/10 Moderate 8 d/yr ≥91°F today · 22 d/yr by 30 yrs out
- Wind 1/10 Low
- Air quality 1/10 Low 0 unhealthy d/yr today · 0 by 30 yrs out
Nearby sold comps map
Loading sold comps map…
Walkable amenities ~0.75 mi
Loading nearby amenities…
Taxation est. · year 1
- Rental income
- $21,508
- − Mortgage interest
- −$9,517
- − Property taxes
- −$2,548
- − Insurance
- −$1,647
- − Repairs & maintenance
- −$1,721
- − Management
- −$1,721
- − Depreciation
- −$4,943
- Taxable loss
- −$588
- Est. tax savings @ 24.0%
- +$141
- After-tax cash flow
- $2,246/yr
For passive investors: Depreciation is non-cash, so a rental often shows a tax loss while cash-flowing — sheltering income. Rental losses are passive: they offset passive income freely, and up to $25,000/yr can offset ordinary (W-2) income if you actively participate and your MAGI is under $100k (phasing out to $0 by $150k); unused losses carry forward. On sale, claimed depreciation is recaptured at up to 25%, and gains may owe capital-gains tax (a 1031 exchange can defer both). Figures are a year-1 estimate at your 24.0% rate — not tax advice; consult a CPA.
Condition & rehab AI · 12 photos
This home is in good condition with a good condition score of 75. It has a good roof, exterior, flooring, and interior walls/paint. The home is move-in ready with minor cosmetic updates that would increase its resale and rental value.
Value-add opportunities
- Resale Paint exterior — Enhances curb appeal and home value
- Resale Replace gutters — Improves home's appearance and functionality
- Both Update kitchen appliances — Modernizes kitchen and attracts buyers
- Both Install smart home features — Enhances home's appeal and energy efficiency
Renovation cost estimate screening
Value-add ROI direction
- Resale Paint exterior — Enhances curb appeal and home value ↑
- Resale Replace gutters — Improves home's appearance and functionality ↑
- Both Update kitchen appliances — Modernizes kitchen and attracts buyers ↑
- Both Install smart home features — Enhances home's appeal and energy efficiency ↑
ⓘ Cost ranges are severity-bucket heuristics (US national rule-of-thumb). Get contractor quotes + a written scope before underwriting a rehab budget.
Schools (NCES district)
- District
- Prescott Unified District (4466)
- NCES district ID
- 0406730
- Math proficiency
- 34% ▼ -16.00%
- Reading proficiency
- 44% ▼ -13.00%
- Median HH income
- $48,354
- Composite
- 33.47/100
- National rank
- #5450
- State rank
- #70 of 249 in AZ
Livability — Prescott
- Score
- 73/100
- State rank
- #22
- US rank
- #5579
Category grades
Schools grade is shown separately in the Schools card above.
Census & demographics
- County
- Yavapai County · 190,406 people
- City population
- 66,312
- Metro
- Prescott Valley-Prescott, AZ
- Population (ZIP)
- 19,790
- Household income
- $80,436
- Rent vs Own
- Severe rent burden
- 380.0
Population outlook (Yavapai County) Hauer SSP2
- Today (2025)
- 241,389 people
- By 2030
- 249,523 · +3.4%
- By 2040
- 259,966 · +7.7%
- By 2050
- 264,736 · +9.7%
- By 2075
- 269,334 · +11.6%
- By 2100
- 256,505 · +6.3%
Race, ethnicity, and origin ACS 2023
- Neighborhood character
- Predominantly White (86%)
- Race & ethnicity
- White 86% Hispanic / Latino 8% Two or more races 6% Asian 1%
- Hispanic origin (detail)
- Mexican 5% Puerto Rican 2%
- Common ancestry
- Slovak 4% Italian 3% Lithuanian 3%
- Foreign-born
- 4% · Canada
- Languages at home
- 95% English-only · Spanish 3%
Political lean MEDSL · Yavapai
- 2024 margin
- Solid R (+33.9) · D 32.6% · R 66.5%
- 2008→2024 swing
- -9.5pp toward R · 2008: -24.4pp · 2024: -33.9pp
- All cycles
- 2024: R+33.9 2020: R+29.3 2016: R+31.4 2012: R+30.7 2008: R+24.4
Not yet ingested
- Civics
- —
Market trends
- HPI YoY
- ▼ -80.31%
- Current HPI
- 348.5199
- Rent YoY
- ▲ 1.01%
- Metro
- Prescott Valley-Prescott, AZ
- State GDP YoY
- ▲ 4.54%
- F500 in state
- 20
Industry mix (Fortune 500 HQ in AZ)
| Industry | F500 HQs | Revenue |
|---|---|---|
| Technology | 2 | $13B |
|
||
| Mining / Metals | 1 | $23B |
|
||
| Environmental Services | 1 | $16B |
|
||
| Metals / Steel | 1 | $14B |
|
||
| Technology Distribution | 1 | $9B |
|
||
| Homebuilding | 1 | $8B |
|
||
Price history
+112.6% since first listed2 events — show timeline
- 2026-03-25 Listed $169,900 PAARMLS as Distributed by MLS Grid
- 2018-07-31 Sold (MLS) $79,900 PAARMLS as Distributed by MLS Grid
Cash-flow waterfall
monthlySold comps — $/sqft
last 12 mo · ≤1 miLoading sold comps…