4 N Forest Beach Dr #208 · Hilton Head Island, SC
Flood risk No data
- FEMA flood zone
- —
- Chance of flooding over 30 yrs
- —
- Est. flood insurance / yr
- —
Fire risk No data
- Est. fire insurance / yr
- —
Heat risk No data
- Hot days now (above threshold)
- —
- Hot days in 30 yrs
- —
Wind risk No data
- Chance of severe wind over 30 yrs
- —
Air-quality risk No data
- Unhealthy air days now
- —
- Unhealthy air days in 30 yrs
- —
Risk factors via First Street. Map © Google.
Why this score? — see what drove the D+ grade
The composite is a weighted blend of 9 inputs, each scored 0–100. Each bar is that input's sub-score; the figure is the points it added to the 100-point composite (weight × sub-score).
- ARV discount +15.0/15.0
- Cash flow +8.4/30.0
- Appreciation +6.6/10.0
- 1% rule +4.5/10.0
- Schools +4.1/10.0
- Rent growth +3.3/5.0
- Livability +3.2/5.0
- Condition / age +2.5/5.0
- DSCR +2.3/10.0
$360,000
🖨 Deal sheet 📄 Offer letter ✓ Due diligence
Listing remarks MLS
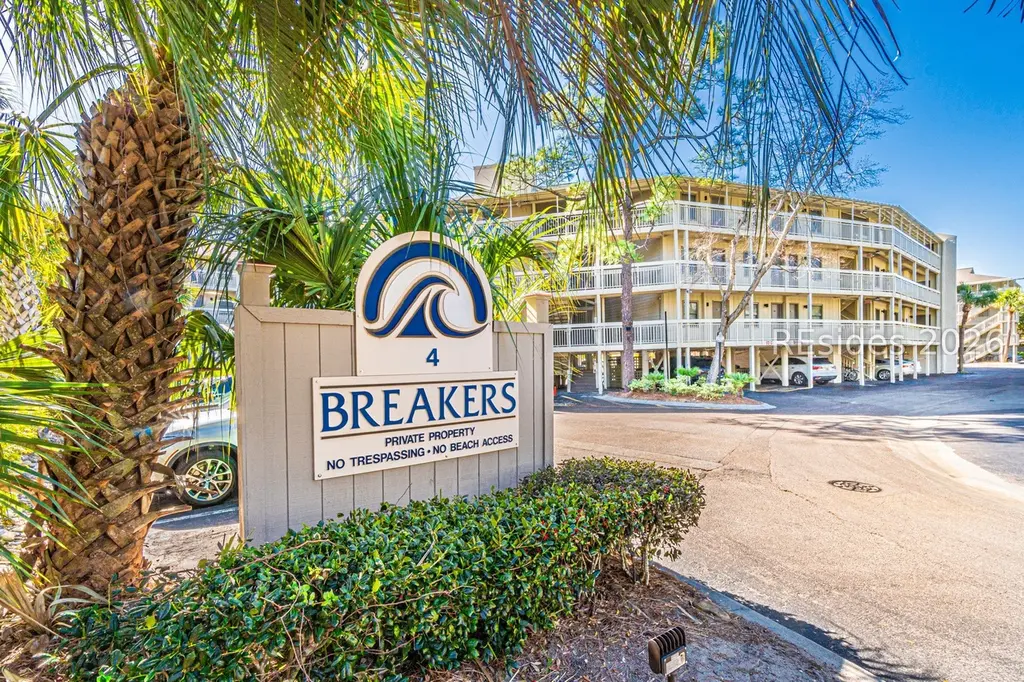
This niсelу updаtеd 2nd floor villа аt The Breakers is loсаted almost directly on the beach and in front of Coligny Plaza for all your shopping, dining and entertainment needs. The infamous Tiki Hut is just down the beach too! The Breakers amenties include elevators, a solar-heated community pool, direct beach access, a playground and on-site security. Great rental history, as well!
Key facts
- On-site security
- Community pool
- Direct beach access
Tags
Neighborhood map
What this means for you Summary
Snapshot
- This is a 1-bed/1.0-bath condo listed at $360k.
Deal economics
- At list price, monthly cash flow is $-322 ($-4k/yr) — negative.
- The deal already cash-flows at list — no discount required.
- To meet the 1% rule (rent ≥ 1% of price), the offer needs to be $344k (4.5% below list).
- Recommended offer: $328k (9.0% below list) — sets the bar for market timing.
- Cap rate 5.2% vs local median 3.0% in Hilton Head Island — top-decile yield for the area; either an underpriced asset or a hidden risk that comps aren't pricing in. Stress-test before assuming the spread holds.
Location & tenants
- Location reads 64/100 on livability (#157 in SC) — a middle-class / working-renter tenant base. Strengths: employment A+, crime A-; Watch: amenities F, commute F, cost of living F.
- Beaufort 01 (town): math 42% / reading 51% proficiency, ranked #17 of 80 in SC (top 21%) — families likely to look elsewhere, expect single-tenant / working-renter base with shorter leases.
- Market conditions: Rents rising (+3.2%/yr); 838 active listings in the ZIP; 4 comparable units currently listed for rent nearby; rentals at typical pace (median 21d on market — plan ~3-4 weeks tenant-placement turnaround); solid renter incomes; 1,824 units permitted in Beaufort County in 2024 (618 in 5+ unit buildings).
- This rent runs 42% of the median local income ($98k/yr) — at the standard rent-burdened threshold; future hikes will face affordability resistance.
Forward outlook
- In year one you build about $14k of equity ($2k loan paydown + $12k appreciation (3.2% local appreciation)).
- Beaufort County population projected at +30% by 2050 — long-run rental-demand tailwind backs the buy-and-hold thesis.
- By year 3, paydown + projected appreciation supports a ~$35k cash-out refi (75% LTV) — recoverable capital for the next deal without selling this one.
Negotiation context
- It's been on market 118 days — a 9% lower offer ($328k) is reasonable based on typical stale-listing flexibility.
- 10 sale attempts since 22y ago with the ask held roughly flat each time — persistent listings suggest the price (not the market) is what's stuck; bring a comps-based counter.
Questions for the listing agent
- What do current leases actually rent for vs. the listed asking? Can we see a recent rent roll and the last 12 months of T-12 income?
- It's been on market 118 days. Have you received any prior offers? Is the seller open to a 9% concession, seller financing, or rate buy-down credit?
- Built in 1979 — when were the roof, HVAC, electrical panel, plumbing, and water heater last replaced?
- What does the HOA fee cover, when was the last increase, and are there any pending special assessments or reserve-fund shortfalls?
- Any open or pending special assessments — roof, HVAC, plumbing, elevator, façade? What's the per-unit balance and payoff schedule, and is the seller paying it off at close or rolling it to the buyer?
- Why hasn't it sold? Are there any deal-killer items the seller is aware of (foundation, flood, title, zoning, code violations)?
- Is there a deadline driving the sale (1031 exchange, divorce, estate, relocation)? That informs how much negotiation room exists.
- Schools are B-rated — typically a magnet for longer-tenancy family renters. What's the average tenant stay here, and is there a school-zone premium baked into asking?
- The area grade is low — what's the realistic commute time and amenity access for the typical tenant pool here? Any planned neighborhood developments (good or bad) we should know about?
- What's the average days-on-market for RENTAL listings here right now (not sales)? A rising rental-DOM trend means longer vacancies and softer asking-rent achievability than the comps imply.
- What's the recent tenant-quality profile in this submarket — average credit score on applications, eviction rate, late-payment / NSF rate, and stable-employment percentage? A property-management company in the area should have these aggregated.
- How much new apartment / multifamily construction is in the pipeline within 1–3 miles? Heavy new supply (>2% of stock underway) typically softens rents 12–24 months out; light construction supports rent growth.
Investment metrics
- 1% rule
- 0.95% ✗
- Cap rate
- 5.22%
- Cash-on-cash
- -3.83%
- DSCR
- 0.83
- GRM
- 8.7
CMA / ARV
- ARV (median comp)
- $459,020
- List price
- $360,000
- Delta
- -21.57%
- Verdict
- UNDERPRICED
- Comps
- 20 within 1.0 mi
Projected returns pro-forma
3.21% appreciation · 3.23% rent growth · sell at horizon
- IRR
- 4.8%
- Equity multiple
- 1.28×
- Total profit
- $28,019
- Equity at exit
- $166,092
- IRR
- 8.0%
- Equity multiple
- 2.24×
- Total profit
- $125,332
- Equity at exit
- $259,299
Cash invested: $100,800 (down + closing). Projections, not guarantees.
Landlord ↔ Tenant lean methodology
- Overall (STATE)
- 90 Strongly Landlord-Friendly
- State South Carolina
- 90 Strongly Landlord-Friendly · R+6
- County
- — inherits STATE
- City
- — inherits STATE
ZIP-level market 29928
- Home prices YoY
- 1.3%
- Rents YoY
- 3.2%
- Active inventory
- 838
- Price-to-rent
- 8.7×
Monthly cashflow live
- Estimated rent
- $3,437 medium interval (Pro) →
- Mortgage (P&I)
- −$1,888
- Tax from tax record
- −$449 /mo · $5,387/yr
- Insurance
- −$150
- HOA est. from 15 same-building comps
- −$550
- Vacancy / Maint / Mgmt
- −$722
- Net cashflow
- $-322
Break-even live
UW: 25.0% down · 7.5% · 30yr · 1.5% tax · 5.0% vac · 8.0% maint · 8.0% mgmt
Financing live
Cash to close
- Down payment
- $90,000
- Closing costs
- $10,800
- Reserves months
- —
- Total cash needed
- —
Loan-product check · same deal, 3 products live
Conventional
25% down · 7.5% · 30yr
- Down + closing
- —
- Monthly P&I
- —
- Monthly cashflow
- —
- DSCR
- —
- Eligible?
- —
Personal DTI + credit; lowest rate.
DSCR
20% down · 8.5% · 30yr
- Down + closing
- —
- Monthly P&I
- —
- Monthly cashflow
- —
- DSCR
- —
- Eligible?
- —
No personal income docs; deal must DSCR.
Hard money
10% down · 12.0% · 12mo
- Down + closing
- —
- Monthly P&I
- —
- Monthly cashflow
- —
- DSCR
- —
- Eligible?
- —
Short-term bridge; refi at stabilization.
Rent comps 4 comps
| Address | Beds | Baths | Sqft | Rent | $/sqft | DOM | Units | Dist |
|---|---|---|---|---|---|---|---|---|
| 4 N Forest Beach Dr Unit 1436439P Hilton Head Island, SC | 1.0 | 1.0 | 516 | $4,092 | $7.93 | 43d | 1 | 0.03mi |
| 21 Lagoon Rd Unit 1508866P Hilton Head Island, SC | 2.0 | 2.0 | 742 | $2,687 | $3.62 | 13d | 1 | 0.25mi |
| 23 S Forest Beach Dr Unit 1316238P Hilton Head Island, SC | 1.0 | 1.0 | 645 | $3,185 | $4.94 | 21d | 1 | 0.40mi |
| 10 Lemoyne Ave Hilton Head Island, SC | 1.0 | 1.0 | 500 | $1,700 | $3.40 | 13d | 1 | 0.62mi |
HOA detail condo
- Monthly dues
- $0 · $0/yr
- Likely covers
- poolsecurity
- Assessments
- None detected in remarks — confirm with the listing agent.
Listing history 38 events
-
2026-06-18days on market $360,000 Active 118 DOM
-
2026-06-17days on market $360,000 Active 117 DOM
-
2026-06-16days on market $360,000 Active 116 DOM
-
2026-06-15days on market $360,000 Active 115 DOM
-
2026-06-14days on market $360,000 Active 113 DOM
-
2026-06-13days on market $360,000 Active 112 DOM
-
2026-06-10days on market $360,000 Active 110 DOM
-
2026-06-09days on market $360,000 Active 109 DOM
-
2026-06-08days on market $360,000 Active 108 DOM
-
2026-06-07days on market $360,000 Active 107 DOM
-
2026-06-05days on market $360,000 Active 104 DOM
-
2026-06-03days on market $360,000 Active 103 DOM
-
2026-06-02days on market $360,000 Active 102 DOM
-
2026-06-01days on market $360,000 Active 101 DOM
-
2026-05-31days on market $360,000 Active 100 DOM
-
2026-03-18price $360,000 385-char remark
Show marketing remark (385 chars)
This niсelу updаtеd 2nd floor villа аt The Breakers is loсаted almost directly on the beach and in front of Coligny Plaza for all your shopping, dining and entertainment needs. The infamous Tiki Hut is just down the beach too! The Breakers amenties include elevators, a solar-heated community pool, direct beach access, a playground and on-site security. Great rental history, as well!
-
2026-02-20$370,000 Active 385-char remark
Show marketing remark (385 chars)
This niсelу updаtеd 2nd floor villа аt The Breakers is loсаted almost directly on the beach and in front of Coligny Plaza for all your shopping, dining and entertainment needs. The infamous Tiki Hut is just down the beach too! The Breakers amenties include elevators, a solar-heated community pool, direct beach access, a playground and on-site security. Great rental history, as well!
-
2025-09-09$370,000 Active
-
2024-10-18status Active
-
2024-10-11$400,000
-
2023-03-20soldstatus $360,000 Closed
-
2023-03-13soldstatus $360,000
-
2023-02-12status Pending
-
2023-02-06price $399,000
-
2023-01-30status Active
-
2023-01-30status Active
-
2023-01-24$419,000
-
2018-10-23soldstatus $199,000
-
2018-10-18soldstatus $199,000
-
2018-06-08$209,900
-
2013-08-15soldstatus $110,000
-
2013-08-13soldstatus $110,000
-
2013-05-07$119,000
-
2005-04-25soldstatus $225,000
-
2005-04-22soldstatus $225,000
-
2004-12-09$239,000
-
1990-12-14soldstatus $45,500
-
1979-09-01soldstatus $51,400
ⓘ Source: listings_history table (triggers on properties + properties_extension) + one-shot
backfill from property_details.listing_events for pre-trigger history.
Tax reassessment forecast SC · Resets to sale price
- Current annual tax
- $5,387 · $449/mo
- Projected year-2 tax
- $5,387 · $449/mo
- Expected delta
- $0/yr ($0/mo · 0.0%)
ⓘ Screening estimate from a state-policy table — verify with the county assessor before closing.
Nearby sold comps map
Loading sold comps map…
Walkable amenities ~0.75 mi
Loading nearby amenities…
Taxation est. · year 1
- Rental income
- $41,239
- − Mortgage interest
- −$20,166
- − Property taxes
- −$5,387
- − Insurance
- −$1,800
- − Repairs & maintenance
- −$3,299
- − Management
- −$3,299
- − HOA
- −$6,600
- − Depreciation
- −$10,473
- Taxable loss
- −$9,785
- Est. tax savings @ 24.0%
- +$2,348
- After-tax cash flow
- $-1,515/yr
For passive investors: Depreciation is non-cash, so a rental often shows a tax loss while cash-flowing — sheltering income. Rental losses are passive: they offset passive income freely, and up to $25,000/yr can offset ordinary (W-2) income if you actively participate and your MAGI is under $100k (phasing out to $0 by $150k); unused losses carry forward. On sale, claimed depreciation is recaptured at up to 25%, and gains may owe capital-gains tax (a 1031 exchange can defer both). Figures are a year-1 estimate at your 24.0% rate — not tax advice; consult a CPA.
Schools (NCES district)
- District
- Beaufort 01
- NCES district ID
- 4501110
- Math proficiency
- 42% ▼ -8.00%
- Reading proficiency
- 51% ▲ 2.00%
- Median HH income
- $57,430
- Composite
- 40.56/100
- National rank
- #3699
- State rank
- #17 of 80 in SC
Livability — Hilton Head Island
- Score
- 64/100
- State rank
- #157
- US rank
- #14648
Category grades
Schools grade is shown separately in the Schools card above.
Census & demographics
- Census place
- Hilton Head Island, SC
- County
- Beaufort County · 163,770 people
- City population
- 40,243
- Metro
- Hilton Head Island-Bluffton, SC
- Population (ZIP)
- 15,785
- Household income
- $97,576
- Rent vs Own
- Severe rent burden
- 216.0
Population outlook (Beaufort County) Hauer SSP2
- Today (2025)
- 211,915 people
- By 2030
- 227,272 · +7.2%
- By 2040
- 253,861 · +19.8%
- By 2050
- 275,126 · +29.8%
- By 2075
- 311,022 · +46.8%
- By 2100
- 321,286 · +51.6%
Race, ethnicity, and origin ACS 2023
- Neighborhood character
- Predominantly White (87%)
- Race & ethnicity
- White 87% Hispanic / Latino 6% Two or more races 2% Black 2% Asian 1%
- Hispanic origin (detail)
- Mexican 3%
- Common ancestry
- Lithuanian 4% Slovak 4% Romanian 4%
- Foreign-born
- 9% · Canada, China
- Languages at home
- 91% English-only · Spanish 5% French/Haitian/Cajun 1% Chinese 1%
Political lean MEDSL · Beaufort
- 2024 margin
- R (+14.5) · D 42.1% · R 56.6% · Other 1.2%
- 2008→2024 swing
- -3.7pp toward R · 2008: -10.8pp · 2024: -14.5pp
- All cycles
- 2024: R+14.5 2020: R+10.0 2016: R+14.3 2012: R+17.5 2008: R+10.8
Not yet ingested
- Civics
- —
Market trends
- HPI YoY
- ▲ 3.21%
- Current HPI
- 243.4136
- Rent YoY
- ▲ 3.23%
- Metro
- Hilton Head Island-Bluffton, SC
- State GDP YoY
- ▲ 4.51%
- F500 in state
- 2
Industry mix (Fortune 500 HQ in SC)
| Industry | F500 HQs | Revenue |
|---|---|---|
| Packaging | 1 | $7B |
|
||
Price history
+600.4% since first listed23 events — show timeline
- 2026-03-18 Price Changed $360,000 RSMLS
- 2026-02-20 Listed $370,000 RSMLS
- 2025-09-09 Listed $370,000 RSMLS
- 2024-10-18 Relisted — RSMLS
- 2024-10-11 Listed $400,000 RSMLS
- 2023-03-20 Sold (MLS) $360,000 RSMLS
- 2023-03-13 Sold (Public Records) $360,000 Public Records
- 2023-02-12 Pending — RSMLS
- 2023-02-06 Price Changed $399,000 RSMLS
- 2023-01-30 Relisted — RSMLS
- 2023-01-30 Relisted — RSMLS
- 2023-01-24 Listed $419,000 RSMLS
- 2018-10-23 Sold (MLS) $199,000 RSMLS
- 2018-10-18 Sold (Public Records) $199,000 Public Records
- 2018-06-08 Listed $209,900 RSMLS
- 2013-08-15 Sold (Public Records) $110,000 Public Records
- 2013-08-13 Sold (MLS) $110,000 RSMLS
- 2013-05-07 Listed $119,000 RSMLS
- 2005-04-25 Sold (Public Records) $225,000 Public Records
- 2005-04-22 Sold (MLS) $225,000 RSMLS
- 2004-12-09 Listed $239,000 RSMLS
- 1990-12-14 Sold (Public Records) $45,500 Public Records
- 1979-09-01 Sold (Public Records) $51,400 Public Records
Property tax history
+11.9%/yrLatest (2025): $5,387 · +1.1% YoY. Source: county tax records.
Cash-flow waterfall
monthlySold comps — $/sqft
last 12 mo · ≤1 miLoading sold comps…