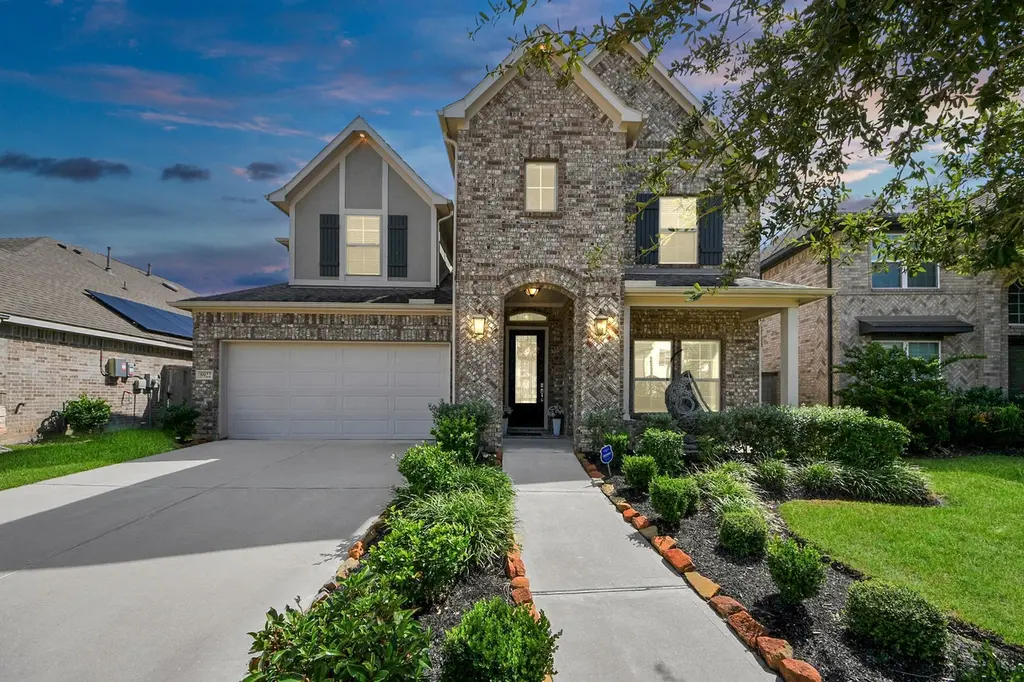
8922 Golden Mist Dr · Sienna, TX
Flood risk 1/10 · Minimal
- FEMA flood zone
- X
- Chance of flooding over 30 yrs
- 0.0%
- Est. flood insurance / yr
- $507 – $1,088
Fire risk 4/10 · Minor
- Est. fire insurance / yr
- $1,222 – $2,270
Heat risk 9/10 · Severe
- Hot days now (above 111°F)
- 7 days/yr
- Hot days in 30 yrs
- 23 days/yr
Wind risk 9/10 · Severe
- Chance of severe wind over 30 yrs
- 99.0%
Air-quality risk 2/10 · Minimal
- Unhealthy air days now
- 2 days/yr
- Unhealthy air days in 30 yrs
- 2 days/yr
Risk factors via First Street. Map © Google.
Why this score? — see what drove the C- grade
The composite is a weighted blend of 9 inputs, each scored 0–100. Each bar is that input's sub-score; the figure is the points it added to the 100-point composite (weight × sub-score).
- Cash flow +16.4/30.0
- ARV discount +6.9/15.0
- 1% rule +6.4/10.0
- DSCR +5.1/10.0
- Schools +4.5/10.0
- Appreciation +4.2/10.0
- Rent growth +2.5/5.0
- Livability +2.5/5.0
- Condition / age +2.5/5.0
$469,990
🖨 Deal sheet (PDF) 📄 Offer letter ✓ Due diligence
Listing remarks
Beautifully designed two-story home tucked near the end of a quiet cul-de-sac in Sienna. Built by Newmark Homes in 2020, it offers timeless curb appeal with a brick exterior and a welcoming covered front porch. Inside, the layout is both functional and inviting. Two bedrooms are located downstairs, perfect for guests, multigenerational living, or a private office. The engineered hardwood floors and natural light create a warm, open feel throughout. The kitchen features quartz countertops, a spacious island, and stainless steel appliances. It flows into the living room, where a cozy corner fireplace adds charm and comfort. Step outside to a covered patio. It's a great space to relax, enterta
Key facts
- Covered front porch
- Quartz countertops
- Brick exterior
Tags
Property features AI
Finance
- Other: Living area approximately 3,134 (listed)
- Financial info: No lease considered
- HOA & community: Sienna Residential Association; Association fee $1,205 annually
Exterior
- Parking: Attached garage (2 spaces)
- Security: No security details provided
- Utilities: Public water; Public sewer
- Home design: Residential property; Built in 2020; Slab foundation
- Construction: Brick and cement siding exterior; Composition roof
- Exterior features: Covered patio; Patio; Covered deck/patio; Property on a cul-de-sac
Interior
- Kitchen: Dishwasher; Electric oven; Gas cooktop; Disposal; Microwave; Quartz counters; Kitchen island; Walk-in pantry
- Bedrooms: Primary bedroom on first floor (13x17); First-floor bedroom (12x11); Second-floor bedroom (12x11); Second-floor bedroom (11x12); Second-floor bedroom (11x13); Game room on second floor (15x15)
- Flooring: Carpet; Engineered hardwood
- Bathrooms: 4 full bathrooms
- Heating & cooling: Central heating (gas, zoned); Central air conditioning (electric, zoned)
- Interior features: Gas log fireplace (one); Double vanities; Kitchen island; Quartz countertops; Separate shower; Walk-in pantry; 7 total rooms
- Laundry & utility: No specific laundry details provided
Neighborhood map
What this means for you Summary
Snapshot
- This is a 5-bed/4.0-bath single-family listed at $470k.
Deal economics
- At list price, monthly cash flow is $265 ($3k/yr) — positive.
- The deal already cash-flows at list — no discount required.
- Meets the 1% rule at list price ($5k rent vs $470k).
- Recommended offer: $456k (3.0% below list) — sets the bar for market timing.
- Cap rate 7.0% vs local median 3.3% in Sienna — top-decile yield for the area; either an underpriced asset or a hidden risk that comps aren't pricing in. Stress-test before assuming the spread holds.
Location & tenants
- Location reads: area grade C — affects rentability + tenant quality, not the cash-flow math above.
- Fort Bend ISD (suburban): math 44% / reading 53% proficiency, ranked #140 of 826 in TX (top 17%) — families likely to look elsewhere, expect single-tenant / working-renter base with shorter leases.
- Zoned schools: Ronald Thornton Middle (math 40% / reading 52%, grade D+, #462 of 1,662 statewide, top 28%, 1,529 students, 41% FRL).
- Market conditions: Rents soft (-0.1%/yr); 1229 active listings in the ZIP; 4 comparable units currently listed for rent nearby; rentals leasing fast (median 12d on market — plan ~1-2 weeks tenant-placement turnaround); high-income renter base; 12,093 units permitted in Fort Bend County in 2024 (815 in 5+ unit buildings).
- At $5,335/mo this rent would consume 50% of the median local household income ($129k/yr) (locally 1004% of renters already pay >50% of income on rent) — very limited rent-growth headroom before tenants either downsize or default.
Forward outlook
- Local home prices are declining (-1.7%/yr); year-one equity from $3k of loan paydown is wiped out by about $8k of value loss. Plan a longer hold.
- Fort Bend County population projected at +75% by 2050 — long-run rental-demand tailwind backs the buy-and-hold thesis.
Negotiation context
- It's been on market 59 days — a 3% lower offer ($456k) is reasonable based on typical stale-listing flexibility.
- 4 sale attempts since 7y ago with the ask held roughly flat each time — persistent listings suggest the price (not the market) is what's stuck; bring a comps-based counter.
Risks & watch-outs
- Watch-outs: property tax is 3.0% of price.
- Climate carrying-cost: severe wind risk, 99% chance of damaging wind over 30y; extreme-heat days projected 7→23/yr by 2055 (HVAC capex compounding) — expect insurance premiums to compound above CPI over the hold.
Questions for the listing agent
- It's been on market 59 days. Have you received any prior offers? Is the seller open to a 3% concession, seller financing, or rate buy-down credit?
- Property tax is high relative to price — has the assessment been appealed recently, and will the sale trigger a re-assessment?
- What does the HOA fee cover, when was the last increase, and are there any pending special assessments or reserve-fund shortfalls?
- Is there a deadline driving the sale (1031 exchange, divorce, estate, relocation)? That informs how much negotiation room exists.
- What's the average days-on-market for RENTAL listings here right now (not sales)? A rising rental-DOM trend means longer vacancies and softer asking-rent achievability than the comps imply.
- What's the recent tenant-quality profile in this submarket — average credit score on applications, eviction rate, late-payment / NSF rate, and stable-employment percentage? A property-management company in the area should have these aggregated.
- How much new for-sale + rental construction is in the pipeline within 1–3 miles? Heavy new supply typically softens prices + rents 12–24 months out; constrained supply supports both.
Investment metrics
- 1% rule
- 1.14% ✓
- Cap rate
- 6.97%
- Cash-on-cash
- 2.42%
- DSCR
- 1.11
- GRM
- 7.3
CMA / ARV
- ARV (median comp)
- $464,064
- List price
- $469,990
- Delta
- 1.28%
- Verdict
- FAIR
- Comps
- 20 within 1.0 mi
Show comp detail 12 sales within ~0.75 mi
| Address | Dist | Beds/Ba | Sqft | Sold | Price | $/sf | Match |
|---|---|---|---|---|---|---|---|
| 8815 Iron Forge Rd | 0.23mi | 4/3.5 (-1) | 3,275 (+6%) | 2mo | $535,000 | $163 | 71 |
| 9010 Bayou Spring Ct | 0.41mi | 4/3.0 (-1) | 3,180 (+3%) | 1mo | $605,000 | $190 | 67 |
| 8919 Autumn Pine Dr | 0.18mi | 4/3.5 (-1) | 3,439 (+11%) | 3mo | $597,000 | $174 | 64 |
| 9418 San Marco Dr | 0.43mi | 4/4.5 (-1) | 3,266 (+6%) | 4mo | $745,000 | $228 | 61 |
| 1939 Creekwood Cv | 0.48mi | 4/4.0 (-1) | 3,344 (+8%) | 2mo | $594,990 | $178 | 57 |
| 9019 Serenity Frst | 0.31mi | 4/4.5 (-1) | 3,474 (+12%) | 3mo | $824,900 | $237 | 56 |
| 9227 Turtle Pond Ln | 0.47mi | 4/4.0 (-1) | 3,404 (+10%) | 2mo | $600,000 | $176 | 55 |
| 2610 Lazy Vine Ln | 0.64mi | 4/4.5 (-1) | 2,907 (-6%) | 1mo | $715,000 | $246 | 52 |
| 9507 Shaded Tree Dr | 0.63mi | 4/3.5 (-1) | 2,935 (-5%) | 4mo | $445,000 | $152 | 51 |
| 1506 Country Air Ln | 0.70mi | 4/3.5 (-1) | 2,808 (-9%) | 4mo | $425,000 | $151 | 42 |
| 2618 Lazy Vine Ln | 0.65mi | 4/3.5 (-1) | 3,478 (+12%) | 1mo | $750,000 | $216 | 41 |
| 1639 Rosedale Dr | 0.67mi | 4/3.0 (-1) | 2,763 (-11%) | 4mo | $399,950 | $145 | 38 |
Match score weights: distance 35% · size 25% · config 20% · recency 20%. Top-matched comps best support the ARV.
Projected returns pro-forma
-1.67% appreciation · 0.0% rent growth · sell at horizon
- IRR
- -9.1%
- Equity multiple
- 0.64×
- Total profit
- $-47,606
- Equity at exit
- $98,570
- IRR
- -5.6%
- Equity multiple
- 0.59×
- Total profit
- $-53,748
- Equity at exit
- $91,300
Cash invested: $131,597 (down + closing). Projections, not guarantees.
Landlord ↔ Tenant lean methodology
- Overall (STATE)
- 87 Strongly Landlord-Friendly
- State Texas
- 87 Strongly Landlord-Friendly · R+5
- County
- — inherits STATE
- City
- — inherits STATE
ZIP-level market 77459
- Home prices YoY
- -0.8%
- Rents YoY
- -0.1%
- Active inventory
- 1229
- Price-to-rent
- 7.3×
Monthly cashflow live
- Estimated rent
- $5,335 medium interval (Pro) →
- Mortgage (P&I)
- −$2,465
- Tax from tax record
- −$1,189 /mo · $14,269/yr
- Insurance
- −$196
- HOA
- −$100
- Vacancy / Maint / Mgmt
- −$1,120
- Net cashflow
- $265
Break-even live
Sensitivity live
| Price | -10% $531 | -5% $398 | +0% $265 | +5% $132 | +10% $-1 |
|---|---|---|---|---|---|
| Rent | -10% $-156 | -5% $54 | +0% $265 | +5% $476 | +10% $687 |
| Rate | -1.0pp $502 | -0.5pp $385 | base $265 | +0.5pp $143 | +1.0pp $20 |
UW: 25.0% down · 7.5% · 30yr · 1.5% tax · 5.0% vac · 8.0% maint · 8.0% mgmt
Financing live
Cash to close
- Down payment
- $117,498
- Closing costs
- $14,100
- Reserves months
- —
- Total cash needed
- —
Loan-product check · same deal, 3 products live
Conventional
25% down · 7.5% · 30yr
- Down + closing
- —
- Monthly P&I
- —
- Monthly cashflow
- —
- DSCR
- —
- Eligible?
- —
Personal DTI + credit; lowest rate.
DSCR
20% down · 8.5% · 30yr
- Down + closing
- —
- Monthly P&I
- —
- Monthly cashflow
- —
- DSCR
- —
- Eligible?
- —
No personal income docs; deal must DSCR.
Hard money
10% down · 12.0% · 12mo
- Down + closing
- —
- Monthly P&I
- —
- Monthly cashflow
- —
- DSCR
- —
- Eligible?
- —
Short-term bridge; refi at stabilization.
Rent comps 4 comps
| Address | Beds | Baths | Sqft | Rent | $/sqft | DOM | Units | Dist |
|---|---|---|---|---|---|---|---|---|
| 2142 Ironwood Pass Dr Missouri City, TX | 4.0 | 3.0 | 2140 | $6,000 | $2.80 | 0d | 1 | 0.17mi |
| 8719 Fox Trail Dr Missouri City, TX | 4.0 | 3.5 | 2143 | $6,000 | $2.80 | 23d | 1 | 0.41mi |
| 9006 Meadow Bridge Dr Missouri City, TX | 4.0 | 3.5 | 3958 | $6,580 | $1.66 | 4d | 1 | 0.47mi |
| 2718 Van Gogh Ln Missouri City, TX | 4.0 | 2.5 | 3036 | $3,595 | $1.18 | 11d | 1 | 0.63mi |
HOA detail
- Monthly dues
- $100 · $1,200/yr
Listing history 26 events
-
2026-06-21days on market $469,990 Active 59 DOM
-
2026-06-18days on market $469,990 Active 56 DOM
-
2026-06-17days on market $469,990 Active 55 DOM
-
2026-06-16days on market $469,990 Active 54 DOM
-
2026-06-15days on market $469,990 Active 53 DOM
-
2026-06-13days on market $469,990 Active 51 DOM
-
2026-06-09days on market $469,990 Active 47 DOM
-
2026-06-07days on market $469,990 Active 45 DOM
-
2026-06-04days on market $469,990 Active 42 DOM
-
2026-06-03days on market $469,990 Active 41 DOM
-
2026-06-02days on market $469,990 Active 40 DOM
-
2026-06-01days on market $469,990 Active 39 DOM
-
2026-05-31days on market $469,990 Active 38 DOM
-
2026-04-23$469,990 Active 884-char remark
-
2026-04-21historical
-
2026-02-27price $479,990
-
2026-02-04$490,000 Active
-
2026-02-01historical
-
2025-11-08price $499,900
-
2025-10-16price $517,900
-
2025-10-08$529,900 Active
-
2020-07-10soldstatus Sold
-
2020-06-10status Pending
-
2020-04-04price $379,194
-
2020-03-07price $394,194
-
2019-12-09$404,194 Active
ⓘ Source: listings_history table (triggers on properties + properties_extension) + one-shot
backfill from property_details.listing_events for pre-trigger history.
Tax reassessment forecast TX · Resets to sale price
- Current annual tax
- $14,269 · $1,189/mo
- Projected year-2 tax
- $14,269 · $1,189/mo
- Expected delta
- $0/yr ($0/mo · 0.0%)
ⓘ Screening estimate from a state-policy table — verify with the county assessor before closing.
Climate risk First Street
- Flood 1/10 Low FEMA zone X · 0% chance over 30 yrs
- Wildfire 4/10 Moderate
- Heat 9/10 Extreme 7 d/yr ≥111°F today · 23 d/yr by 30 yrs out
- Wind 9/10 Extreme 99% chance of damaging wind over 30 yrs
- Air quality 2/10 Low 2 unhealthy d/yr today · 2 by 30 yrs out
Nearby sold comps map
Loading sold comps map…
Walkable amenities ~0.75 mi
Loading nearby amenities…
Taxation est. · year 1
- Rental income
- $64,023
- − Mortgage interest
- −$26,327
- − Property taxes
- −$14,269
- − Insurance
- −$2,350
- − Repairs & maintenance
- −$5,122
- − Management
- −$5,122
- − HOA
- −$1,200
- − Depreciation
- −$13,672
- Taxable loss
- −$4,039
- Est. tax savings @ 24.0%
- +$969
- After-tax cash flow
- $4,152/yr
For passive investors: Depreciation is non-cash, so a rental often shows a tax loss while cash-flowing — sheltering income. Rental losses are passive: they offset passive income freely, and up to $25,000/yr can offset ordinary (W-2) income if you actively participate and your MAGI is under $100k (phasing out to $0 by $150k); unused losses carry forward. On sale, claimed depreciation is recaptured at up to 25%, and gains may owe capital-gains tax (a 1031 exchange can defer both). Figures are a year-1 estimate at your 24.0% rate — not tax advice; consult a CPA.
Schools (NCES district)
- District
- Fort Bend ISD
- NCES district ID
- 4819650
- Math proficiency
- 44% ▼ -15.00%
- Reading proficiency
- 53% ▼ -4.00%
- Median HH income
- $82,360
- Composite
- 44.61/100
- National rank
- #2779
- State rank
- #140 of 826 in TX
Livability — Sienna
No livability data for this city. (Only ~50 U.S. cities are tracked.)
Census & demographics
- Census place
- Sienna, TX
- County
- Fort Bend County · 836,777 people
- Metro
- Houston-The Woodlands-Sugar Land, TX
- Population (ZIP)
- 84,221
- Household income
- $129,151
- Rent vs Own
- Severe rent burden
- 1004.0
Population outlook (Fort Bend County) Hauer SSP2
- Today (2025)
- 1,004,526 people
- By 2030
- 1,153,104 · +14.8%
- By 2040
- 1,453,718 · +44.7%
- By 2050
- 1,753,781 · +74.6%
- By 2075
- 2,455,772 · +144.5%
- By 2100
- 2,930,528 · +191.7%
Race, ethnicity, and origin ACS 2023
- Neighborhood character
- Highly diverse neighborhood (Simpson 0.75)
- Race & ethnicity
- White 34% Black 26% Asian 22% Hispanic / Latino 13% Two or more races 10%
- Hispanic origin (detail)
- Mexican 7%
- Common ancestry
- Lithuanian 2% Slovak 1% Italian 1%
- Foreign-born
- 21% · Canada, China, Vietnam
- Languages at home
- 73% English-only · Other Asian/Pacific 8% Spanish 7% Other Indo-European 5%
Political lean MEDSL · Fort Bend
- 2024 margin
- Toss-up / Even · D 49.5% · R 47.9% · Other 2.6%
- 2008→2024 swing
- +4.0pp toward D · 2008: -2.4pp · 2024: 1.6pp
- All cycles
- 2024: D+1.6 2020: D+10.6 2016: D+6.6 2012: R+6.8 2008: R+2.4
Not yet ingested
- Civics
- —
Market trends
- HPI YoY
- ▼ -1.67%
- Current HPI
- 212.3573
- Rent YoY
- ▼ -0.15%
- Metro
- Houston-The Woodlands-Sugar Land, TX
- State GDP YoY
- ▲ 3.95%
- F500 in state
- 110
Industry mix (Fortune 500 HQ in TX)
| Industry | F500 HQs | Revenue |
|---|---|---|
| Energy | 16 | $1,198B |
|
||
| Technology | 5 | $198B |
|
||
| Engineering / Construction | 4 | $72B |
|
||
| Energy Services | 3 | $60B |
|
||
| Utilities | 3 | $41B |
|
||
| Healthcare | 2 | $330B |
|
||
Price history
+16.3% since first listed13 events — show timeline
- 2026-04-23 Listed $469,990 HARMLS
- 2026-04-21 Listing Removed — HARMLS
- 2026-02-27 Price Changed $479,990 HARMLS
- 2026-02-04 Listed $490,000 HARMLS
- 2026-02-01 Listing Removed — HARMLS
- 2025-11-08 Price Changed $499,900 HARMLS
- 2025-10-16 Price Changed $517,900 HARMLS
- 2025-10-08 Listed $529,900 HARMLS
- 2020-07-10 Sold (MLS) — HARMLS
- 2020-06-10 Pending — HARMLS
- 2020-04-04 Price Changed $379,194 HARMLS
- 2020-03-07 Price Changed $394,194 HARMLS
- 2019-12-09 Listed $404,194 HARMLS
Property tax history
+49.7%/yrLatest (2025): $14,269 · +8.7% YoY. Source: county tax records.
Cash-flow waterfall
monthlySold comps — $/sqft
last 12 mo · ≤1 miLoading sold comps…