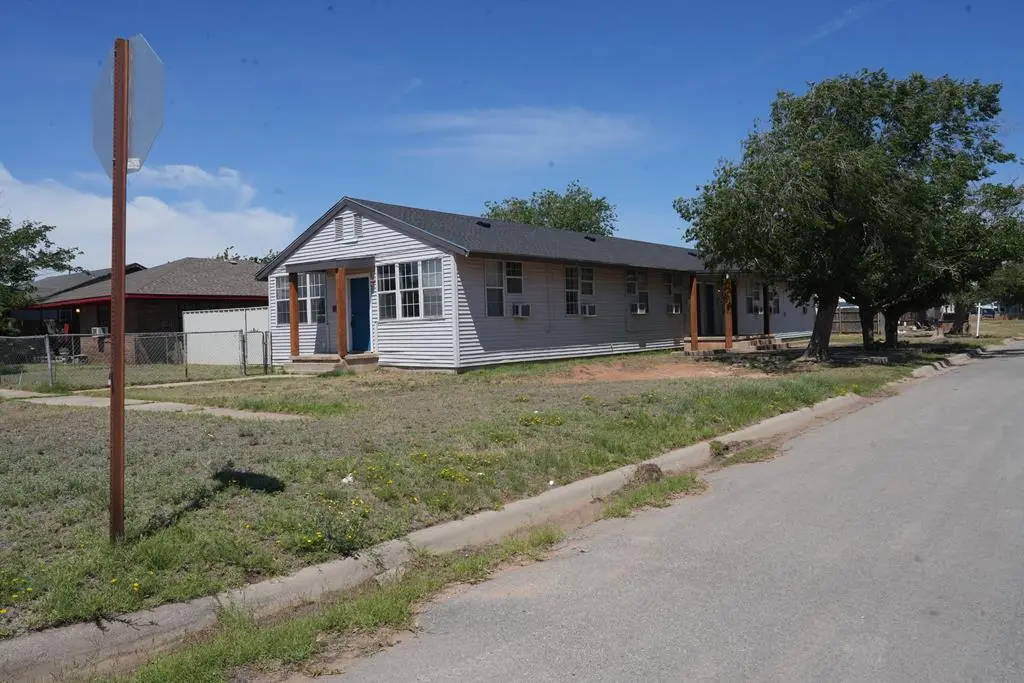
 Fourplex
2400 College Ave · Midland, TX
Flood risk 1/10 · Minimal
- FEMA flood zone
- X
- Chance of flooding over 30 yrs
- 0.0%
- Est. flood insurance / yr
- $507 – $1,088
Fire risk 3/10 · Minor
- Est. fire insurance / yr
- $1,222 – $2,270
Heat risk 6/10 · Moderate
- Hot days now (above 102°F)
- 7 days/yr
- Hot days in 30 yrs
- 22 days/yr
Wind risk 2/10 · Minimal
- Chance of severe wind over 30 yrs
- 3.0%
Air-quality risk 1/10 · Minimal
- Unhealthy air days now
- 0 days/yr
- Unhealthy air days in 30 yrs
- 0 days/yr
Risk factors via First Street. Map © Google.
Why this score? — see what drove the C grade
The composite is a weighted blend of 9 inputs, each scored 0–100. Each bar is that input's sub-score; the figure is the points it added to the 100-point composite (weight × sub-score).
- Cash flow +25.2/30.0
- DSCR +8.3/10.0
- ARV discount +7.5/15.0
- 1% rule +6.0/10.0
- Livability +4.0/5.0
- Schools +3.2/10.0
- Rent growth +2.7/5.0
- Condition / age +2.5/5.0
- Appreciation +0.0/10.0
$400,000
🖨 Deal sheet 📄 Offer letter ✓ Due diligence
Multi-family units
County records classify this as Multi-Family (2-4 Unit). Listing-text estimate: 4 units. confirmed
Listing remarks
4-unit quadplex totaling approximately 2,499 SF All units are 1 bed / 1 bath, approximately 625 SF each Listed for sale at $400,000 Stated pro forma cap rate of 8% Located in Midland, TX, in the heart of the Permian Basin Opportunity to operate as long-term rentals or convert to Airbnb / short-term rental use Seller may assist with up to 6% of closing costs Existing property management in place Investment positioned for workforce housing, contractor housing, or short-term rental demand. Zone SF2 and no "Seller Disclosure", all inspections are to be done by the buyer and adequate will be given
Key facts
- Contractor housing
- 4 unit quadplex
- Workforce housing
Tags
Property features AI
Finance
- Other: Lot size approximately 0.161 acre
- Financial info: Annual taxes reported
Exterior
- Utilities: Public water; Public sewer
- Home design: Residential income property (quadruplex); Single-story; Slab foundation
- Construction: Vinyl siding construction; Slab foundation
- Exterior features: Vinyl siding
Interior
- Kitchen: Electric range
- Heating & cooling: Has cooling; Window Unit(s)
- Interior features: Window air conditioning units; Electric water heater
Neighborhood map
What this means for you Summary
Snapshot
- This is a 4 × 1-bed/1-bath units multifamily listed at $400k.
Deal economics
- At list price, monthly cash flow is $893 ($11k/yr) — positive. Per door: $223/mo.
- The deal already cash-flows at list — no discount required.
- Meets the 1% rule at list price ($4k rent vs $400k).
- Recommended offer: $394k (1.5% below list) — sets the bar for market timing.
- Cap rate 9.0% vs local median 4.7% in Midland — top-decile yield for the area; either an underpriced asset or a hidden risk that comps aren't pricing in. Stress-test before assuming the spread holds.
Location & tenants
- Location reads 79/100 on livability (#57 in TX, #2,192 nationally) — a middle-class / working-renter tenant base. Strengths: employment A+, housing A+, health & safety A+; Watch: crime C-, commute D+, amenities D.
- Midland ISD (urban): math 34% / reading 36% proficiency, ranked #477 of 826 in TX (top 58%) — families likely to look elsewhere, expect single-tenant / working-renter base with shorter leases.
- Zoned schools: San Jacinto J H (math 26% / reading 35%, grade F, #1,036 of 1,662 statewide, top 63%, 829 students, 54% FRL); Midland H S (math 37% / reading 7%, grade F, #1,366 of 1,632 statewide, top 84%, 2,492 students, 44% FRL) — zoned schools at 49% FRL track the district average.
- Market conditions: Rents flat; 113 active listings in the ZIP; 1,504 units permitted in Midland County in 2024 (0 in 5+ unit buildings).
- At $4,415/mo this rent would consume 92% of the median local household income ($57k/yr) (locally 938% of renters already pay >50% of income on rent) — very limited rent-growth headroom before tenants either downsize or default.
Forward outlook
- Local home prices are declining (-3.0%/yr); year-one equity from $3k of loan paydown is wiped out by about $12k of value loss. Plan a longer hold.
- Midland County population projected at +83% by 2050 — long-run rental-demand tailwind backs the buy-and-hold thesis.
Negotiation context
- It's been on market 29 days — a 2% lower offer ($394k) is reasonable based on typical stale-listing flexibility.
- 4 sale attempts since 8y ago with the ask held roughly flat each time — persistent listings suggest the price (not the market) is what's stuck; bring a comps-based counter.
Risks & watch-outs
- Watch-outs: built in 1948 — expect roof / HVAC / electrical / plumbing capex.
- Climate carrying-cost: extreme-heat days projected 7→22/yr by 2055 (HVAC capex compounding) — expect insurance premiums to compound above CPI over the hold.
Questions for the listing agent
- Can we see the unit-by-unit rent roll, current vacancy, and any below-market leases? What's the average tenancy length?
- What capital expenditures (roof, boiler, parking lot, exteriors) have been made in the last 5 years, and what's planned in the next 2?
- Built in 1948 — when were the roof, HVAC, electrical panel, plumbing, and water heater last replaced?
- Is there a deadline driving the sale (1031 exchange, divorce, estate, relocation)? That informs how much negotiation room exists.
- What's the average days-on-market for RENTAL listings here right now (not sales)? A rising rental-DOM trend means longer vacancies and softer asking-rent achievability than the comps imply.
- What's the recent tenant-quality profile in this submarket — average credit score on applications, eviction rate, late-payment / NSF rate, and stable-employment percentage? A property-management company in the area should have these aggregated.
- How much new apartment / multifamily construction is in the pipeline within 1–3 miles? Heavy new supply (>2% of stock underway) typically softens rents 12–24 months out; light construction supports rent growth.
Investment metrics
- 1% rule
- 1.10% ✓
- Cap rate
- 8.97%
- Cash-on-cash
- 9.57%
- DSCR
- 1.43
- GRM
- 7.6
CMA / ARV
No comps found within radius.
Projected returns pro-forma
-3.0% appreciation · 0.74% rent growth · sell at horizon
- IRR
- -4.3%
- Equity multiple
- 0.84×
- Total profit
- $-17,790
- Equity at exit
- $59,641
- IRR
- 2.6%
- Equity multiple
- 1.17×
- Total profit
- $19,098
- Equity at exit
- $34,585
Cash invested: $112,000 (down + closing). Projections, not guarantees.
Landlord ↔ Tenant lean methodology
- Overall (STATE)
- 87 Strongly Landlord-Friendly
- State Texas
- 87 Strongly Landlord-Friendly · R+5
- County
- — inherits STATE
- City
- — inherits STATE
ZIP-level market 79701
- Rents YoY
- 0.7%
- Active inventory
- 113
- Price-to-rent
- 30.2×
Monthly cashflow live
- Estimated rent
- $4,415 high interval (Pro) →
- Mortgage (P&I)
- −$2,098
- Tax from tax record
- −$330 /mo · $3,965/yr
- Insurance
- −$167
- HOA
- −$0
- Vacancy / Maint / Mgmt
- −$927
- Net cashflow
- $893
Break-even live
4-unit breakdown (identical units grouped — click to expand)
| Units | Beds | Baths | Est. rent |
|---|---|---|---|
| 4× units | 1 | 1 | $4,416 |
| #1 | 1 | 1 | $1,104 |
| #2 | 1 | 1 | $1,104 |
| #3 | 1 | 1 | $1,104 |
| #4 | 1 | 1 | $1,104 |
| Total (4 units) | $4,415 | ||
UW: 25.0% down · 7.5% · 30yr · 1.5% tax · 5.0% vac · 8.0% maint · 8.0% mgmt
Financing live
Cash to close
- Down payment
- $100,000
- Closing costs
- $12,000
- Reserves months
- —
- Total cash needed
- —
Loan-product check · same deal, 3 products live
Conventional
25% down · 7.5% · 30yr
- Down + closing
- —
- Monthly P&I
- —
- Monthly cashflow
- —
- DSCR
- —
- Eligible?
- —
Personal DTI + credit; lowest rate.
DSCR
20% down · 8.5% · 30yr
- Down + closing
- —
- Monthly P&I
- —
- Monthly cashflow
- —
- DSCR
- —
- Eligible?
- —
No personal income docs; deal must DSCR.
Hard money
10% down · 12.0% · 12mo
- Down + closing
- —
- Monthly P&I
- —
- Monthly cashflow
- —
- DSCR
- —
- Eligible?
- —
Short-term bridge; refi at stabilization.
Listing history 30 events
-
2026-06-19days on market $400,000 Active 29 DOM
-
2026-06-18days on market $400,000 Active 28 DOM
-
2026-06-17days on market $400,000 Active 27 DOM
-
2026-06-16days on market $400,000 Active 26 DOM
-
2026-06-15days on market $400,000 Active 25 DOM
-
2026-06-14days on market $400,000 Active 23 DOM
-
2026-06-13days on market $400,000 Active 22 DOM
-
2026-06-10days on market $400,000 Active 20 DOM
-
2026-06-09days on market $400,000 Active 19 DOM
-
2026-06-08days on market $400,000 Active 18 DOM
-
2026-06-07days on market $400,000 Active 17 DOM
-
2026-06-03days on market $400,000 Active 13 DOM
-
2026-06-02days on market $400,000 Active 12 DOM
-
2026-06-01days on market $400,000 Active 11 DOM
-
2026-05-31days on market $400,000 Active 10 DOM
-
2026-05-30days on market $400,000 Active 9 DOM
-
2026-05-19$400,000 Active
-
2026-05-01price $1,000
-
2026-04-03$1,050
-
2024-08-20soldstatus
-
2024-06-01historical $1,000
-
2024-05-16price $280,000
-
2024-04-24$1,000
-
2022-10-15price $289,900
-
2018-06-05soldstatus
-
2018-05-31soldstatus
-
2018-03-13$216,000
-
2014-03-05soldstatus
-
2008-01-24soldstatus
-
1990-02-08soldstatus
ⓘ Source: listings_history table (triggers on properties + properties_extension) + one-shot
backfill from property_details.listing_events for pre-trigger history.
Tax reassessment forecast TX · Resets to sale price
- Current annual tax
- $3,965 · $330/mo
- Projected year-2 tax
- $7,320 · $610/mo
- Expected delta
- +$3,355/yr (+$280/mo · 84.6%)
ⓘ Screening estimate from a state-policy table — verify with the county assessor before closing.
Climate risk First Street
- Flood 1/10 Low FEMA zone X · 0% chance over 30 yrs
- Wildfire 3/10 Moderate
- Heat 6/10 Major 7 d/yr ≥102°F today · 22 d/yr by 30 yrs out
- Wind 2/10 Low 3% chance of damaging wind over 30 yrs
- Air quality 1/10 Low 0 unhealthy d/yr today · 0 by 30 yrs out
Nearby sold comps map
Loading sold comps map…
Walkable amenities ~0.75 mi
Loading nearby amenities…
Taxation est. · year 1
- Rental income
- $52,980
- − Mortgage interest
- −$22,406
- − Property taxes
- −$3,965
- − Insurance
- −$2,000
- − Repairs & maintenance
- −$4,238
- − Management
- −$4,238
- − Depreciation
- −$11,636
- Taxable income
- $4,496
- Est. tax owed @ 24.0%
- −$1,079
- After-tax cash flow
- $9,638/yr
For passive investors: Depreciation is non-cash, so a rental often shows a tax loss while cash-flowing — sheltering income. Rental losses are passive: they offset passive income freely, and up to $25,000/yr can offset ordinary (W-2) income if you actively participate and your MAGI is under $100k (phasing out to $0 by $150k); unused losses carry forward. On sale, claimed depreciation is recaptured at up to 25%, and gains may owe capital-gains tax (a 1031 exchange can defer both). Figures are a year-1 estimate at your 24.0% rate — not tax advice; consult a CPA.
Schools (NCES district)
- District
- Midland ISD
- NCES district ID
- 4830570
- Math proficiency
- 34% ▼ -7.00%
- Reading proficiency
- 36% ▬ 0.00%
- Median HH income
- $63,457
- Composite
- 31.63/100
- National rank
- #5938
- State rank
- #477 of 826 in TX
Livability — Midland
- Score
- 79/100
- State rank
- #57
- US rank
- #2192
Category grades
Schools grade is shown separately in the Schools card above.
Census & demographics
- Census place
- Midland, TX
- County
- Midland County · 168,494 people
- City population
- 168,494
- Metro
- Midland, TX
- Population (ZIP)
- 27,131
- Household income
- $57,346
- Rent vs Own
- Severe rent burden
- 938.0
Population outlook (Midland County) Hauer SSP2
- Today (2025)
- 220,895 people
- By 2030
- 253,667 · +14.8%
- By 2040
- 325,498 · +47.4%
- By 2050
- 404,168 · +83.0%
- By 2075
- 609,802 · +176.1%
- By 2100
- 760,172 · +244.1%
Race, ethnicity, and origin ACS 2023
- Neighborhood character
- Diverse neighborhood (Simpson 0.55)
- Race & ethnicity
- Hispanic / Latino 61% Two or more races 28% White 27% Black 10%
- Hispanic origin (detail)
- Mexican 57%
- Common ancestry
- Lithuanian 1% Slovak 1% Ukrainian 1%
- Foreign-born
- 17% · Canada
- Languages at home
- 55% English-only · Spanish 44%
Political lean MEDSL · Midland
- 2024 margin
- Solid R (+60.5) · D 19.3% · R 79.8%
- 2008→2024 swing
- -3.3pp toward R · 2008: -57.3pp · 2024: -60.5pp
- All cycles
- 2024: R+60.5 2020: R+56.6 2016: R+55.2 2012: R+61.5 2008: R+57.3
Not yet ingested
- Civics
- —
Market trends
- HPI YoY
- ▼ -227.32%
- Current HPI
- 234.6111
- Rent YoY
- ▲ 0.74%
- Metro
- Midland, TX
- State GDP YoY
- ▲ 3.95%
- F500 in state
- 110
Industry mix (Fortune 500 HQ in TX)
| Industry | F500 HQs | Revenue |
|---|---|---|
| Energy | 16 | $1,198B |
|
||
| Technology | 5 | $198B |
|
||
| Engineering / Construction | 4 | $72B |
|
||
| Energy Services | 3 | $60B |
|
||
| Utilities | 3 | $41B |
|
||
| Healthcare | 2 | $330B |
|
||
Price history
+85.2% since first listed14 events — show timeline
- 2026-05-19 Listed $400,000 PBBOR
- 2026-05-01 Price Changed $1,000 PBBOR
- 2026-04-03 Listed for Rent $1,050 PBBOR
- 2024-08-20 Sold (Public Records) — Public Records
- 2024-06-01 Rental Removed $1,000 PBBOR
- 2024-05-16 Price Changed $280,000 PBBOR
- 2024-04-24 Listed for Rent $1,000 PBBOR
- 2022-10-15 Price Changed $289,900 ODMLS
- 2018-06-05 Sold (Public Records) — Public Records
- 2018-05-31 Sold (MLS) — ODMLS
- 2018-03-13 Listed $216,000 ODMLS
- 2014-03-05 Sold (Public Records) — Public Records
- 2008-01-24 Sold (Public Records) — Public Records
- 1990-02-08 Sold (Public Records) — Public Records
Property tax history
+7.7%/yrLatest (2025): $3,965 · -2.3% YoY. Source: county tax records.
Cash-flow waterfall
monthlySold comps — $/sqft
last 12 mo · ≤1 miLoading sold comps…