340 Buffalo Cir SE · Albuquerque, NM
Flood risk 1/10 · Minimal
- FEMA flood zone
- X (unshaded)
- Chance of flooding over 30 yrs
- 0.0%
- Est. flood insurance / yr
- $507 – $1,088
Fire risk 3/10 · Minor
- Est. fire insurance / yr
- $706 – $1,312
Heat risk 4/10 · Minor
- Hot days now (above 91°F)
- 3 days/yr
- Hot days in 30 yrs
- 8 days/yr
Wind risk 1/10 · Minimal
- Chance of severe wind over 30 yrs
- —
Air-quality risk 1/10 · Minimal
- Unhealthy air days now
- 0 days/yr
- Unhealthy air days in 30 yrs
- 0 days/yr
Risk factors via First Street. Map © Google.
Why this score? — see what drove the D grade
The composite is a weighted blend of 9 inputs, each scored 0–100. Each bar is that input's sub-score; the figure is the points it added to the 100-point composite (weight × sub-score).
- 1% rule +10.0/10.0
- Cash flow +7.5/30.0
- ARV discount +7.3/15.0
- Schools +5.3/10.0
- Condition / age +3.8/5.0
- Livability +3.6/5.0
- Rent growth +2.0/5.0
- DSCR +1.7/10.0
- Appreciation +0.0/10.0
$94,500
🖨 Deal sheet (PDF) 📄 Offer letter ✓ Due diligence
Listing remarks
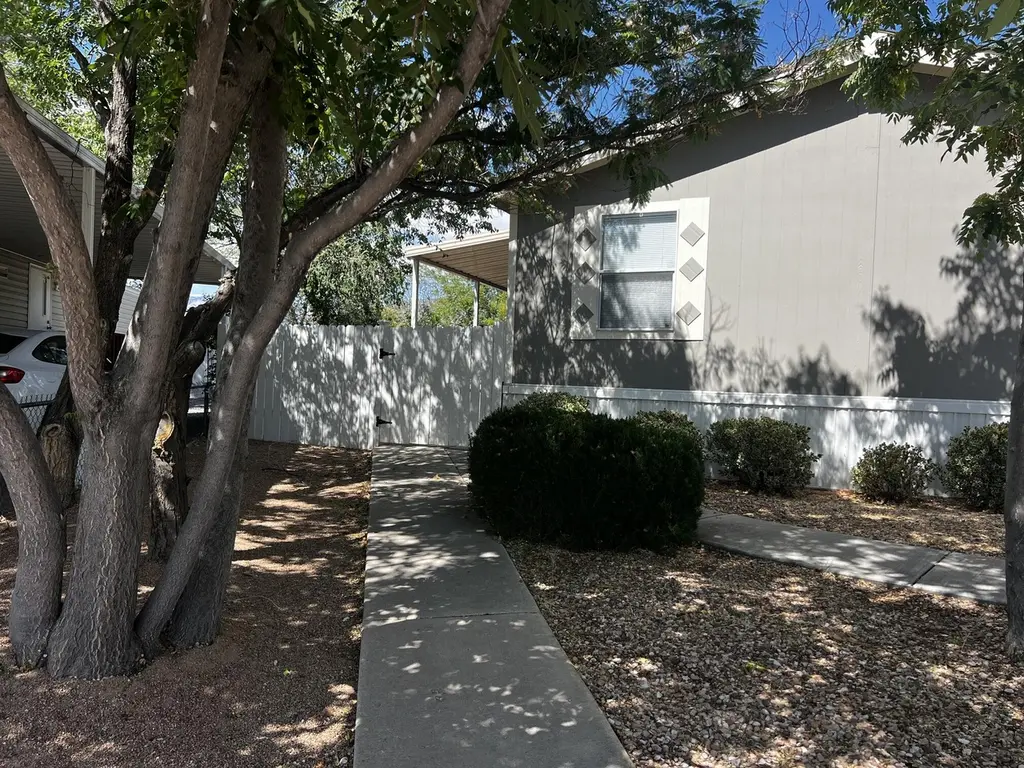
This is a very nice remodeled double wide in a All Ages Mobile Home Community close to I-40, Four Hills Mobile Home park. Lot rent is currently $779 a month, excluding utilities. This home is located on one the of largest lots in the community. Home boasts a large north facing covered 8X20 deck, large 3 car carport, Morgan storage shed, fruit trees, professional landscaped, back yard, mostly fenced and gated for your pets. The park offers 3 Swimming Pools, playgrounds, and community rooms.
Key facts
- 3 car carport
- Morgan storage shed
- Largest lots
Tags
Property features AI
Finance
- HOA & community: Part of Four Hills Mobile Home Park; Monthly association fee of $675; HOA includes clubhouse, common areas and pool(s)
Exterior
- Parking: Private road access (asphalt)
- Utilities: Electricity connected; Natural gas connected; Public water; Public sewer
- Home design: Single-story; Northwest facing; Resale; Double wide mobile home (Chapparal model, 40' x 28')
- Construction: Built by Clayon; Board and batten siding; Shingle roof
- Exterior features: Private entrance; Private yard; Covered patio; Patio; Shed(s), storage and workshop; Back yard fencing and wall; Sprinklers in rear; Landscaped; Corner lot; Planned unit development; Few trees; Community pool
Interior
- Kitchen: Dishwasher; Free-standing gas range; Disposal; Microwave; Refrigerator
- Bedrooms: Primary bedroom on main level
- Flooring: Carpet; Laminate; Vinyl
- Bathrooms: 2 full bathrooms
- Heating & cooling: Natural gas heating; Refrigerated (central) cooling
- Interior features: Ceiling fan(s); Dual sinks; Main level primary; Tub/shower; Walk-in closet(s); Double pane, insulated metal windows
- Laundry & utility: Electric dryer hookup
Neighborhood map
What this means for you Summary
Snapshot
- This is a 3-bed/2.0-bath manufactured listed at $94k. Condition is rated good.
Deal economics
- At list price, monthly cash flow is $-116 ($-1k/yr) — negative.
- To cash-flow at today's rent, offer at most $78k (17.7% below list).
- Meets the 1% rule at list price ($2k rent vs $94k).
- Recommended offer: $78k (17.7% below list) — sets the bar for cash-flow.
- Cap rate 4.8% vs local median 3.7% in Albuquerque — top-decile yield for the area; either an underpriced asset or a hidden risk that comps aren't pricing in. Stress-test before assuming the spread holds.
Location & tenants
- Location reads 72/100 on livability (#13 in NM) — a middle-class / working-renter tenant base. Strengths: amenities A+, commute A+, cost of living A+; Watch: schools D-, crime F.
- Albuquerque Public Schools (urban): math 51% / reading 75% proficiency, ranked #3 of 29 in NM (top 10%) — acceptable for families but not a draw, mixed tenant base, ~2y average lease; 60% free/reduced lunch — lower-income household profile, screen leases tightly.
- Market conditions: Rents soft (-2.1%/yr); 202 active listings in the ZIP; 40 comparable units currently listed for rent nearby; rentals at typical pace (median 25d on market — plan ~3-4 weeks tenant-placement turnaround); 1,316 units permitted in Bernalillo County in 2024 (546 in 5+ unit buildings).
Forward outlook
- Local home prices are declining (-3.0%/yr); year-one equity from $653 of loan paydown is wiped out by about $3k of value loss. Plan a longer hold.
Negotiation context
- Only 11 days on market — expect competitive offers; lowballing is unlikely to land.
Risks & watch-outs
- Watch-outs: HOA is 44% of rent.
Questions for the listing agent
- What do current leases actually rent for vs. the listed asking? Can we see a recent rent roll and the last 12 months of T-12 income?
- What does the HOA fee cover, when was the last increase, and are there any pending special assessments or reserve-fund shortfalls?
- Is there a deadline driving the sale (1031 exchange, divorce, estate, relocation)? That informs how much negotiation room exists.
- Schools are D-rated, which usually means shorter tenancies and higher turnover. Who's the typical renter profile here, and what's been the actual vacancy rate?
- Crime grade is F in this area — have there been break-ins, vandalism, or insurance claims at this property in the last 3 years? What carrier currently insures it and at what premium?
- The area grade is low — what's the realistic commute time and amenity access for the typical tenant pool here? Any planned neighborhood developments (good or bad) we should know about?
- What's the average days-on-market for RENTAL listings here right now (not sales)? A rising rental-DOM trend means longer vacancies and softer asking-rent achievability than the comps imply.
- What's the recent tenant-quality profile in this submarket — average credit score on applications, eviction rate, late-payment / NSF rate, and stable-employment percentage? A property-management company in the area should have these aggregated.
- How much new for-sale + rental construction is in the pipeline within 1–3 miles? Heavy new supply typically softens prices + rents 12–24 months out; constrained supply supports both.
Investment metrics
- 1% rule
- 1.62% ✓
- Cap rate
- 4.82%
- Cash-on-cash
- -5.24%
- DSCR
- 0.77
- GRM
- 5.1
CMA / ARV
- ARV (on-the-fly)
- $94,080
- Comps found
- 3
Show comp detail 3 sales within ~0.75 mi
| Address | Dist | Beds/Ba | Sqft | Sold | Price | $/sf | Match |
|---|---|---|---|---|---|---|---|
| 625 Fox Ln SE | 0.29mi | 2/2.0 (-1) | 1,066 (-5%) | 2mo | $90,000 | $84 | 72 |
| 612 Trading Post Trl SE | 0.27mi | 3/2.0 | 1,196 (+7%) | 7mo | $120,000 | $100 | 70 |
| 624 Trading Post Trl SE | 0.29mi | 3/2.0 | 1,280 (+14%) | 23mo | $84,900 | $66 | 44 |
Match score weights: distance 35% · size 25% · config 20% · recency 20%. Top-matched comps best support the ARV.
Projected returns pro-forma
-3.0% appreciation · 0.0% rent growth · sell at horizon
- IRR
- -32.6%
- Equity multiple
- -0.01×
- Total profit
- $-26,736
- Equity at exit
- $14,090
- IRR
- -96.8%
- Equity multiple
- -0.83×
- Total profit
- $-48,365
- Equity at exit
- $8,171
Cash invested: $26,460 (down + closing). Projections, not guarantees.
Landlord ↔ Tenant lean methodology
- Overall (STATE)
- 55 Moderately Landlord-Leaning
- State New Mexico
- 55 Moderately Landlord-Leaning · D+3
- County
- — inherits STATE
- City
- — inherits STATE
ZIP-level market 87123
- Rents YoY
- -2.1%
- Active inventory
- 202
- Price-to-rent
- 5.1×
Monthly cashflow live
- Estimated rent
- $1,535 high interval (Pro) →
- Mortgage (P&I)
- −$496
- Tax est. 1.5%
- −$118 /mo · $1,418/yr
- Insurance
- −$39
- HOA
- −$675
- Vacancy / Maint / Mgmt
- −$322
- Net cashflow
- $-116
Break-even live
Sensitivity live
| Price | -10% $-50 | -5% $-83 | +0% $-116 | +5% $-148 | +10% $-181 |
|---|---|---|---|---|---|
| Rent | -10% $-237 | -5% $-176 | +0% $-116 | +5% $-55 | +10% $6 |
| Rate | -1.0pp $-68 | -0.5pp $-92 | base $-116 | +0.5pp $-140 | +1.0pp $-165 |
UW: 25.0% down · 7.5% · 30yr · 1.5% tax · 5.0% vac · 8.0% maint · 8.0% mgmt
Financing live
Cash to close
- Down payment
- $23,625
- Closing costs
- $2,835
- Reserves months
- —
- Total cash needed
- —
Loan-product check · same deal, 3 products live
Conventional
25% down · 7.5% · 30yr
- Down + closing
- —
- Monthly P&I
- —
- Monthly cashflow
- —
- DSCR
- —
- Eligible?
- —
Personal DTI + credit; lowest rate.
DSCR
20% down · 8.5% · 30yr
- Down + closing
- —
- Monthly P&I
- —
- Monthly cashflow
- —
- DSCR
- —
- Eligible?
- —
No personal income docs; deal must DSCR.
Hard money
10% down · 12.0% · 12mo
- Down + closing
- —
- Monthly P&I
- —
- Monthly cashflow
- —
- DSCR
- —
- Eligible?
- —
Short-term bridge; refi at stabilization.
Rent comps 40 comps
| Address | Beds | Baths | Sqft | Rent | $/sqft | DOM | Units | Dist |
|---|---|---|---|---|---|---|---|---|
| 221 Hanosh Ct SE Albuquerque, NM | 2.0 | 1.0 | 700 | $800 | $1.14 | 44d | 1 | 0.14mi |
| 301 Western Skies Dr SE Albuquerque, NM | 1.0–3.0 | 1.0–2.0 | 806 | $1,511 | $1.87 | 4d | 17 | 0.19mi |
| 309 Whispering Sands Ct SE Unit 3 Albuquerque, NM | 2.0 | 1.0 | 825 | $1,200 | $1.45 | 24d | 1 | 0.34mi |
| 328 Via Vista St SE Albuquerque, NM | 3.0 | 2.0 | 1460 | $2,075 | $1.42 | 4d | 1 | 0.34mi |
| 200 Figueroa St NE Albuquerque, NM | 1.0–2.0 | 1.0 | 734 | $1,207 | $1.64 | 4d | 10 | 0.35mi |
| 12021 Skyline Rd NE Albuquerque, NM | 1.0–3.0 | 1.0–2.0 | 875 | $1,592 | $1.82 | 4d | 17 | 0.36mi |
| 408 Rainbow Ct SE Albuquerque, NM | 2.0 | 1.0 | 950 | $1,200 | $1.26 | 24d | 1 | 0.44mi |
| 405 Dorado Ct SE Albuquerque, NM | 2.0 | 1.0 | 800 | $1,000 | $1.25 | 45d | 1 | 0.44mi |
| 405 Dorado Ct SE Unit D Albuquerque, NM | 2.0 | 1.0 | 800 | $900 | $1.12 | 44d | 1 | 0.44mi |
| 221 Shirley St NE Albuquerque, NM | 3.0 | 1.5 | 1250 | $1,750 | $1.40 | 4d | 1 | 0.45mi |
| 11208 Deer Lodge Pl SE Albuquerque, NM | 3.0 | 2.0 | 1408 | $1,950 | $1.38 | 44d | 1 | 0.50mi |
| 12736 Singing Arrow Ave SE Unit C Albuquerque, NM | 2.0 | 1.0 | 800 | $950 | $1.19 | 24d | 1 | 0.51mi |
| 521 Nathan St SE Albuquerque, NM | 3.0 | 2.0 | 1060 | $1,895 | $1.79 | 20d | 1 | 0.56mi |
| 11104 Vistazo Pl SE Albuquerque, NM | 3.0 | 2.0 | 1353 | $1,950 | $1.44 | 24d | 1 | 0.56mi |
| 915 Tony Sanchez Dr SE Albuquerque, NM | 3.0 | 2.0 | 1180 | $2,295 | $1.94 | 4d | 1 | 0.68mi |
| 12004 Zia Rd NE Albuquerque, NM | 2.0–3.0 | 1.5–2.0 | 1323 | $2,145 | $1.62 | 4d | 7 | 0.70mi |
| 12032 Copper Ave NE Albuquerque, NM | 2.0 | 2.5 | 1090 | $1,900 | $1.74 | 4d | 1 | 0.77mi |
| 12008 Copper Ave NE Unit C Albuquerque, NM | 2.0 | 1.0 | 827 | $1,250 | $1.51 | 4d | 1 | 0.77mi |
| 517 Ida Pl NE Albuquerque, NM | 3.0 | 1.5 | 1058 | $2,000 | $1.89 | 22d | 1 | 0.77mi |
| 13150 Wenonah Ave SE Albuquerque, NM | 1.0–2.0 | 1.0–2.0 | 789 | $1,633 | $2.07 | 4d | 16 | 0.78mi |
| 628 Marquis Ct NE Albuquerque, NM | 2.0 | 2.0 | 1099 | $2,800 | $2.55 | 44d | 1 | 0.84mi |
| 12624 Copper Ave NE Apt 3 Albuquerque, NM | 2.0 | 2.0 | 900 | $995 | $1.11 | 44d | 1 | 0.84mi |
| 701 Stephen Moody St SE Albuquerque, NM | 1.0–2.0 | 1.0–2.0 | 814 | $1,715 | $2.11 | 4d | 10 | 0.98mi |
| 12412 Grand Ave NE Albuquerque, NM | 3.0 | 2.0 | 1022 | $1,850 | $1.81 | 45d | 1 | 1.00mi |
| 187 Vista Point Ct NE Albuquerque, NM | 2.0 | 1.5 | 1262 | $1,975 | $1.56 | 24d | 1 | 1.00mi |
| 12509 Nambe Ave NE Albuquerque, NM | 3.0 | 1.5 | 1272 | $1,800 | $1.42 | 24d | 1 | 1.03mi |
| 13412 Turquoise Ave NE Albuquerque, NM | 3.0 | 2.0 | 1425 | $1,900 | $1.33 | 24d | 1 | 1.04mi |
| 13615 Shaffer Ct SE Albuquerque, NM | 3.0 | 3.0 | 1341 | $2,700 | $2.01 | 4d | 1 | 1.07mi |
| 557 Tramway Blvd NE Albuquerque, NM | 1.0–3.0 | 1.0–2.0 | 891 | $1,405 | $1.58 | 4d | 9 | 1.08mi |
| 187 Monte Largo Dr NE Albuquerque, NM | 2.0 | 1.0 | 787 | $1,050 | $1.33 | 44d | 1 | 1.09mi |
| 187 Monte Largo Dr NE Apt 1 Albuquerque, NM | 2.0 | 1.0 | 787 | $1,050 | $1.33 | 24d | 1 | 1.09mi |
| 10404 Griffith Park Dr NE Albuquerque, NM | 3.0 | 2.0 | 1287 | $2,100 | $1.63 | 4d | 1 | 1.12mi |
| 717 Grace St NE Albuquerque, NM | 3.0 | 1.5 | 1040 | $1,875 | $1.80 | 24d | 1 | 1.21mi |
| 12201 Lomas Blvd NE Albuquerque, NM | 1.0–2.0 | 1.0 | 800 | $1,250 | $1.56 | 44d | 6 | 1.32mi |
| 12301 Lomas Blvd NE Albuquerque, NM | 1.0–2.0 | 1.0 | 756 | $1,325 | $1.75 | 15d | 9 | 1.33mi |
| 12601 Lomas Blvd NE Albuquerque, NM | 2.0 | 1.0 | 800 | $850 | $1.06 | 24d | 1 | 1.33mi |
| 12601 Lomas Blvd NE Albuquerque, NM | 1.0–2.0 | 1.0 | 750 | $850 | $1.13 | 4d | 2 | 1.33mi |
| 12621 Lomas Blvd NE Albuquerque, NM | 2.0 | 1.5 | 800 | $1,250 | $1.56 | 44d | 1 | 1.35mi |
| 12621 Lomas Blvd NE Albuquerque, NM | 2.0 | 1.5 | 800 | $1,115 | $1.39 | 4d | 1 | 1.35mi |
| 14124 Copper Ave NE Albuquerque, NM | 1.0–2.0 | 1.0 | 770 | $1,350 | $1.75 | 24d | 11 | 1.42mi |
HOA detail
- Monthly dues
- $675 · $8,100/yr
- Likely covers
- landscapingpoolsecurity
Listing history 9 events
-
2026-06-18days on market $94,500 Active 11 DOM
-
2026-06-17pricedays on market $94,500 Active 10 DOM
-
2026-06-16days on market $89,900 Active 9 DOM
-
2026-06-15days on market $89,900 Active 8 DOM
-
2026-06-13days on market $89,900 Active 6 DOM
-
2026-06-10days on market $89,900 Active 3 DOM
-
2026-06-09days on market $89,900 Active 2 DOM
-
2026-06-08remarks 495-char remark
-
2026-06-08$89,900 Active 1 DOM
ⓘ Source: listings_history table (triggers on properties + properties_extension) + one-shot
backfill from property_details.listing_events for pre-trigger history.
Climate risk First Street
- Flood 1/10 Low FEMA zone X (unshaded) · 0% chance over 30 yrs
- Wildfire 3/10 Moderate
- Heat 4/10 Moderate 3 d/yr ≥91°F today · 8 d/yr by 30 yrs out
- Wind 1/10 Low
- Air quality 1/10 Low 0 unhealthy d/yr today · 0 by 30 yrs out
Nearby sold comps map
Loading sold comps map…
Walkable amenities ~0.75 mi
Loading nearby amenities…
Taxation est. · year 1
- Rental income
- $18,417
- − Mortgage interest
- −$5,293
- − Property taxes
- −$1,418
- − Insurance
- −$472
- − Repairs & maintenance
- −$1,473
- − Management
- −$1,473
- − HOA
- −$8,100
- − Depreciation
- −$2,749
- Taxable loss
- −$2,562
- Est. tax savings @ 24.0%
- +$615
- After-tax cash flow
- $-772/yr
For passive investors: Depreciation is non-cash, so a rental often shows a tax loss while cash-flowing — sheltering income. Rental losses are passive: they offset passive income freely, and up to $25,000/yr can offset ordinary (W-2) income if you actively participate and your MAGI is under $100k (phasing out to $0 by $150k); unused losses carry forward. On sale, claimed depreciation is recaptured at up to 25%, and gains may owe capital-gains tax (a 1031 exchange can defer both). Figures are a year-1 estimate at your 24.0% rate — not tax advice; consult a CPA.
Condition & rehab AI · 13 photos
This remodeled double-wide manufactured home in a mobile home community is in good condition with minimal repairs needed. Painting and landscaping improvements can significantly enhance its value for both resale and rental.
Value-add opportunities
- Both Painting the exterior and interior walls — Fresh paint can significantly improve the curb appeal and interior aesthetics, enhancing both resale and rental value.
- Both Landscaping improvements — Enhancing the landscaping can improve the overall curb appeal and attract more potential buyers or renters.
Renovation cost estimate screening
Value-add ROI direction
- Both Painting the exterior and interior walls — Fresh paint can significantly improve the curb appeal and interior aesthetics, enhancing both resale and rental value. ↑
- Both Landscaping improvements — Enhancing the landscaping can improve the overall curb appeal and attract more potential buyers or renters. ↑
ⓘ Cost ranges are severity-bucket heuristics (US national rule-of-thumb). Get contractor quotes + a written scope before underwriting a rehab budget.
Schools (NCES district)
- District
- Albuquerque Public Schools
- NCES district ID
- 3500060
- Math proficiency
- 51% ▲ 30.00%
- Reading proficiency
- 75% ▲ 45.00%
- Median HH income
- $48,151
- Composite
- 53.29/100
- National rank
- #1487
- State rank
- #3 of 29 in NM
Livability — Albuquerque
- Score
- 72/100
- State rank
- #13
- US rank
- #6219
Category grades
Schools grade is shown separately in the Schools card above.
Census & demographics
- Census place
- Albuquerque, NM
- County
- Bernalillo County · 647,165 people
- City population
- 647,165
- Metro
- Albuquerque, NM
- Population (ZIP)
- 42,252
- Household income
- $64,359
- Rent vs Own
- Severe rent burden
- 1657.0
Population outlook (Bernalillo County) Hauer SSP2
- Today (2025)
- 704,528 people
- By 2030
- 711,723 · +1.0%
- By 2040
- 714,522 · +1.4%
- By 2050
- 709,274 · +0.7%
- By 2075
- 680,015 · -3.5%
- By 2100
- 619,879 · -12.0%
Race, ethnicity, and origin ACS 2023
- Neighborhood character
- Diverse neighborhood (Simpson 0.64)
- Race & ethnicity
- Hispanic / Latino 44% White 40% Two or more races 18% Native American 6% Asian 5% Black 2%
- Hispanic origin (detail)
- Mexican 28%
- Common ancestry
- Italian 2% Romanian 2% Lithuanian 1%
- Foreign-born
- 12% · Canada, Vietnam
- Languages at home
- 71% English-only · Spanish 22% Vietnamese 2%
Political lean MEDSL · Bernalillo
- 2024 margin
- Strong D (+21.0) · D 59.2% · R 38.2% · Other 2.6%
- 2008→2024 swing
- -0.3pp no change · 2008: 21.4pp · 2024: 21.0pp
- All cycles
- 2024: D+21.0 2020: D+24.4 2016: D+17.8 2012: D+16.2 2008: D+21.4
Not yet ingested
- Civics
- —
Market trends
- HPI YoY
- ▼ -231.76%
- Current HPI
- 233.3553
- Rent YoY
- ▼ -2.10%
- Metro
- Albuquerque, NM
- State GDP YoY
- —
- F500 in state
- 0
Price history
1 event — show timeline
- 2026-06-07 Listed $89,900 Southwest MLS
Cash-flow waterfall
monthlySold comps — $/sqft
last 12 mo · ≤1 miLoading sold comps…