 Multi-family
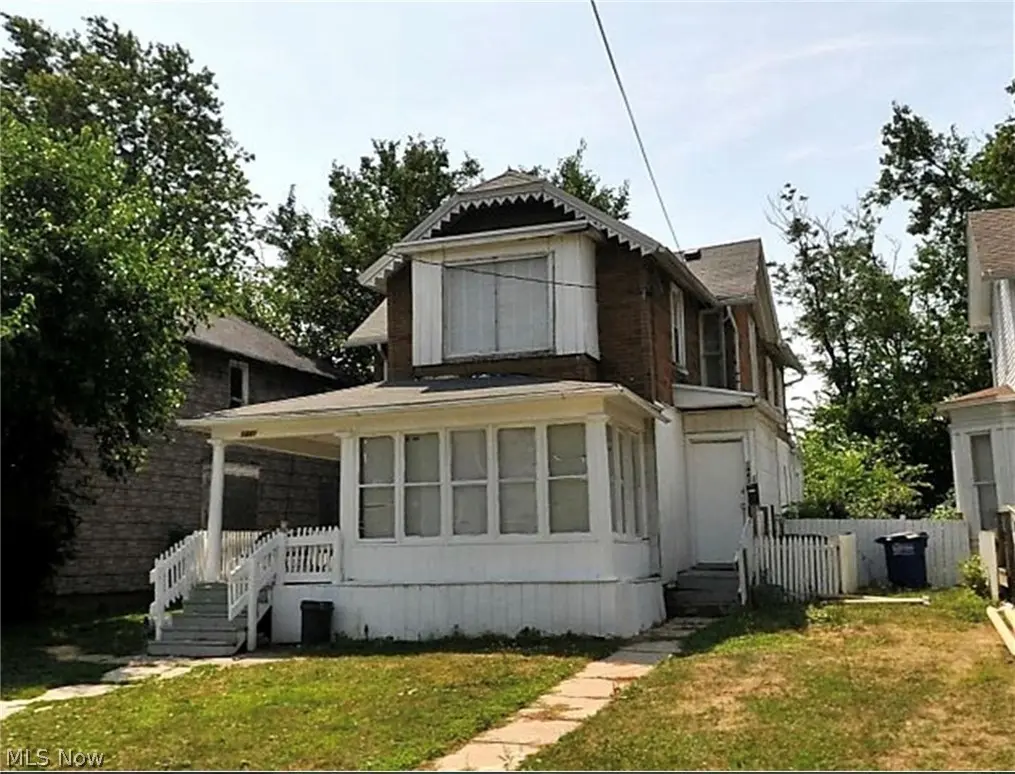
1441 Milburn Ave · Toledo, OH
Flood risk 3/10 · Minor
- FEMA flood zone
- X (unshaded)
- Chance of flooding over 30 yrs
- 0.1%
- Est. flood insurance / yr
- $507 – $1,088
Fire risk 1/10 · Minimal
- Est. fire insurance / yr
- $713 – $1,323
Heat risk 3/10 · Minor
- Hot days now (above 101°F)
- 7 days/yr
- Hot days in 30 yrs
- 16 days/yr
Wind risk 2/10 · Minimal
- Chance of severe wind over 30 yrs
- —
Air-quality risk 2/10 · Minimal
- Unhealthy air days now
- 1 days/yr
- Unhealthy air days in 30 yrs
- 3 days/yr
Risk factors via First Street. Map © Google.
Why this score? — see what drove the D grade
The composite is a weighted blend of 9 inputs, each scored 0–100. Each bar is that input's sub-score; the figure is the points it added to the 100-point composite (weight × sub-score).
- Cash flow +15.0/30.0
- ARV discount +7.5/15.0
- 1% rule +5.0/10.0
- DSCR +5.0/10.0
- Livability +3.3/5.0
- Rent growth +3.1/5.0
- Condition / age +2.5/5.0
- Schools +1.6/10.0
- Appreciation +0.0/10.0
$37,500
🖨 Deal sheet 📄 Offer letter ✓ Due diligence
Multi-family units
County records classify this as Multi-Family (2-4 Unit). Listing-text estimate: 1 unit. estimate disagrees with records
Listing remarks
Contractor's Special! Massive Equity Potential at 1441 Milburn Ave Calling all rehabbers, flippers, and visionaries! This grand 1880s multi-family home is waiting for its next chapter. Boasting 5 large bedrooms, 2 baths, and a spacious 2-story layout, this structure provides the perfect bones for a high-end duplex remodel. Whether you choose to renovate and cash-flow both units or execute a profitable flip, the numbers make sense here. Located in a convenient Toledo pocket (Auburndale) with quick access to Monroe St. , local amenities, and the University of Toledo. This property needs a full renovation and is a complete blank canvas ready for your custom finishes. Agent Remarks / Terms:
Key facts
- Full renovation
- 6,098 sq ft lot
- Parking
Tags
Property features AI
Finance
- Financial info: Annual tax amount listed (2025)
Exterior
- Parking: Driveway
- Utilities: Public water; Public sewer
- Home design: Two-story house; Lap siding exterior; Asphalt/fiberglass roof
- Construction: Lap siding construction; Asphalt/fiberglass roof
- Exterior features: Lot approximately 0.14 acres; Property listed as fixer
Interior
- Bedrooms: Two main-level bedrooms
- Bathrooms: Two full bathrooms total, one on the main level
- Heating & cooling: Forced air heating; Heating present
- Interior features: Full unfinished basement
Neighborhood map
What this means for you Summary
Snapshot
- This is a 5-bed/2.0-bath multifamily listed at $38k.
Deal economics
- At list price, monthly cash flow is $1k ($14k/yr) — positive.
- The deal already cash-flows at list — no discount required.
- Meets the 1% rule at list price ($2k rent vs $38k).
- Recommended offer: $37k (1.5% below list) — sets the bar for market timing.
- Cap rate 44.7% vs local median 7.6% in Toledo — top-decile yield for the area; either an underpriced asset or a hidden risk that comps aren't pricing in. Stress-test before assuming the spread holds.
Location & tenants
- Location reads 66/100 on livability (#645 in OH) — a middle-class / working-renter tenant base. Strengths: cost of living A+, housing A+, health & safety A+; Watch: amenities C-, schools D-, crime F.
- Toledo City (urban): math 15% / reading 24% proficiency, ranked #634 of 656 in OH (top 97%) — low school quality limits family demand, transient renter base, plan for 1-2y turnover; 72% free/reduced lunch — lower-income household profile, screen leases tightly.
- Market conditions: Rents rising (+2.3%/yr); 93 active listings in the ZIP; 2 comparable units currently listed for rent nearby; 415 units permitted in Lucas County in 2024 (122 in 5+ unit buildings).
- This rent runs 34% of the median local income ($67k/yr) — at the standard rent-burdened threshold; future hikes will face affordability resistance.
Forward outlook
- Local home prices are declining (-3.0%/yr); year-one equity from $259 of loan paydown is wiped out by about $1k of value loss. Plan a longer hold.
- Lucas County population projected at -16% by 2050 — secular population decline; favor cash flow + early exit over multi-decade hold.
- At projected returns (-3.0% appreciation + 2.3% rent growth), your $10k cash investment doubles in ~1 year — after that, you're playing with house money.
Negotiation context
- It's been on market 26 days — a 2% lower offer ($37k) is reasonable based on typical stale-listing flexibility.
- 4 sale attempts since 4y ago; this cycle's ask has dropped $2k (6%) from the opening price — seller is motivated, your offer sets the floor, not the list.
Risks & watch-outs
- Watch-outs: property tax is 3.0% of price; built in 1887 — expect roof / HVAC / electrical / plumbing capex.
Questions for the listing agent
- Built in 1887 — when were the roof, HVAC, electrical panel, plumbing, and water heater last replaced?
- Property tax is high relative to price — has the assessment been appealed recently, and will the sale trigger a re-assessment?
- Is there a deadline driving the sale (1031 exchange, divorce, estate, relocation)? That informs how much negotiation room exists.
- Schools are D-rated, which usually means shorter tenancies and higher turnover. Who's the typical renter profile here, and what's been the actual vacancy rate?
- Crime grade is F in this area — have there been break-ins, vandalism, or insurance claims at this property in the last 3 years? What carrier currently insures it and at what premium?
- The area grade is low — what's the realistic commute time and amenity access for the typical tenant pool here? Any planned neighborhood developments (good or bad) we should know about?
- What's the average days-on-market for RENTAL listings here right now (not sales)? A rising rental-DOM trend means longer vacancies and softer asking-rent achievability than the comps imply.
- What's the recent tenant-quality profile in this submarket — average credit score on applications, eviction rate, late-payment / NSF rate, and stable-employment percentage? A property-management company in the area should have these aggregated.
- How much new apartment / multifamily construction is in the pipeline within 1–3 miles? Heavy new supply (>2% of stock underway) typically softens rents 12–24 months out; light construction supports rent growth.
Investment metrics
- 1% rule
- 5.09% ✓
- Cap rate
- 44.69%
- Cash-on-cash
- 137.14%
- DSCR
- 7.10
- GRM
- 1.6
CMA / ARV
- ARV (on-the-fly)
- $88,656
- Comps found
- 3
Show comp detail 3 sales within ~0.75 mi
| Address | Dist | Beds/Ba | Sqft | Sold | Price | $/sf | Match |
|---|---|---|---|---|---|---|---|
| 1708 Cone St | 0.37mi | 4/2.0 (-1) | 1,772 (-4%) | 11mo | $100,000 | $56 | 62 |
| 1301 Goodale Ave | 0.36mi | 4/2.0 (-1) | 2,000 (+8%) | 16mo | $62,000 | $31 | 51 |
| 2434 Lawrence Ave | 0.67mi | 4/2.0 (-1) | 1,965 (+6%) | 6mo | $94,000 | $48 | 48 |
Match score weights: distance 35% · size 25% · config 20% · recency 20%. Top-matched comps best support the ARV.
Projected returns pro-forma
-3.0% appreciation · 2.29% rent growth · sell at horizon
- IRR
- —
- Equity multiple
- 7.58×
- Total profit
- $69,057
- Equity at exit
- $5,591
- IRR
- —
- Equity multiple
- 15.60×
- Total profit
- $153,311
- Equity at exit
- $3,242
Cash invested: $10,500 (down + closing). Projections, not guarantees.
Landlord ↔ Tenant lean methodology
- Overall (STATE)
- 73 Landlord-Friendly
- State Ohio
- 73 Landlord-Friendly · R+6
- County
- — inherits STATE
- City
- — inherits STATE
ZIP-level market 43606
- Home prices YoY
- -15.5%
- Rents YoY
- 2.3%
- Active inventory
- 93
- Price-to-rent
- 3.4×
Monthly cashflow live
- Estimated rent
- $1,907 high interval (Pro) →
- Mortgage (P&I)
- −$197
- Tax from tax record
- −$94 /mo · $1,131/yr
- Insurance
- −$16
- HOA
- −$0
- Vacancy / Maint / Mgmt
- −$400
- Net cashflow
- $1,200
Break-even live
2-unit breakdown (identical units grouped — click to expand)
| Units | Beds | Baths | Est. rent |
|---|---|---|---|
| 1× unit | 2 | 1 | $913 |
| 1× unit | 3 | 1 | $994 |
| Total (2 units) | $1,907 | ||
UW: 25.0% down · 7.5% · 30yr · 1.5% tax · 5.0% vac · 8.0% maint · 8.0% mgmt
Financing live
Cash to close
- Down payment
- $9,375
- Closing costs
- $1,125
- Reserves months
- —
- Total cash needed
- —
Loan-product check · same deal, 3 products live
Conventional
25% down · 7.5% · 30yr
- Down + closing
- —
- Monthly P&I
- —
- Monthly cashflow
- —
- DSCR
- —
- Eligible?
- —
Personal DTI + credit; lowest rate.
DSCR
20% down · 8.5% · 30yr
- Down + closing
- —
- Monthly P&I
- —
- Monthly cashflow
- —
- DSCR
- —
- Eligible?
- —
No personal income docs; deal must DSCR.
Hard money
10% down · 12.0% · 12mo
- Down + closing
- —
- Monthly P&I
- —
- Monthly cashflow
- —
- DSCR
- —
- Eligible?
- —
Short-term bridge; refi at stabilization.
Rent comps 2 comps
| Address | Beds | Baths | Sqft | Rent | $/sqft | DOM | Units | Dist |
|---|---|---|---|---|---|---|---|---|
| 1420 Addington Rd Toledo, OH | 5.0 | 1.5 | 1728 | $1,500 | $0.87 | 43d | 1 | 1.12mi |
| 3606 Revere Dr Toledo, OH | 4.0 | 1.0 | 1320 | $1,500 | $1.14 | 43d | 1 | 1.41mi |
Listing history 21 events
-
2026-06-17days on market $37,500 Active 26 DOM
-
2026-06-16days on market $37,500 Active 25 DOM
-
2026-06-15days on market $37,500 Active 24 DOM
-
2026-06-14days on market $37,500 Active 22 DOM
-
2026-06-10days on market $37,500 Active 19 DOM
-
2026-06-09days on market $37,500 Active 18 DOM
-
2026-06-08days on market $37,500 Active 17 DOM
-
2026-06-07days on market $37,500 Active 16 DOM
-
2026-06-05days on market $37,500 Active 13 DOM
-
2026-06-03days on market $37,500 Active 12 DOM
-
2026-06-02pricedays on market $37,500 Active 11 DOM
-
2026-06-01days on market $39,999 Active 10 DOM
-
2026-05-31days on market $39,999 Active 9 DOM
-
2026-05-30days on market $39,999 Active 8 DOM
-
2026-05-22$39,999 Active
-
2022-09-12historical
-
2022-07-27status Active
-
2022-06-21status Pending
-
2022-05-31status Active
-
2022-04-15status Pending
-
2022-03-22$20,000 Active
ⓘ Source: listings_history table (triggers on properties + properties_extension) + one-shot
backfill from property_details.listing_events for pre-trigger history.
Tax reassessment forecast OH · Partial reset (capped growth)
- Current annual tax
- $1,131 · $94/mo
- Projected year-2 tax
- $1,131 · $94/mo
- Expected delta
- $0/yr ($0/mo · 0.0%)
ⓘ Screening estimate from a state-policy table — verify with the county assessor before closing.
Climate risk First Street
- Flood 3/10 Moderate FEMA zone X (unshaded) · 10% chance over 30 yrs
- Wildfire 1/10 Low
- Heat 3/10 Moderate 7 d/yr ≥101°F today · 16 d/yr by 30 yrs out
- Wind 2/10 Low
- Air quality 2/10 Low 1 unhealthy d/yr today · 3 by 30 yrs out
Nearby sold comps map
Loading sold comps map…
Walkable amenities ~0.75 mi
Loading nearby amenities…
Taxation est. · year 1
- Rental income
- $22,884
- − Mortgage interest
- −$2,101
- − Property taxes
- −$1,131
- − Insurance
- −$188
- − Repairs & maintenance
- −$1,831
- − Management
- −$1,831
- − Depreciation
- −$1,091
- Taxable income
- $14,713
- Est. tax owed @ 24.0%
- −$3,531
- After-tax cash flow
- $10,869/yr
For passive investors: Depreciation is non-cash, so a rental often shows a tax loss while cash-flowing — sheltering income. Rental losses are passive: they offset passive income freely, and up to $25,000/yr can offset ordinary (W-2) income if you actively participate and your MAGI is under $100k (phasing out to $0 by $150k); unused losses carry forward. On sale, claimed depreciation is recaptured at up to 25%, and gains may owe capital-gains tax (a 1031 exchange can defer both). Figures are a year-1 estimate at your 24.0% rate — not tax advice; consult a CPA.
Schools (NCES district)
- District
- Toledo City
- NCES district ID
- 3904490
- Math proficiency
- 15% ▼ -16.00%
- Reading proficiency
- 24% ▼ -13.00%
- Median HH income
- $32,137
- Composite
- 15.76/100
- National rank
- #9276
- State rank
- #634 of 656 in OH
Livability — Toledo
- Score
- 66/100
- State rank
- #645
- US rank
- #11442
Category grades
Schools grade is shown separately in the Schools card above.
Census & demographics
- Census place
- Toledo, OH
- County
- Lucas County · 380,724 people
- City population
- 280,811
- Metro
- Toledo, OH
- Population (ZIP)
- 24,898
- Household income
- $66,917
- Rent vs Own
- Severe rent burden
- 843.0
Population outlook (Lucas County) Hauer SSP2
- Today (2025)
- 420,751 people
- By 2030
- 410,187 · -2.5%
- By 2040
- 384,019 · -8.7%
- By 2050
- 355,125 · -15.6%
- By 2075
- 291,683 · -30.7%
- By 2100
- 233,670 · -44.5%
Race, ethnicity, and origin ACS 2023
- Neighborhood character
- Diverse neighborhood (Simpson 0.57)
- Race & ethnicity
- White 59% Black 29% Two or more races 7% Hispanic / Latino 4% Asian 3%
- Common ancestry
- Romanian 6% Italian 2% Lithuanian 1%
- Foreign-born
- 7% · Canada, China, South Korea
- Languages at home
- 92% English-only · Arabic 2% Other Indo-European 2% Spanish 1%
Political lean MEDSL · Lucas
- 2024 margin
- D (+12.6) · D 55.8% · R 43.2%
- 2008→2024 swing
- -18.9pp toward R · 2008: 31.4pp · 2024: 12.6pp
- All cycles
- 2024: D+12.6 2020: D+16.8 2016: D+17.4 2012: D+30.4 2008: D+31.4
Not yet ingested
- Civics
- —
Market trends
- HPI YoY
- ▼ -41.19%
- Current HPI
- 224.695
- Rent YoY
- ▲ 2.29%
- Metro
- Toledo, OH
- State GDP YoY
- ▲ 1.98%
- F500 in state
- 48
Industry mix (Fortune 500 HQ in OH)
| Industry | F500 HQs | Revenue |
|---|---|---|
| Insurance | 3 | $145B |
|
||
| Industrial Machinery | 3 | $49B |
|
||
| Financial Services | 3 | $24B |
|
||
| Consumer Goods | 2 | $93B |
|
||
| Aerospace / Defense | 2 | $47B |
|
||
| Utilities | 2 | $33B |
|
||
Price history
+100.0% since first listed7 events — show timeline
- 2026-05-22 Listed $39,999 MLSNOW
- 2022-09-12 Listing Removed — NORIS
- 2022-07-27 Relisted — NORIS
- 2022-06-21 Pending — NORIS
- 2022-05-31 Relisted — NORIS
- 2022-04-15 Pending — NORIS
- 2022-03-22 Listed $20,000 NORIS
Property tax history
+2.6%/yrLatest (2025): $1,131 · +2.7% YoY. Source: county tax records.
Cash-flow waterfall
monthlySold comps — $/sqft
last 12 mo · ≤1 miLoading sold comps…