 Multi-family
2 Hamlin Ave · Bennington, VT
Flood risk 9/10 · Severe
- FEMA flood zone
- X (unshaded)
- Chance of flooding over 30 yrs
- 0.99%
- Est. flood insurance / yr
- $507 – $1,088
Fire risk 1/10 · Minimal
- Est. fire insurance / yr
- $480 – $892
Heat risk 2/10 · Minimal
- Hot days now (above 92°F)
- 7 days/yr
- Hot days in 30 yrs
- 16 days/yr
Wind risk 3/10 · Minor
- Chance of severe wind over 30 yrs
- 7.0%
Air-quality risk 2/10 · Minimal
- Unhealthy air days now
- 0 days/yr
- Unhealthy air days in 30 yrs
- 1 days/yr
Risk factors via First Street. Map © Google.
Why this score? — see what drove the B+ grade
The composite is a weighted blend of 9 inputs, each scored 0–100. Each bar is that input's sub-score; the figure is the points it added to the 100-point composite (weight × sub-score).
- Cash flow +30.0/30.0
- ARV discount +15.0/15.0
- 1% rule +10.0/10.0
- DSCR +10.0/10.0
- Schools +5.0/10.0
- Livability +3.2/5.0
- Rent growth +2.5/5.0
- Condition / age +2.5/5.0
- Appreciation +0.0/10.0
$199,900
🖨 Deal sheet (PDF) 📄 Offer letter ✓ Due diligence
Multi-family units
County records classify this as Multi-Family (2-4 Unit). Listing-text estimate: 1 unit. estimate disagrees with records
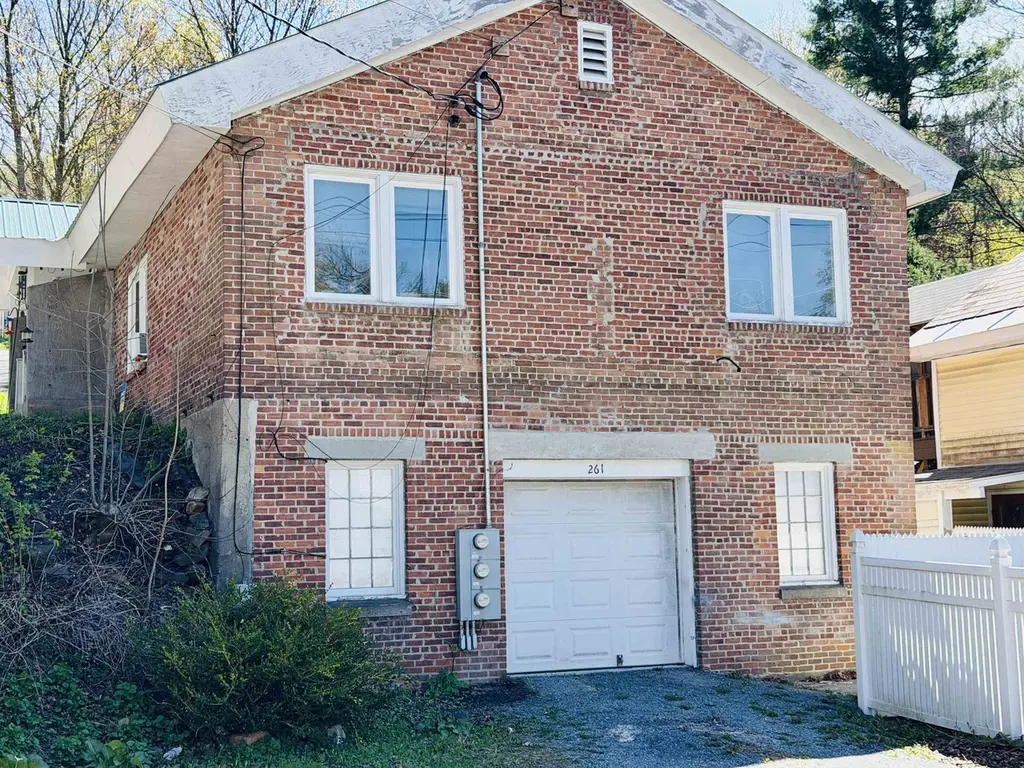
Listing remarks
2-Unit Multi-Family with Professional-Grade Workshop! Versatile property with high-yield setup, perfect for a contractor, carpenter, or owner-occupant. The standout feature is a professional-grade workshop fully optimized for year-round productivity with radiant heat, bright lighting, and the added convenience of an existing sink and toilet. Whether utilized for a trade, automotive enthusiast, or premium climate-controlled storage rental, this workspace provides an incredible environment for any business or hobby. Located directly above the shop are two freshly painted 1BR/1BA apartments with a remarkable decade-long track record of consistent tenancy. The property currently generates a ste
Key facts
- 6,098 sq ft lot
- 2 garage spots
- Built 1920
Property features AI
Finance
- Financial info: Two-unit property with month-to-month leases; Total units: 2
Exterior
- Parking: 2-car garage
- Utilities: Public water; Public sewer; On-site electric; Cable available on site; High-speed internet available on site
- Home design: Multi-family building; Existing construction; Built in 1920
- Construction: Wood frame construction with brick exterior; Metal roof; Foundation information not provided
- Exterior features: City lot on a corner parcel; Sloping lot; Crushed stone driveway; Paved public road frontage; Located at corner of Union and Hamlin
Interior
- Kitchen: Electric cooktop; Dishwasher; Microwave; Refrigerator
- Bedrooms: Unit 1: 2 bedrooms (level 1); Unit 2: 1 bedroom (level 1)
- Flooring: Tile flooring
- Bathrooms: Two full bathrooms total (one per unit)
- Heating & cooling: Propane heating; Radiant floor heat; No central cooling
- Interior features: Walkout basement; Heat included in some units; Kitchen island in each unit
- Laundry & utility: Laundry hookups in each unit; Electric water heater
Neighborhood map
What this means for you Summary
Snapshot
- This is a 2-bed/2.0-bath multifamily listed at $200k.
Deal economics
- At list price, monthly cash flow is $1k ($12k/yr) — positive.
- The deal already cash-flows at list — no discount required.
- Meets the 1% rule at list price ($3k rent vs $200k).
- Recommended offer: $194k (3.0% below list) — sets the bar for market timing.
- Cap rate 12.9% vs local median 5.0% in Bennington — top-decile yield for the area; either an underpriced asset or a hidden risk that comps aren't pricing in. Stress-test before assuming the spread holds.
Location & tenants
- Location reads 64/100 on livability (#63 in VT) — a middle-class / working-renter tenant base. Strengths: housing A+, health & safety A+, cost of living A; Watch: employment C-, crime D, schools F.
- Market conditions: 66 active listings in the ZIP; 1 comparable units currently listed for rent nearby; 59 units permitted in Bennington County in 2024 (0 in 5+ unit buildings).
- At $3,086/mo this rent would consume 62% of the median local household income ($60k/yr) (locally 982% of renters already pay >50% of income on rent) — very limited rent-growth headroom before tenants either downsize or default.
Forward outlook
- Local home prices are declining (-3.0%/yr); year-one equity from $1k of loan paydown is wiped out by about $6k of value loss. Plan a longer hold.
- Bennington County population projected at -23% by 2050 — secular population decline; favor cash flow + early exit over multi-decade hold.
- At projected returns (-3.0% appreciation + 3.0% rent growth), your $56k cash investment doubles in ~6 years — after that, you're playing with house money.
Negotiation context
- It's been on market 54 days — a 3% lower offer ($194k) is reasonable based on typical stale-listing flexibility.
Risks & watch-outs
- Watch-outs: flood insurance adds $66/mo; built in 1920 — expect roof / HVAC / electrical / plumbing capex.
- Climate carrying-cost: severe flood risk — expect insurance premiums to compound above CPI over the hold.
Questions for the listing agent
- It's been on market 54 days. Have you received any prior offers? Is the seller open to a 3% concession, seller financing, or rate buy-down credit?
- Built in 1920 — when were the roof, HVAC, electrical panel, plumbing, and water heater last replaced?
- What's the actual annual flood-insurance premium (NFIP or private), and is the property in a SFHA with mandatory coverage?
- Is there a deadline driving the sale (1031 exchange, divorce, estate, relocation)? That informs how much negotiation room exists.
- Schools are F-rated, which usually means shorter tenancies and higher turnover. Who's the typical renter profile here, and what's been the actual vacancy rate?
- Crime grade is D in this area — have there been break-ins, vandalism, or insurance claims at this property in the last 3 years? What carrier currently insures it and at what premium?
- What's the average days-on-market for RENTAL listings here right now (not sales)? A rising rental-DOM trend means longer vacancies and softer asking-rent achievability than the comps imply.
- What's the recent tenant-quality profile in this submarket — average credit score on applications, eviction rate, late-payment / NSF rate, and stable-employment percentage? A property-management company in the area should have these aggregated.
- How much new apartment / multifamily construction is in the pipeline within 1–3 miles? Heavy new supply (>2% of stock underway) typically softens rents 12–24 months out; light construction supports rent growth.
Investment metrics
- 1% rule
- 1.54% ✓
- Cap rate
- 12.91%
- Cash-on-cash
- 23.63%
- DSCR
- 2.05
- GRM
- 5.4
CMA / ARV
- ARV (on-the-fly)
- $280,440
- Comps found
- 2
Show comp detail 2 sales within ~0.75 mi
| Address | Dist | Beds/Ba | Sqft | Sold | Price | $/sf | Match |
|---|---|---|---|---|---|---|---|
| 400 South St | 0.41mi | 3/3.0 (+1) | 1,461 (-1%) | 11mo | $278,000 | $190 | 61 |
| 315 County St | 0.62mi | 3/2.0 (+1) | 1,286 (-13%) | 22mo | $80,000 | $62 | 26 |
Match score weights: distance 35% · size 25% · config 20% · recency 20%. Top-matched comps best support the ARV.
Projected returns pro-forma
-3.0% appreciation · 3.0% rent growth · sell at horizon
- IRR
- 15.0%
- Equity multiple
- 1.60×
- Total profit
- $33,637
- Equity at exit
- $29,806
- IRR
- 23.7%
- Equity multiple
- 3.05×
- Total profit
- $114,478
- Equity at exit
- $17,284
Cash invested: $55,972 (down + closing). Projections, not guarantees.
Landlord ↔ Tenant lean methodology
- Overall (STATE)
- 41 Moderately Tenant-Leaning
- State Vermont
- 41 Moderately Tenant-Leaning · D+15
- County
- — inherits STATE
- City
- — inherits STATE
ZIP-level market 05201
- Home prices YoY
- -19.3%
- Active inventory
- 66
- Price-to-rent
- 10.8×
Monthly cashflow live
- Estimated rent
- $3,086 medium interval (Pro) →
- Mortgage (P&I)
- −$1,048
- Tax from tax record
- −$204 /mo · $2,449/yr
- Insurance
- −$83
- Flood insurance flood zone
- −$66 /mo · $798/yr
- HOA
- −$0
- Vacancy / Maint / Mgmt
- −$648
- Net cashflow
- $1,036
Break-even live
Sensitivity live
| Price | -10% $1,149 | -5% $1,092 | +0% $1,036 | +5% $979 | +10% $923 |
|---|---|---|---|---|---|
| Rent | -10% $792 | -5% $914 | +0% $1,036 | +5% $1,158 | +10% $1,280 |
| Rate | -1.0pp $1,136 | -0.5pp $1,087 | base $1,036 | +0.5pp $984 | +1.0pp $931 |
2-unit breakdown (identical units grouped — click to expand)
| Units | Beds | Baths | Est. rent |
|---|---|---|---|
| 2× units | 1.0 | 1 | $3,086 |
| #1 | 1.0 | 1 | $1,543 |
| #2 | 1.0 | 1 | $1,543 |
| Total (2 units) | $3,086 | ||
UW: 25.0% down · 7.5% · 30yr · 1.5% tax · 5.0% vac · 8.0% maint · 8.0% mgmt
Financing live
Cash to close
- Down payment
- $49,975
- Closing costs
- $5,997
- Reserves months
- —
- Total cash needed
- —
Loan-product check · same deal, 3 products live
Conventional
25% down · 7.5% · 30yr
- Down + closing
- —
- Monthly P&I
- —
- Monthly cashflow
- —
- DSCR
- —
- Eligible?
- —
Personal DTI + credit; lowest rate.
DSCR
20% down · 8.5% · 30yr
- Down + closing
- —
- Monthly P&I
- —
- Monthly cashflow
- —
- DSCR
- —
- Eligible?
- —
No personal income docs; deal must DSCR.
Hard money
10% down · 12.0% · 12mo
- Down + closing
- —
- Monthly P&I
- —
- Monthly cashflow
- —
- DSCR
- —
- Eligible?
- —
Short-term bridge; refi at stabilization.
Rent comps 1 comps
| Address | Beds | Baths | Sqft | Rent | $/sqft | DOM | Units | Dist |
|---|---|---|---|---|---|---|---|---|
| 34 West Rd Bennington, VT | 2.0 | 1.0 | 1590 | $2,100 | $1.32 | 20d | 1 | 1.46mi |
Listing history 18 events
-
2026-06-21days on market $199,900 Active 54 DOM
-
2026-06-19days on market $199,900 Active 52 DOM
-
2026-06-18days on market $199,900 Active 51 DOM
-
2026-06-17days on market $199,900 Active 50 DOM
-
2026-06-16days on market $199,900 Active 49 DOM
-
2026-06-15days on market $199,900 Active 48 DOM
-
2026-06-14days on market $199,900 Active 46 DOM
-
2026-06-12days on market $199,900 Active 45 DOM
-
2026-06-09days on market $199,900 Active 42 DOM
-
2026-06-08days on market $199,900 Active 41 DOM
-
2026-06-07days on market $199,900 Active 40 DOM
-
2026-06-07days on market $199,900 Active 39 DOM
-
2026-06-04days on market $199,900 Active 36 DOM
-
2026-06-02days on market $199,900 Active 35 DOM
-
2026-06-01days on market $199,900 Active 34 DOM
-
2026-05-31days on market $199,900 Active 33 DOM
-
2026-05-31days on market $199,900 Active 32 DOM
-
2026-04-24$199,900 Active
ⓘ Source: listings_history table (triggers on properties + properties_extension) + one-shot
backfill from property_details.listing_events for pre-trigger history.
Tax reassessment forecast VT · Partial reset (capped growth)
- Current annual tax
- $2,449 · $204/mo
- Projected year-2 tax
- $3,124 · $260/mo
- Expected delta
- +$674/yr (+$56/mo · 27.5%)
ⓘ Screening estimate from a state-policy table — verify with the county assessor before closing.
Climate risk First Street
- Flood 9/10 Extreme FEMA zone X (unshaded) · 99% chance over 30 yrs
- Wildfire 1/10 Low
- Heat 2/10 Low 7 d/yr ≥92°F today · 16 d/yr by 30 yrs out
- Wind 3/10 Moderate 7% chance of damaging wind over 30 yrs
- Air quality 2/10 Low 0 unhealthy d/yr today · 1 by 30 yrs out
Nearby sold comps map
Loading sold comps map…
Walkable amenities ~0.75 mi
Loading nearby amenities…
Taxation est. · year 1
- Rental income
- $37,032
- − Mortgage interest
- −$11,198
- − Property taxes
- −$2,449
- − Insurance
- −$1,797
- − Repairs & maintenance
- −$2,963
- − Management
- −$2,963
- − Depreciation
- −$5,815
- Taxable income
- $9,848
- Est. tax owed @ 24.0%
- −$2,363
- After-tax cash flow
- $10,066/yr
For passive investors: Depreciation is non-cash, so a rental often shows a tax loss while cash-flowing — sheltering income. Rental losses are passive: they offset passive income freely, and up to $25,000/yr can offset ordinary (W-2) income if you actively participate and your MAGI is under $100k (phasing out to $0 by $150k); unused losses carry forward. On sale, claimed depreciation is recaptured at up to 25%, and gains may owe capital-gains tax (a 1031 exchange can defer both). Figures are a year-1 estimate at your 24.0% rate — not tax advice; consult a CPA.
Schools (NCES district)
No district data.
Livability — Bennington
- Score
- 64/100
- State rank
- #63
- US rank
- #14446
Category grades
Schools grade is shown separately in the Schools card above.
Census & demographics
- Census place
- Bennington, VT
- County
- Bennington County · 14,998 people
- City population
- 14,998
- Metro
- Bennington, VT
- Population (ZIP)
- 14,998
- Household income
- $59,798
- Rent vs Own
- Severe rent burden
- 982.0
Population outlook (Bennington County) Hauer SSP2
- Today (2025)
- 34,407 people
- By 2030
- 32,975 · -4.2%
- By 2040
- 29,711 · -13.6%
- By 2050
- 26,638 · -22.6%
- By 2075
- 21,318 · -38.0%
- By 2100
- 16,086 · -53.2%
Race, ethnicity, and origin ACS 2023
- Neighborhood character
- Predominantly White (92%)
- Race & ethnicity
- White 92% Two or more races 4% Hispanic / Latino 3%
- Common ancestry
- Lithuanian 10% Slovak 7% Romanian 3%
- Foreign-born
- 2% · Canada
- Languages at home
- 96% English-only · Spanish 2% Other Indo-European 1%
Political lean MEDSL · Bennington
- 2024 margin
- Strong D (+22.5) · D 60.0% · R 37.5% · Other 2.6%
- 2008→2024 swing
- -10.9pp toward R · 2008: 33.4pp · 2024: 22.5pp
- All cycles
- 2024: D+22.5 2020: D+27.3 2016: D+22.1 2012: D+33.3 2008: D+33.4
Not yet ingested
- Civics
- —
Market trends
- HPI YoY
- ▼ -60.78%
- Current HPI
- 254.5149
- Rent YoY
- —
- Metro
- Bennington, VT
- State GDP YoY
- —
- F500 in state
- 0
Price history
1 event — show timeline
- 2026-04-24 Listed $199,900 PrimeMLS
Property tax history
-2.7%/yrLatest (2024): $2,449 · +9.6% YoY. Source: county tax records.
Cash-flow waterfall
monthlySold comps — $/sqft
last 12 mo · ≤1 miLoading sold comps…