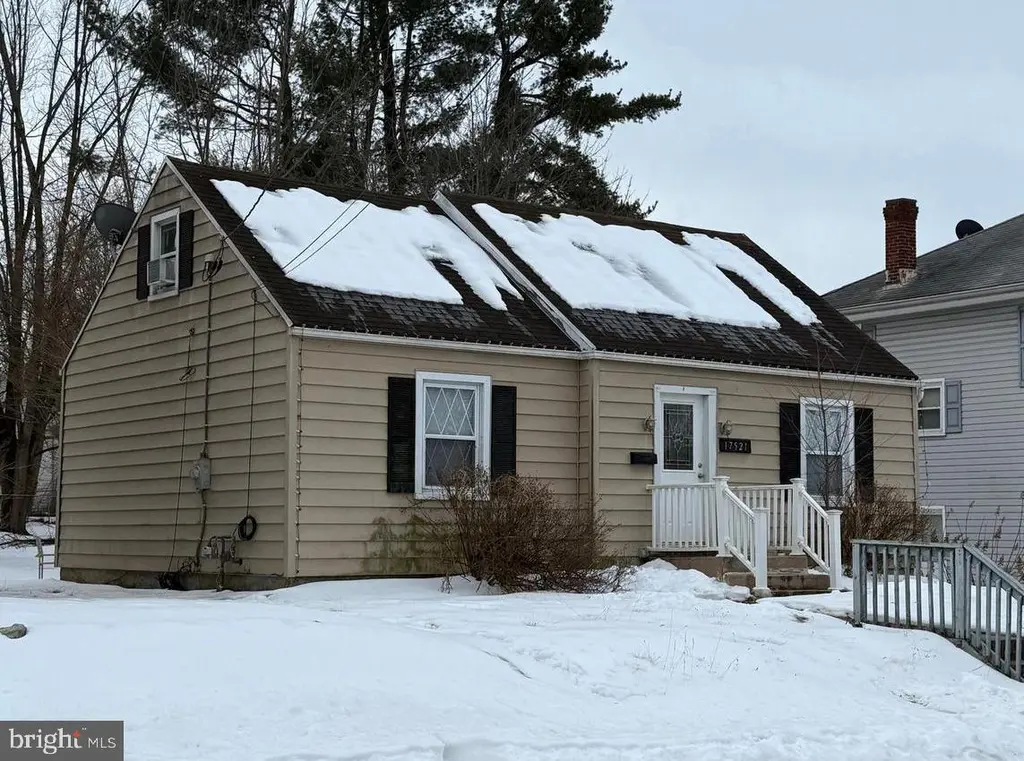
17521 Lexington Ave · Halfway, MD
Flood risk 1/10 · Minimal
- FEMA flood zone
- X (unshaded)
- Chance of flooding over 30 yrs
- 0.0%
- Est. flood insurance / yr
- $473 – $860
Fire risk 1/10 · Minimal
- Est. fire insurance / yr
- $755 – $1,403
Heat risk 5/10 · Moderate
- Hot days now (above 101°F)
- 7 days/yr
- Hot days in 30 yrs
- 16 days/yr
Wind risk 2/10 · Minimal
- Chance of severe wind over 30 yrs
- 2.0%
Air-quality risk 3/10 · Minor
- Unhealthy air days now
- 2 days/yr
- Unhealthy air days in 30 yrs
- 4 days/yr
Risk factors via First Street. Map © Google.
Why this score? — see what drove the D grade
The composite is a weighted blend of 9 inputs, each scored 0–100. Each bar is that input's sub-score; the figure is the points it added to the 100-point composite (weight × sub-score).
- ARV discount +11.9/15.0
- Cash flow +11.7/30.0
- DSCR +3.5/10.0
- Rent growth +3.5/5.0
- Livability +3.3/5.0
- 1% rule +2.8/10.0
- Condition / age +2.5/5.0
- Schools +2.3/10.0
- Appreciation +0.0/10.0
$250,000
🖨 Deal sheet 📄 Offer letter ✓ Due diligence
Listing remarks MLS
A 4-bedroom, 1-bath single-family home is currently rented and ready for a new investor to purchase and add to their portfolio. Property is being sold with a tenant in place, providing immediate income. The home features an open kitchen and living room layout, stainless steel appliances including a dishwasher, and hardwood flooring in the two main-level bedrooms. The second level includes two additional carpeted bedrooms. The bathroom has an updated tiled tub surround. Exterior features include a fenced yard with a storage shed and shared off-street parking. Located on a quiet residential street with steady rental demand, this property offers a straightforward investment opportunity with existing cash flow in place.
Key facts
- Hardwood flooring
- Fenced yard
- Storage shed
Tags
Neighborhood map
What this means for you Summary
Snapshot
- This is a 4-bed/1.0-bath single-family listed at $250k.
Deal economics
- At list price, monthly cash flow is $-72 ($-864/yr) — negative.
- To cash-flow at today's rent, offer at most $237k (5.1% below list).
- To meet the 1% rule (rent ≥ 1% of price), the offer needs to be $195k (22.0% below list).
- Recommended offer: $195k (22.0% below list) — sets the bar for 1% rule.
- Cap rate 5.9% vs local median 4.8% in Halfway — meaningfully above typical; check what's discounted (condition, days-on-market, listing class) to confirm the premium yield is real.
Location & tenants
- Location reads 66/100 on livability (#225 in MD) — a middle-class / working-renter tenant base. Strengths: housing A+, cost of living A, employment A-; Watch: schools C-, crime F, amenities F.
- Washingtion County Public Schools (suburban): math 18% / reading 33% proficiency, ranked #13 of 24 in MD (top 54%) — low school quality limits family demand, transient renter base, plan for 1-2y turnover.
- Market conditions: Rents rising fast (+4.0%/yr); 368 active listings in the ZIP; 5 comparable units currently listed for rent nearby; rentals at typical pace (median 21d on market — plan ~3-4 weeks tenant-placement turnaround); 232 units permitted in Washington County in 2024 (12 in 5+ unit buildings).
- This rent runs 37% of the median local income ($63k/yr) — at the standard rent-burdened threshold; future hikes will face affordability resistance.
Forward outlook
- Local home prices are declining (-3.0%/yr); year-one equity from $2k of loan paydown is wiped out by about $8k of value loss. Plan a longer hold.
Negotiation context
- It's been on market 123 days — a 12% lower offer ($220k) is reasonable based on typical stale-listing flexibility.
- 10 sale attempts since 24y ago with the ask held roughly flat each time — persistent listings suggest the price (not the market) is what's stuck; bring a comps-based counter.
- Current owner paid $70k; list at $250k implies a 257% gain — meaningful room to come down on a strong offer.
Risks & watch-outs
- Watch-outs: built in 1941 — expect roof / HVAC / electrical / plumbing capex.
- Climate carrying-cost: extreme-heat days projected 7→16/yr by 2055 (HVAC capex compounding) — expect insurance premiums to compound above CPI over the hold.
Questions for the listing agent
- What do current leases actually rent for vs. the listed asking? Can we see a recent rent roll and the last 12 months of T-12 income?
- It's been on market 123 days. Have you received any prior offers? Is the seller open to a 22% concession, seller financing, or rate buy-down credit?
- Built in 1941 — when were the roof, HVAC, electrical panel, plumbing, and water heater last replaced?
- Why hasn't it sold? Are there any deal-killer items the seller is aware of (foundation, flood, title, zoning, code violations)?
- Is there a deadline driving the sale (1031 exchange, divorce, estate, relocation)? That informs how much negotiation room exists.
- Crime grade is F in this area — have there been break-ins, vandalism, or insurance claims at this property in the last 3 years? What carrier currently insures it and at what premium?
- The area grade is low — what's the realistic commute time and amenity access for the typical tenant pool here? Any planned neighborhood developments (good or bad) we should know about?
- What's the average days-on-market for RENTAL listings here right now (not sales)? A rising rental-DOM trend means longer vacancies and softer asking-rent achievability than the comps imply.
- What's the recent tenant-quality profile in this submarket — average credit score on applications, eviction rate, late-payment / NSF rate, and stable-employment percentage? A property-management company in the area should have these aggregated.
- How much new for-sale + rental construction is in the pipeline within 1–3 miles? Heavy new supply typically softens prices + rents 12–24 months out; constrained supply supports both.
Investment metrics
- 1% rule
- 0.78% ✗
- Cap rate
- 5.95%
- Cash-on-cash
- -1.23%
- DSCR
- 0.95
- GRM
- 10.7
CMA / ARV
- ARV (median comp)
- $277,142
- List price
- $250,000
- Delta
- -9.79%
- Verdict
- FAIR
- Comps
- 20 within 1.0 mi
Show comp detail 12 sales within ~0.75 mi
| Address | Dist | Beds/Ba | Sqft | Sold | Price | $/sf | Match |
|---|---|---|---|---|---|---|---|
| 11217 Hollywood Rd | 0.10mi | 3/1.0 (-1) | 1,248 (+4%) | 6mo | $320,000 | $256 | 79 |
| 17409 Wolford Ave | 0.15mi | 3/1.0 (-1) | 1,260 (+5%) | 9mo | $260,000 | $206 | 73 |
| 11319 Manse Rd | 0.41mi | 3/1.0 (-1) | 1,258 (+5%) | 1mo | $270,000 | $215 | 67 |
| 11108 Mountain View Cir | 0.38mi | 3/1.0 (-1) | 1,144 (-5%) | 14mo | $236,000 | $206 | 58 |
| 11117 Nursery Rd | 0.31mi | 4/1.5 | 1,363 (+13%) | 6mo | $310,000 | $227 | 56 |
| 11306 Manse Rd | 0.38mi | 3/2.0 (-1) | 1,304 (+8%) | 14mo | $300,000 | $230 | 48 |
| 948 Linwood Rd | 0.67mi | 3/2.0 (-1) | 1,152 (-4%) | 8mo | $265,000 | $230 | 46 |
| 11113 Glenside Ave | 0.36mi | 3/1.5 (-1) | 1,044 (-13%) | 10mo | $305,900 | $293 | 46 |
| 17415 Gay St | 0.50mi | 3/1.0 (-1) | 1,056 (-12%) | 9mo | $255,000 | $241 | 44 |
| 17910 Pin Oak Rd | 0.68mi | 3/2.0 (-1) | 1,148 (-5%) | 13mo | $320,000 | $279 | 40 |
| 17317 Amber Dr | 0.75mi | 3/2.0 (-1) | 1,271 (+6%) | 11mo | $285,000 | $224 | 38 |
| 17814 Stone Valley Cir | 0.70mi | 3/2.0 (-1) | 1,025 (-15%) | 6mo | $208,000 | $203 | 28 |
Match score weights: distance 35% · size 25% · config 20% · recency 20%. Top-matched comps best support the ARV.
Projected returns pro-forma
-3.0% appreciation · 4.0% rent growth · sell at horizon
- IRR
- -17.3%
- Equity multiple
- 0.38×
- Total profit
- $-43,157
- Equity at exit
- $37,276
- IRR
- -7.7%
- Equity multiple
- 0.49×
- Total profit
- $-35,361
- Equity at exit
- $21,615
Cash invested: $70,000 (down + closing). Projections, not guarantees.
Landlord ↔ Tenant lean methodology
- Overall (STATE)
- 27 Tenant-Leaning
- State Maryland
- 27 Tenant-Leaning · D+14
- County
- — inherits STATE
- City
- — inherits STATE
ZIP-level market 21740
- Rents YoY
- 4.0%
- Active inventory
- 368
- Price-to-rent
- 10.7×
Monthly cashflow live
- Estimated rent
- $1,949 high interval (Pro) →
- Mortgage (P&I)
- −$1,311
- Tax from tax record
- −$196 /mo · $2,357/yr
- Insurance
- −$104
- HOA
- −$0
- Vacancy / Maint / Mgmt
- −$409
- Net cashflow
- $-72
Break-even live
UW: 25.0% down · 7.5% · 30yr · 1.5% tax · 5.0% vac · 8.0% maint · 8.0% mgmt
Financing live
Cash to close
- Down payment
- $62,500
- Closing costs
- $7,500
- Reserves months
- —
- Total cash needed
- —
Loan-product check · same deal, 3 products live
Conventional
25% down · 7.5% · 30yr
- Down + closing
- —
- Monthly P&I
- —
- Monthly cashflow
- —
- DSCR
- —
- Eligible?
- —
Personal DTI + credit; lowest rate.
DSCR
20% down · 8.5% · 30yr
- Down + closing
- —
- Monthly P&I
- —
- Monthly cashflow
- —
- DSCR
- —
- Eligible?
- —
No personal income docs; deal must DSCR.
Hard money
10% down · 12.0% · 12mo
- Down + closing
- —
- Monthly P&I
- —
- Monthly cashflow
- —
- DSCR
- —
- Eligible?
- —
Short-term bridge; refi at stabilization.
Rent comps 5 comps
| Address | Beds | Baths | Sqft | Rent | $/sqft | DOM | Units | Dist |
|---|---|---|---|---|---|---|---|---|
| 10924 Gaywood Dr Hagerstown, MD | 3.0 | 1.0 | 1100 | $2,000 | $1.82 | 21d | 1 | 0.47mi |
| 1529 Sherman Ave Unit 1 Hagerstown, MD | 3.0 | 2.5 | 1496 | $2,100 | $1.40 | 21d | 1 | 0.65mi |
| 1527 Sherman Ave Unit 2 Hagerstown, MD | 3.0 | 2.5 | 1496 | $2,100 | $1.40 | 21d | 1 | 0.66mi |
| 17940 Garden Ln Hagerstown, MD | 1.0–3.0 | 1.0–2.0 | 1020 | $1,706 | $1.67 | 13d | 19 | 0.94mi |
| 671 Highland Way Unit 5 Hagerstown, MD | 3.0 | 1.0 | 865 | $1,500 | $1.73 | 44d | 1 | 1.49mi |
Listing history 45 events
-
2026-06-17days on market $250,000 Active 123 DOM
-
2026-06-16days on market $250,000 Active 122 DOM
-
2026-06-15days on market $250,000 Active 121 DOM
-
2026-06-14days on market $250,000 Active 119 DOM
-
2026-06-13days on market $250,000 Active 118 DOM
-
2026-06-10days on market $250,000 Active 116 DOM
-
2026-06-09days on market $250,000 Active 115 DOM
-
2026-06-08days on market $250,000 Active 114 DOM
-
2026-06-07days on market $250,000 Active 113 DOM
-
2026-06-03days on market $250,000 Active 109 DOM
-
2026-06-02days on market $250,000 Active 108 DOM
-
2026-06-01days on market $250,000 Active 107 DOM
-
2026-05-31days on market $250,000 Active 106 DOM
-
2026-05-30days on market $250,000 Active 105 DOM
-
2026-02-14$250,000 Active 725-char remark
Show marketing remark (725 chars)
A 4-bedroom, 1-bath single-family home is currently rented and ready for a new investor to purchase and add to their portfolio. Property is being sold with a tenant in place, providing immediate income. The home features an open kitchen and living room layout, stainless steel appliances including a dishwasher, and hardwood flooring in the two main-level bedrooms. The second level includes two additional carpeted bedrooms. The bathroom has an updated tiled tub surround. Exterior features include a fenced yard with a storage shed and shared off-street parking. Located on a quiet residential street with steady rental demand, this property offers a straightforward investment opportunity with existing cash flow in place.
-
2024-08-15historical
-
2024-05-06$220,000 Active
-
2014-12-14historical Withdrawn
-
2014-12-14historical
-
2014-10-07Active
-
2014-10-07$134,900
-
2014-10-07historical
-
2014-10-07historical Withdrawn
-
2014-09-05price
-
2014-07-14price
-
2014-06-11Active
-
2014-06-11$134,900
-
2013-08-15soldstatus $70,000
-
2013-07-17historical
-
2013-07-15soldstatus $70,000 Sold
-
2013-07-15soldstatus $70,000
-
2013-03-22status Contingent (No Kick Out)
-
2013-03-21historical Temporarily Off-Market
-
2013-03-21historical
-
2013-03-05price $75,000
-
2013-02-13$90,000 Active
-
2013-02-13$75,000
-
2006-03-10soldstatus $150,000
-
2006-02-28soldstatus $150,000
-
2006-01-09historical
-
2005-08-15$169,900
-
2002-09-06soldstatus $104,900
-
2002-08-29soldstatus $104,900
-
2002-07-18historical
-
2002-03-01$104,900
ⓘ Source: listings_history table (triggers on properties + properties_extension) + one-shot
backfill from property_details.listing_events for pre-trigger history.
Tax reassessment forecast MD · Partial reset (capped growth)
- Current annual tax
- $2,357 · $196/mo
- Projected year-2 tax
- $2,541 · $212/mo
- Expected delta
- +$184/yr (+$15/mo · 7.8%)
ⓘ Screening estimate from a state-policy table — verify with the county assessor before closing.
Climate risk First Street
- Flood 1/10 Low FEMA zone X (unshaded) · 0% chance over 30 yrs
- Wildfire 1/10 Low
- Heat 5/10 Major 7 d/yr ≥101°F today · 16 d/yr by 30 yrs out
- Wind 2/10 Low 2% chance of damaging wind over 30 yrs
- Air quality 3/10 Moderate 2 unhealthy d/yr today · 4 by 30 yrs out
Nearby sold comps map
Loading sold comps map…
Walkable amenities ~0.75 mi
Loading nearby amenities…
Taxation est. · year 1
- Rental income
- $23,386
- − Mortgage interest
- −$14,004
- − Property taxes
- −$2,357
- − Insurance
- −$1,250
- − Repairs & maintenance
- −$1,871
- − Management
- −$1,871
- − Depreciation
- −$7,273
- Taxable loss
- −$5,239
- Est. tax savings @ 24.0%
- +$1,257
- After-tax cash flow
- $393/yr
For passive investors: Depreciation is non-cash, so a rental often shows a tax loss while cash-flowing — sheltering income. Rental losses are passive: they offset passive income freely, and up to $25,000/yr can offset ordinary (W-2) income if you actively participate and your MAGI is under $100k (phasing out to $0 by $150k); unused losses carry forward. On sale, claimed depreciation is recaptured at up to 25%, and gains may owe capital-gains tax (a 1031 exchange can defer both). Figures are a year-1 estimate at your 24.0% rate — not tax advice; consult a CPA.
Schools (NCES district)
- District
- Washingtion County Public Schools
- NCES district ID
- 2400660
- Math proficiency
- 18% ▼ -20.00%
- Reading proficiency
- 33% ▼ -17.00%
- Median HH income
- $54,784
- Composite
- 22.87/100
- National rank
- #8007
- State rank
- #13 of 24 in MD
Livability — Halfway
- Score
- 66/100
- State rank
- #225
- US rank
- #11296
Category grades
Schools grade is shown separately in the Schools card above.
Census & demographics
- Census place
- Halfway, MD
- County
- Washington County · 98,861 people
- City population
- 64,792
- Metro
- Hagerstown-Martinsburg, MD-WV
- Population (ZIP)
- 64,792
- Household income
- $62,873
- Rent vs Own
- Severe rent burden
- 2832.0
Population outlook (Washington County) Hauer SSP2
- Today (2025)
- 151,614 people
- By 2030
- 151,455 · -0.1%
- By 2040
- 150,097 · -1.0%
- By 2050
- 148,193 · -2.3%
- By 2075
- 146,581 · -3.3%
- By 2100
- 138,025 · -9.0%
Race, ethnicity, and origin ACS 2023
- Neighborhood character
- Majority White (64%)
- Race & ethnicity
- White 64% Black 18% Two or more races 10% Hispanic / Latino 10% Asian 2%
- Hispanic origin (detail)
- Mexican 2% Puerto Rican 2% Dominican 2%
- Common ancestry
- Romanian 2% Lithuanian 1% Slovak 1%
- Foreign-born
- 9% · Canada, China
- Languages at home
- 86% English-only · Spanish 9% French/Haitian/Cajun 1% Chinese 1%
Political lean MEDSL · Washington
- 2024 margin
- Strong R (+23.0) · D 37.3% · R 60.4% · Other 2.3%
- 2008→2024 swing
- -10.2pp toward R · 2008: -12.9pp · 2024: -23.0pp
- All cycles
- 2024: R+23.0 2020: R+20.9 2016: R+32.4 2012: R+18.5 2008: R+12.9
Not yet ingested
- Civics
- —
Market trends
- HPI YoY
- ▼ -248.38%
- Current HPI
- 264.8018
- Rent YoY
- ▲ 4.00%
- Metro
- Hagerstown-Martinsburg, MD-WV
- State GDP YoY
- ▲ 2.97%
- F500 in state
- 12
Industry mix (Fortune 500 HQ in MD)
| Industry | F500 HQs | Revenue |
|---|---|---|
| Aerospace / Defense | 1 | $71B |
|
||
| Utilities | 1 | $25B |
|
||
| Hotels | 1 | $24B |
|
||
| Consumer Goods | 1 | $7B |
|
||
| Real Estate | 1 | $6B |
|
||
| Chemicals | 1 | $2B |
|
||
Price history
+138.3% since first listed31 events — show timeline
- 2026-02-14 Listed $250,000 BRIGHT MLS
- 2024-08-15 Listing Removed — BRIGHT MLS
- 2024-05-06 Listed $220,000 BRIGHT MLS
- 2014-12-14 Listing Removed — BRIGHT MLS
- 2014-12-14 Delisted — MRIS
- 2014-10-07 Listed — MRIS
- 2014-10-07 Delisted — MRIS
- 2014-10-07 Listing Removed — BRIGHT MLS
- 2014-10-07 Listed $134,900 BRIGHT MLS
- 2014-09-05 Price Changed — MRIS
- 2014-07-14 Price Changed — MRIS
- 2014-06-11 Listed — MRIS
- 2014-06-11 Listed $134,900 BRIGHT MLS
- 2013-08-15 Sold (Public Records) $70,000 Public Records
- 2013-07-17 Delisted — MRIS
- 2013-07-15 Sold (MLS) $70,000 BRIGHT MLS
- 2013-07-15 Sold (MLS) $70,000 MRIS
- 2013-03-22 Pending — MRIS
- 2013-03-21 Delisted — MRIS
- 2013-03-21 Listing Removed — BRIGHT MLS
- 2013-03-05 Price Changed $75,000 MRIS
- 2013-02-13 Listed $90,000 MRIS
- 2013-02-13 Listed $75,000 BRIGHT MLS
- 2006-03-10 Sold (Public Records) $150,000 Public Records
- 2006-02-28 Sold (MLS) $150,000 MRIS
- 2006-01-09 Delisted — MRIS
- 2005-08-15 Listed $169,900 MRIS
- 2002-09-06 Sold (Public Records) $104,900 Public Records
- 2002-08-29 Sold (MLS) $104,900 MRIS
- 2002-07-18 Delisted — MRIS
- 2002-03-01 Listed $104,900 MRIS
Property tax history
+4.9%/yrLatest (2025): $2,357 · -7.9% YoY. Source: county tax records.
Cash-flow waterfall
monthlySold comps — $/sqft
last 12 mo · ≤1 miLoading sold comps…