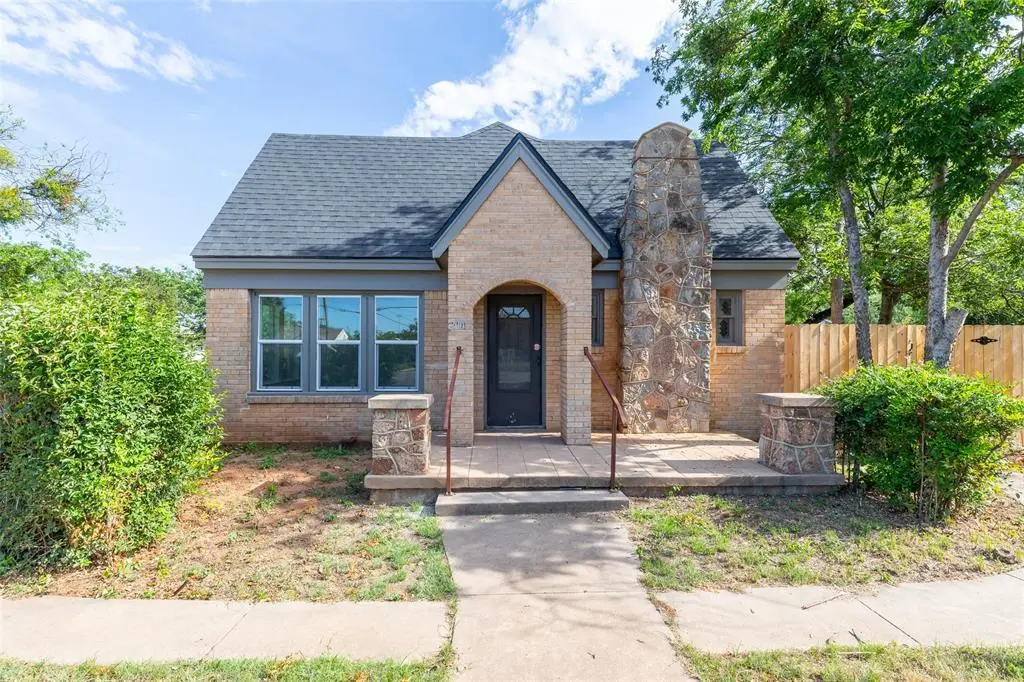
2001 S 20th St · Abilene, TX
Flood risk 1/10 · Minimal
- FEMA flood zone
- X (unshaded)
- Chance of flooding over 30 yrs
- 0.0%
- Est. flood insurance / yr
- $507 – $1,088
Fire risk 1/10 · Minimal
- Est. fire insurance / yr
- $1,222 – $2,270
Heat risk 7/10 · Major
- Hot days now (above 103°F)
- 7 days/yr
- Hot days in 30 yrs
- 23 days/yr
Wind risk 4/10 · Minor
- Chance of severe wind over 30 yrs
- 11.0%
Air-quality risk 1/10 · Minimal
- Unhealthy air days now
- 0 days/yr
- Unhealthy air days in 30 yrs
- 0 days/yr
Risk factors via First Street. Map © Google.
Why this score? — see what drove the C- grade
The composite is a weighted blend of 9 inputs, each scored 0–100. Each bar is that input's sub-score; the figure is the points it added to the 100-point composite (weight × sub-score).
- Cash flow +23.6/30.0
- DSCR +7.6/10.0
- 1% rule +5.4/10.0
- Rent growth +5.0/5.0
- Livability +3.8/5.0
- Schools +2.8/10.0
- Condition / age +2.5/5.0
- ARV discount +2.3/15.0
- Appreciation +0.0/10.0
$245,000
🖨 Deal sheet (PDF) 📄 Offer letter ✓ Due diligence
Listing remarks
Agent Owned - This beautifully maintained brick home offers great curb appeal, a spacious layout, and an oversized lot in a convenient location. Offering 3 bedrooms and 2 bathrooms, this home features a bright, airy feel with abundant natural light, fresh paint, updated windows, cabinetry, fixtures and durable luxury vinyl plank flooring throughout for easy maintenance and a clean, modern look. The spacious living room flows seamlessly into the dining area, creating the perfect space for everyday living and entertaining. The kitchen is both stylish and functional, featuring stainless steel appliances, granite countertops, and a beautiful tile backsplash that adds a touch of elegance. Just o
Key facts
- Updated windows
- Brick home
- Oversized lot
Tags
Property features AI
Finance
- HOA & community: No homeowners association
Exterior
- Parking: Driveway; Gravel parking areas; Garage faces front; Covered parking for 2 vehicles; 2-car garage
- Security: Smoke detectors
- Utilities: City water; City sewer; Curbs; Overhead utilities; Located in a municipal utility district
- Home design: Single family residence; Residential property; One story; Not attached
- Construction: Brick construction; Composition roof; Pillar/post/pier foundation; Built in 1926
- Exterior features: Covered front and rear porches; Covered porch(es); Storage; Back yard fencing with chain link and wood privacy sections; Large backyard with grass and many trees; Workshop with electric
Interior
- Kitchen: Dishwasher; Gas range; Microwave; Granite counters
- Bedrooms: 3 bedrooms (all on main level)
- Flooring: Ceramic tile; Luxury vinyl plank
- Bathrooms: 2 full bathrooms
- Heating & cooling: Central heating (natural gas); Central electric air; Ceiling fans
- Interior features: Built-in features; Cable TV available; Granite counters; High-speed internet available; One living area; One dining area; One-level home
- Laundry & utility: Utility room; Full-size washer/dryer area; Washer hookup
Neighborhood map
What this means for you Summary
Snapshot
- This is a 3-bed/1.0-bath single-family listed at $245k.
Deal economics
- At list price, monthly cash flow is $462 ($6k/yr) — positive.
- The deal already cash-flows at list — no discount required.
- Meets the 1% rule at list price ($3k rent vs $245k).
- Recommended offer: $241k (1.5% below list) — sets the bar for market timing.
- Cap rate 8.6% vs local median 6.8% in Abilene — meaningfully above typical; check what's discounted (condition, days-on-market, listing class) to confirm the premium yield is real.
Location & tenants
- Location reads 75/100 on livability (#142 in TX, #4,037 nationally) — a middle-class / working-renter tenant base. Strengths: cost of living A+, housing A+, health & safety A+; Watch: crime D, commute F.
- Abilene ISD (urban): math 32% / reading 34% proficiency, ranked #575 of 826 in TX (top 70%) — families likely to look elsewhere, expect single-tenant / working-renter base with shorter leases.
- Zoned schools: Bowie El (math 34% / reading 36%, grade F, #1,965 of 4,322 statewide, top 46%, 476 students, 87% FRL) — zoned schools average 87% FRL vs 57% district-wide (30 pts higher); higher-poverty schools than district average — tighter screening recommended.
- Market conditions: Rents rising fast (+33.5%/yr); 374 active listings in the ZIP; 11 comparable units currently listed for rent nearby; rentals at typical pace (median 23d on market — plan ~3-4 weeks tenant-placement turnaround); solid renter incomes; 508 units permitted in Taylor County in 2024 (0 in 5+ unit buildings).
- This rent runs 34% of the median local income ($90k/yr) — at the standard rent-burdened threshold; future hikes will face affordability resistance.
Forward outlook
- Local home prices are declining (-3.0%/yr); year-one equity from $2k of loan paydown is wiped out by about $7k of value loss. Plan a longer hold.
- Taylor County population projected at +16% by 2050 — long-run rental-demand tailwind backs the buy-and-hold thesis.
- At projected returns (-3.0% appreciation + 8.0% rent growth), your $69k cash investment doubles in ~8 years — after that, you're playing with house money.
Negotiation context
- It's been on market 19 days — a 2% lower offer ($241k) is reasonable based on typical stale-listing flexibility.
Risks & watch-outs
- Watch-outs: built in 1926 — expect roof / HVAC / electrical / plumbing capex.
- Climate carrying-cost: extreme-heat days projected 7→23/yr by 2055 (HVAC capex compounding) — expect insurance premiums to compound above CPI over the hold.
Questions for the listing agent
- Built in 1926 — when were the roof, HVAC, electrical panel, plumbing, and water heater last replaced?
- Is there a deadline driving the sale (1031 exchange, divorce, estate, relocation)? That informs how much negotiation room exists.
- Schools are D-rated, which usually means shorter tenancies and higher turnover. Who's the typical renter profile here, and what's been the actual vacancy rate?
- Crime grade is D in this area — have there been break-ins, vandalism, or insurance claims at this property in the last 3 years? What carrier currently insures it and at what premium?
- What's the average days-on-market for RENTAL listings here right now (not sales)? A rising rental-DOM trend means longer vacancies and softer asking-rent achievability than the comps imply.
- What's the recent tenant-quality profile in this submarket — average credit score on applications, eviction rate, late-payment / NSF rate, and stable-employment percentage? A property-management company in the area should have these aggregated.
- How much new for-sale + rental construction is in the pipeline within 1–3 miles? Heavy new supply typically softens prices + rents 12–24 months out; constrained supply supports both.
Investment metrics
- 1% rule
- 1.04% ✓
- Cap rate
- 8.56%
- Cash-on-cash
- 8.09%
- DSCR
- 1.36
- GRM
- 8.0
CMA / ARV
- ARV (on-the-fly)
- $219,492
- Comps found
- 12
Show comp detail 12 sales within ~0.75 mi
| Address | Dist | Beds/Ba | Sqft | Sold | Price | $/sf | Match |
|---|---|---|---|---|---|---|---|
| 2026 S 20th St | 0.06mi | 3/2.0 | 1,448 (-12%) | 1mo | $199,900 | $138 | 73 |
| 2302 Vine St | 0.26mi | 3/2.0 | 1,524 (-7%) | 6mo | $229,000 | $150 | 68 |
| 1457 S 18th St | 0.34mi | 3/1.0 | 1,454 (-11%) | 5mo | $177,490 | $122 | 62 |
| 2926 S 23rd St | 0.70mi | 4/1.0 (+1) | 1,624 (-1%) | 0mo | $189,900 | $117 | 61 |
| 1726 Palm St | 0.43mi | 4/2.0 (+1) | 1,716 (+5%) | 3mo | $65,000 | $38 | 60 |
| 1326 Ross Ave | 0.71mi | 3/2.0 | 1,713 (+5%) | 4mo | $229,900 | $134 | 52 |
| 1841 Sycamore St | 0.64mi | 3/2.0 | 1,778 (+8%) | 1mo | $219,900 | $124 | 51 |
| 2502 Marshall St | 0.68mi | 3/3.0 | 1,763 (+8%) | 2mo | $269,900 | $153 | 46 |
| 1441 Peach St | 0.56mi | 3/2.0 | 1,420 (-13%) | 4mo | $180,000 | $127 | 45 |
| 1325 Highland Ave | 0.67mi | 2/1.0 (-1) | 1,488 (-9%) | 5mo | $227,000 | $153 | 44 |
| 2701 S 27th St | 0.71mi | 3/2.0 | 1,440 (-12%) | 1mo | $165,000 | $115 | 42 |
| 1626 Sycamore St | 0.68mi | 3/2.0 | 1,470 (-10%) | 7mo | $225,000 | $153 | 41 |
Match score weights: distance 35% · size 25% · config 20% · recency 20%. Top-matched comps best support the ARV.
Projected returns pro-forma
-3.0% appreciation · 8.0% rent growth · sell at horizon
- IRR
- 1.2%
- Equity multiple
- 1.05×
- Total profit
- $3,184
- Equity at exit
- $36,530
- IRR
- 15.0%
- Equity multiple
- 2.49×
- Total profit
- $101,885
- Equity at exit
- $21,183
Cash invested: $68,600 (down + closing). Projections, not guarantees.
Landlord ↔ Tenant lean methodology
- Overall (STATE)
- 87 Strongly Landlord-Friendly
- State Texas
- 87 Strongly Landlord-Friendly · R+5
- County
- — inherits STATE
- City
- — inherits STATE
ZIP-level market 79602
- Home prices YoY
- -19.6%
- Rents YoY
- 33.5%
- Active inventory
- 374
- Price-to-rent
- 8.0×
Monthly cashflow live
- Estimated rent
- $2,552 high interval (Pro) →
- Mortgage (P&I)
- −$1,285
- Tax from tax record
- −$167 /mo · $2,006/yr
- Insurance
- −$102
- HOA
- −$0
- Vacancy / Maint / Mgmt
- −$536
- Net cashflow
- $462
Break-even live
Sensitivity live
| Price | -10% $601 | -5% $532 | +0% $462 | +5% $393 | +10% $324 |
|---|---|---|---|---|---|
| Rent | -10% $261 | -5% $361 | +0% $462 | +5% $563 | +10% $664 |
| Rate | -1.0pp $586 | -0.5pp $525 | base $462 | +0.5pp $399 | +1.0pp $334 |
UW: 25.0% down · 7.5% · 30yr · 1.5% tax · 5.0% vac · 8.0% maint · 8.0% mgmt
Financing live
Cash to close
- Down payment
- $61,250
- Closing costs
- $7,350
- Reserves months
- —
- Total cash needed
- —
Loan-product check · same deal, 3 products live
Conventional
25% down · 7.5% · 30yr
- Down + closing
- —
- Monthly P&I
- —
- Monthly cashflow
- —
- DSCR
- —
- Eligible?
- —
Personal DTI + credit; lowest rate.
DSCR
20% down · 8.5% · 30yr
- Down + closing
- —
- Monthly P&I
- —
- Monthly cashflow
- —
- DSCR
- —
- Eligible?
- —
No personal income docs; deal must DSCR.
Hard money
10% down · 12.0% · 12mo
- Down + closing
- —
- Monthly P&I
- —
- Monthly cashflow
- —
- DSCR
- —
- Eligible?
- —
Short-term bridge; refi at stabilization.
Rent comps 11 comps
| Address | Beds | Baths | Sqft | Rent | $/sqft | DOM | Units | Dist |
|---|---|---|---|---|---|---|---|---|
| 2402 S 20th St Abilene, TX | 2.0 | 1.0 | 2040 | $1,400 | $0.69 | 23d | 1 | 0.35mi |
| 1934 Portland Ave Abilene, TX | 3.0 | 2.0 | 1108 | $1,900 | $1.71 | 46d | 1 | 0.48mi |
| 1349 Meander St Abilene, TX | 3.0 | 1.0 | 1532 | $3,800 | $2.48 | 15d | 1 | 0.54mi |
| 801 S 17th St Abilene, TX | 3.0 | 1.0 | 1200 | $1,800 | $1.50 | 15d | 1 | 0.83mi |
| 2601 Edgemont Dr Abilene, TX | 2.0 | 2.0 | 1624 | $2,495 | $1.54 | 23d | 1 | 0.86mi |
| 3173 Hunt St Abilene, TX | 3.0 | 1.5 | 1300 | $2,250 | $1.73 | 46d | 1 | 0.95mi |
| 889 Ross Ave Abilene, TX | 2.0 | 1.0 | 1223 | $1,700 | $1.39 | 23d | 1 | 1.07mi |
| 3250 College St Abilene, TX | 2.0 | 1.0 | 1148 | $1,595 | $1.39 | 23d | 1 | 1.14mi |
| 725 Peach St Abilene, TX | 3.0 | 2.0 | 1618 | $3,500 | $2.16 | 23d | 1 | 1.22mi |
| 3373 S 27th St Abilene, TX | 2.0 | 2.0 | 1436 | $1,700 | $1.18 | 46d | 1 | 1.33mi |
| 3409 High Meadows Dr Abilene, TX | 3.0 | 2.0 | 1987 | $2,995 | $1.51 | 23d | 1 | 1.42mi |
Listing history 14 events
-
2026-06-22days on market $245,000 Active 19 DOM
-
2026-06-19days on market $245,000 Active 17 DOM
-
2026-06-18days on market $245,000 Active 16 DOM
-
2026-06-17days on market $245,000 Active 15 DOM
-
2026-06-16statusdays on market $245,000 Active 14 DOM
-
2026-06-15days on market $245,000 Active Option Contract 13 DOM
-
2026-06-14days on market $245,000 Active Option Contract 11 DOM
-
2026-06-13days on market $245,000 Active Option Contract 10 DOM
-
2026-06-10days on market $245,000 Active Option Contract 8 DOM
-
2026-06-09days on market $245,000 Active Option Contract 7 DOM
-
2026-06-08days on market $245,000 Active Option Contract 6 DOM
-
2026-06-07statusdays on market $245,000 Active Option Contract 5 DOM
-
2026-06-03remarks 699-char remark
-
2026-06-03$245,000 Active 1 DOM
ⓘ Source: listings_history table (triggers on properties + properties_extension) + one-shot
backfill from property_details.listing_events for pre-trigger history.
Tax reassessment forecast TX · Resets to sale price
- Current annual tax
- $2,006 · $167/mo
- Projected year-2 tax
- $4,484 · $374/mo
- Expected delta
- +$2,478/yr (+$206/mo · 123.5%)
ⓘ Screening estimate from a state-policy table — verify with the county assessor before closing.
Climate risk First Street
- Flood 1/10 Low FEMA zone X (unshaded) · 0% chance over 30 yrs
- Wildfire 1/10 Low
- Heat 7/10 Severe 7 d/yr ≥103°F today · 23 d/yr by 30 yrs out
- Wind 4/10 Moderate 11% chance of damaging wind over 30 yrs
- Air quality 1/10 Low 0 unhealthy d/yr today · 0 by 30 yrs out
Nearby sold comps map
Loading sold comps map…
Walkable amenities ~0.75 mi
Loading nearby amenities…
Taxation est. · year 1
- Rental income
- $30,628
- − Mortgage interest
- −$13,724
- − Property taxes
- −$2,006
- − Insurance
- −$1,225
- − Repairs & maintenance
- −$2,450
- − Management
- −$2,450
- − Depreciation
- −$7,127
- Taxable income
- $1,645
- Est. tax owed @ 24.0%
- −$395
- After-tax cash flow
- $5,152/yr
For passive investors: Depreciation is non-cash, so a rental often shows a tax loss while cash-flowing — sheltering income. Rental losses are passive: they offset passive income freely, and up to $25,000/yr can offset ordinary (W-2) income if you actively participate and your MAGI is under $100k (phasing out to $0 by $150k); unused losses carry forward. On sale, claimed depreciation is recaptured at up to 25%, and gains may owe capital-gains tax (a 1031 exchange can defer both). Figures are a year-1 estimate at your 24.0% rate — not tax advice; consult a CPA.
Schools (NCES district)
- District
- Abilene ISD
- NCES district ID
- 4807440
- Math proficiency
- 32% ▼ -11.00%
- Reading proficiency
- 34% ▼ -5.00%
- Median HH income
- $39,782
- Composite
- 27.71/100
- National rank
- #6909
- State rank
- #575 of 826 in TX
Livability — Abilene
- Score
- 75/100
- State rank
- #142
- US rank
- #4037
Category grades
Schools grade is shown separately in the Schools card above.
Census & demographics
- Census place
- Abilene, TX
- County
- Taylor County · 136,672 people
- City population
- 136,672
- Metro
- Abilene, TX
- Population (ZIP)
- 27,425
- Household income
- $89,551
- Rent vs Own
- Severe rent burden
- 338.0
Population outlook (Taylor County) Hauer SSP2
- Today (2025)
- 145,270 people
- By 2030
- 150,050 · +3.3%
- By 2040
- 159,417 · +9.7%
- By 2050
- 168,883 · +16.3%
- By 2075
- 194,436 · +33.8%
- By 2100
- 203,163 · +39.9%
Race, ethnicity, and origin ACS 2023
- Neighborhood character
- Majority White (64%)
- Race & ethnicity
- White 64% Hispanic / Latino 22% Two or more races 12% Black 10% Asian 2%
- Hispanic origin (detail)
- Mexican 19%
- Common ancestry
- Romanian 2% Italian 2% Portuguese 2%
- Foreign-born
- 6% · Canada, Vietnam, Jamaica
- Languages at home
- 87% English-only · Spanish 9% Other Asian/Pacific 1% French/Haitian/Cajun 1%
Political lean MEDSL · Taylor
- 2024 margin
- Solid R (+49.8) · D 24.6% · R 74.4% · Other 1.0%
- 2008→2024 swing
- -4.2pp toward R · 2008: -45.6pp · 2024: -49.8pp
- All cycles
- 2024: R+49.8 2020: R+45.3 2016: R+51.1 2012: R+53.6 2008: R+45.6
Not yet ingested
- Civics
- —
Market trends
- HPI YoY
- ▼ -46.04%
- Current HPI
- 189.3098
- Rent YoY
- ▲ 33.46%
- Metro
- Abilene, TX
- State GDP YoY
- ▲ 3.95%
- F500 in state
- 110
Industry mix (Fortune 500 HQ in TX)
| Industry | F500 HQs | Revenue |
|---|---|---|
| Energy | 16 | $1,198B |
|
||
| Technology | 5 | $198B |
|
||
| Engineering / Construction | 4 | $72B |
|
||
| Energy Services | 3 | $60B |
|
||
| Utilities | 3 | $41B |
|
||
| Healthcare | 2 | $330B |
|
||
Price history
1 event — show timeline
- 2026-06-02 Listed $245,000 NTREIS
Property tax history
+3.3%/yrLatest (2025): $2,006 · +13.0% YoY. Source: county tax records.
Cash-flow waterfall
monthlySold comps — $/sqft
last 12 mo · ≤1 miLoading sold comps…